
Tokyo real estate market report
Record counts Urbalytics aggregates every month for the 55 municipalities of Tokyo. 51 of them clear the publication threshold (10+ records). Latest month: September 2026.
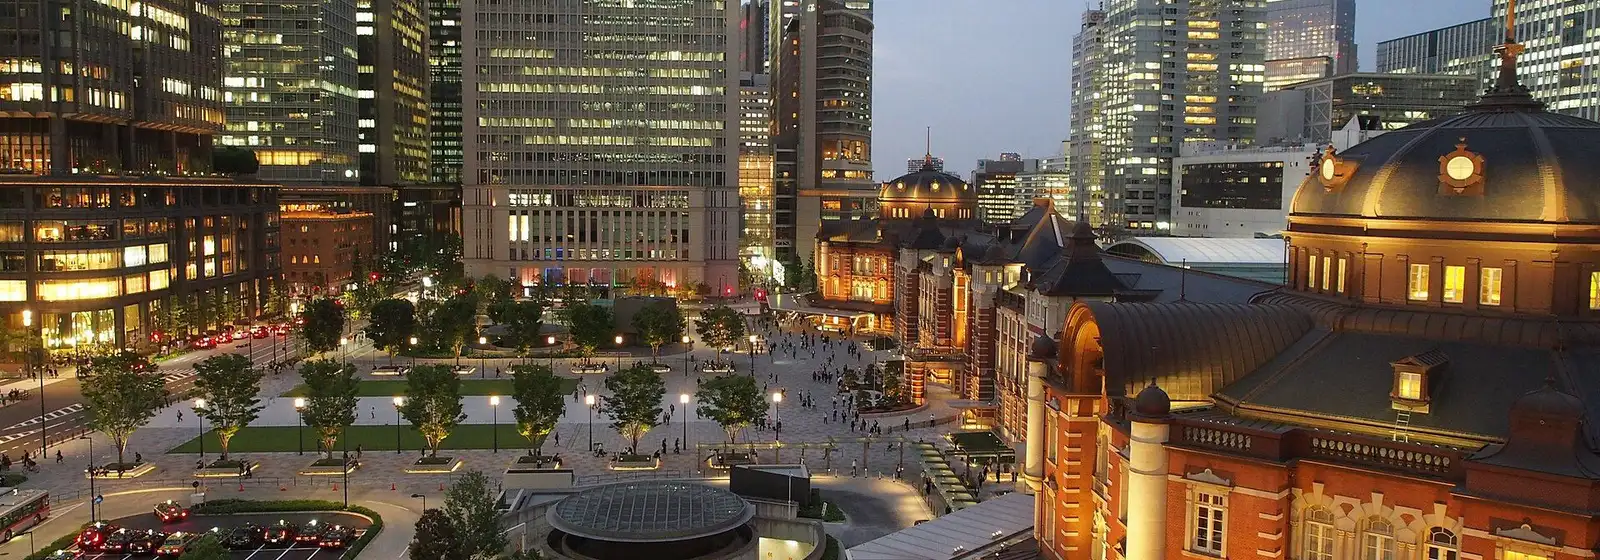
Tokyo Station Marunouchi Building P5228·Kestrel/CC BY-SA 4.0 (cropped)·Wikimedia Commons
Tokyo 23 wards: records by area
#The special wards. Transactions concentrate in the centre, and every property type has a thick sample.
Lower unit prices and higher yields are the cheap end. The darker band is the top 10%.
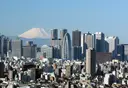
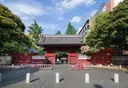
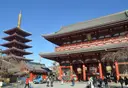
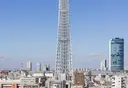
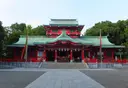
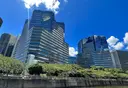

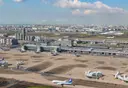
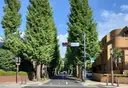
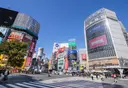

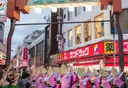
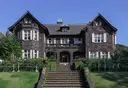



Area photographs from Wikimedia Commons (author and licence for each are given on that area’s own report page).
A dash means nothing of that type was on the market in that area that month. Figures are each area’s median (outliers dropped by the IQR rule), the same numbers the type pages publish. A metric is computed from as little as one record, but anything under 3 records is indicative only — the median of one or two listings is a fact about those listings rather than about the area — so those cells are excluded from the quartile shading and from the weighted figures on the cards above, though they are still shown. The cards weight areas with 3 records or more by record count; they are not the median for Tokyo 23 wards as a whole, which is not a grain we keep.
Tama and the islands (cities): records by area
#The municipalities outside the 23 wards. Mostly houses and land, at unit prices an order of magnitude away from the wards.
Lower unit prices and higher yields are the cheap end. The darker band is the top 10%.

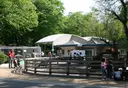

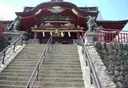
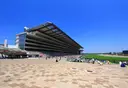
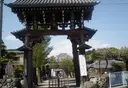
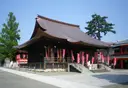
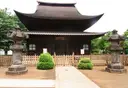
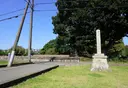
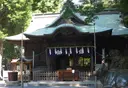
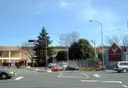
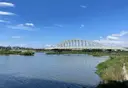

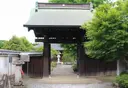
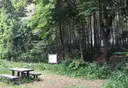

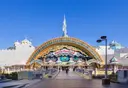
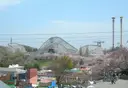


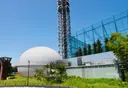

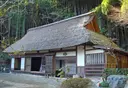


Area photographs from Wikimedia Commons (author and licence for each are given on that area’s own report page).
A dash means nothing of that type was on the market in that area that month. Figures are each area’s median (outliers dropped by the IQR rule), the same numbers the type pages publish. A metric is computed from as little as one record, but anything under 3 records is indicative only — the median of one or two listings is a fact about those listings rather than about the area — so those cells are excluded from the quartile shading and from the weighted figures on the cards above, though they are still shown. The cards weight areas with 3 records or more by record count; they are not the median for Tama and the islands (cities) as a whole, which is not a grain we keep.
Latest articles
Urbalytics analysis built on price-revision history, closed sales and rental data.
- Area & Property SpotlightAfter Site Clearance: The supply gap at the 9,471㎡ state-owned parcel by Shinjuku Station
- Price WatchFour in ten Tokyo resale condos have cut their price, and price cuts are up 57% in a year
- Market AnalysisInterest rates rose 0.37 percentage points in a month—can you cancel the contract you already signed?
- Market AnalysisNon-residents can finance property in Japan—the hurdle sits in the "annual income" line
- Market Analysis15 hectares lie vacant at the station front, yet prices are 30% below the Kanagawa average: Sagamihara Station North Exit is bottlenecked by a costly rail elevation
- Market AnalysisWhen the Crocodile’s Mouth Opens: Tokyo resale condo asks keep climbing while closings stall
Find properties in Tokyo
Individual listings, price-change history, closed transactions and AI valuations are available on a free account.