Words: 1755 | Estimated Reading Time: 9 minutes | Views: 128
The average asking price for resale condominiums in Tokyo’s 23 wards has surpassed 130 million yen, but buyers’ borrowing capacity is being eroded by higher interest rates, tearing the spread open into a crocodile’s mouth.
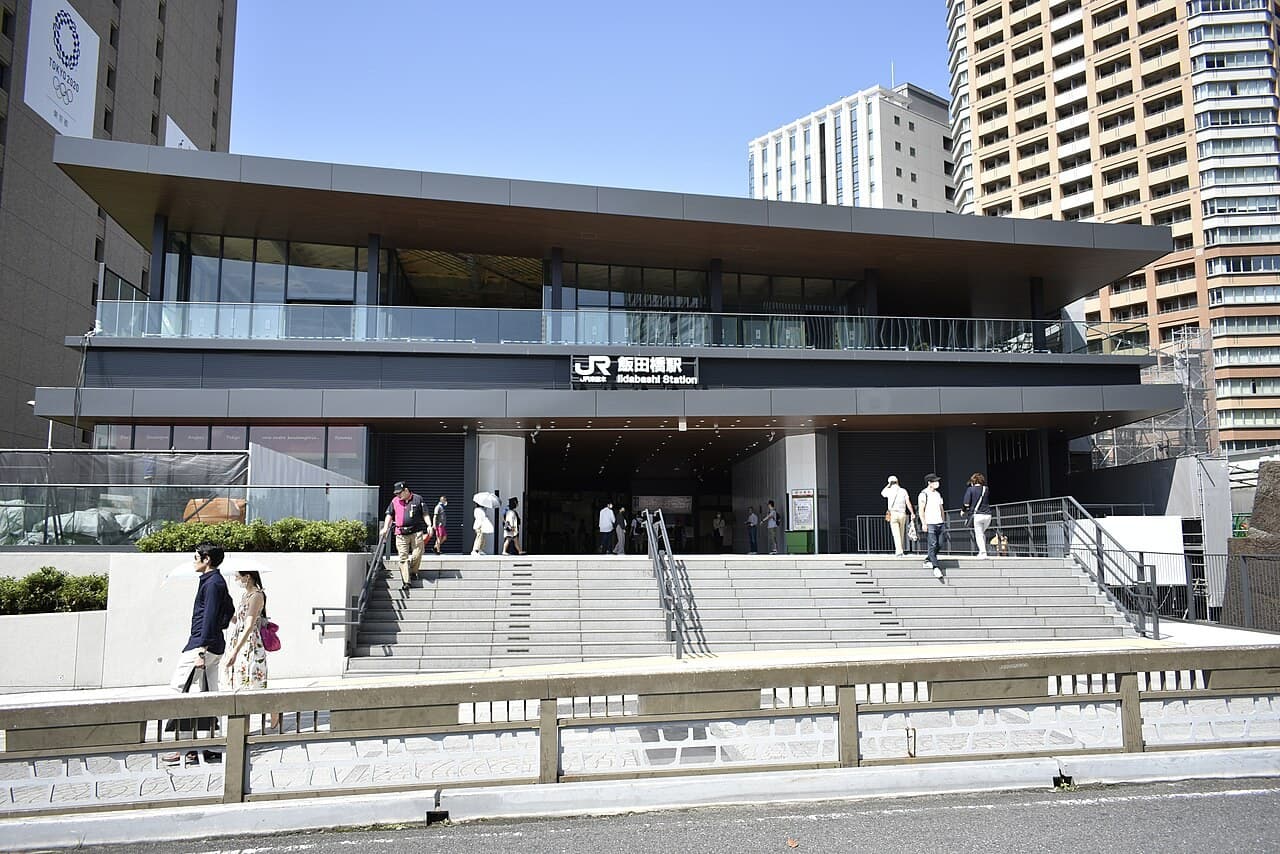
On the morning of October 2, at a brokerage’s morning meeting in Iidabashi, Head of Sales Tomoko Azuma shared a signal: a client had just cut their ask by roughly 10 million yen in one go. In a capital-region market that for years only moved prices up, that sentence alone was telling.
Even clearer was the chart she showed next—closed transactions have been down year over year since early this year, while the blue bars for inventory have marched higher. As the two lines diverge, the industry has a name for the shape: “Wani no Kuchi” (crocodile mouth).
Find properties in 東京都港区
Individual listings, price-change history, closed transactions and AI valuations are available on a free account.
The crocodile’s upper jaw: asking prices are still anchored in the old world
The upper jaw is the seller’s price. In August 2026, the average ask per unit for resale condos in Tokyo’s 23 wards was about 130 million yen—the product of a decade-long one-way climb and the psychological anchor it created for sellers.
The problem is that this anchor is calibrated to “what sold last year.” When the market turns, the ask is the slowest price to respond—because it doesn’t require a counterparty’s agreement; one person can post it.
The lower jaw is what buyers can actually pay, and that line is set by banks, not by sentiment. As the gap between the two widens, deals naturally get stuck in the middle.
Masakatsu Nakane, Head of Operations at a brokerage, put it plainly: “Unless prices come down further, supply and demand won’t line up.” This isn’t a weak market so much as a temporary breakdown in price discovery.
The crocodile’s lower jaw: every 0.5% move in rates costs you a car’s worth of down payment
Pushing the lower jaw down are mortgage rates after consecutive Bank of Japan hikes. A simple scenario cited in reporting is intuitive: for a household earning 7 million yen a year taking a 35-year mortgage, a 0.5 percentage point rise in rates cuts the bank’s lending cap from 56.46 million yen to 52.70 million yen.
Nearly 4 million yen of capacity evaporates without the buyer even noticing. For end-users, this isn’t “whether to buy,” but “whether the bank will allow you to buy.”
That same day, commentary around the BOJ’s Tankan echoed the point—“If interest rates continue to rise, the burden will become heavy.” Pressure on buyers and on holders are two sides of the same coin.
Real estate journalist Atsushi Sakaki went further: “This means the real demand cohort relying on mortgages has already exceeded its capacity to pay.” He added that circulation in resale listings is getting heavier and beginning to stick.
Evidence in the numbers: the list-to-sale spread widened to 6.22%
This isn’t just on-the-ground anecdote. A Tokyo Kantei report published July 30, 2026 shows the capital region’s price divergence (ask vs. closing) at -6.22% in 2H 2025, widening from -6.14% in the prior period.
A wider divergence means sellers are conceding more from ask to close. The report points to one segment in particular—nearly-new stock that’s almost indistinguishable from new builds—many of which were set at “overly ambitious ‘challenge’ prices.”
The more aggressive the ask, the longer the path to closing. That’s why, in the same market, some listings sell in three weeks while others keep cutting for half a year.
Why Minato Ward has become a cluster of “risky stations”
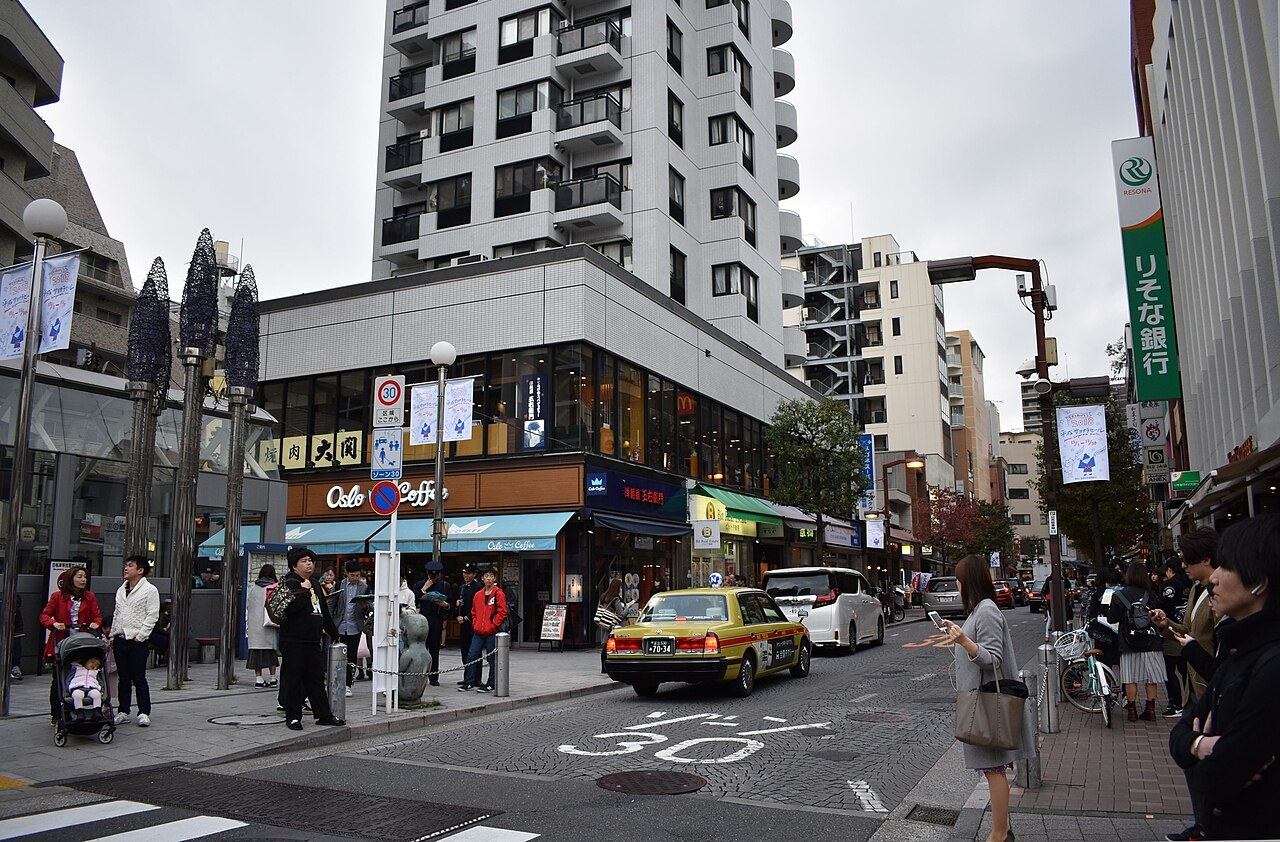
Money Post Web, working with big-data firm Estate Technologies, ranked stations in the capital region by year-over-year deterioration in days-on-market to produce a list of “risky stations.” Minato Ward accounts for seven stations in the top 50: Mita, Shiodome, Roppongi-itchome, Azabu-Juban, Akasaka, Roppongi, and Tamachi.
Atsushi Sakaki explains that Minato has long had many sellers posting “challenge” prices. He also cautions that when a station has few transactions, a handful of slow cases can skew the deterioration rate—so don’t avoid an area just because it appears in a ranking.
From Urbalytics platform data, Minato’s real structural issue isn’t days-on-market but yield itself. Over the past 15 months, the median gross yield for whole-building assets around Azabu-Juban Station was just 2.90%, versus 3.45% around Iidabashi and 3.83% around Tamachi (the latter two have fewer samples and are for reference).
A 2.9% gross yield leaves almost no safety cushion with mortgage rates rising. Either rents catch up, or prices come down—there’s no third path.
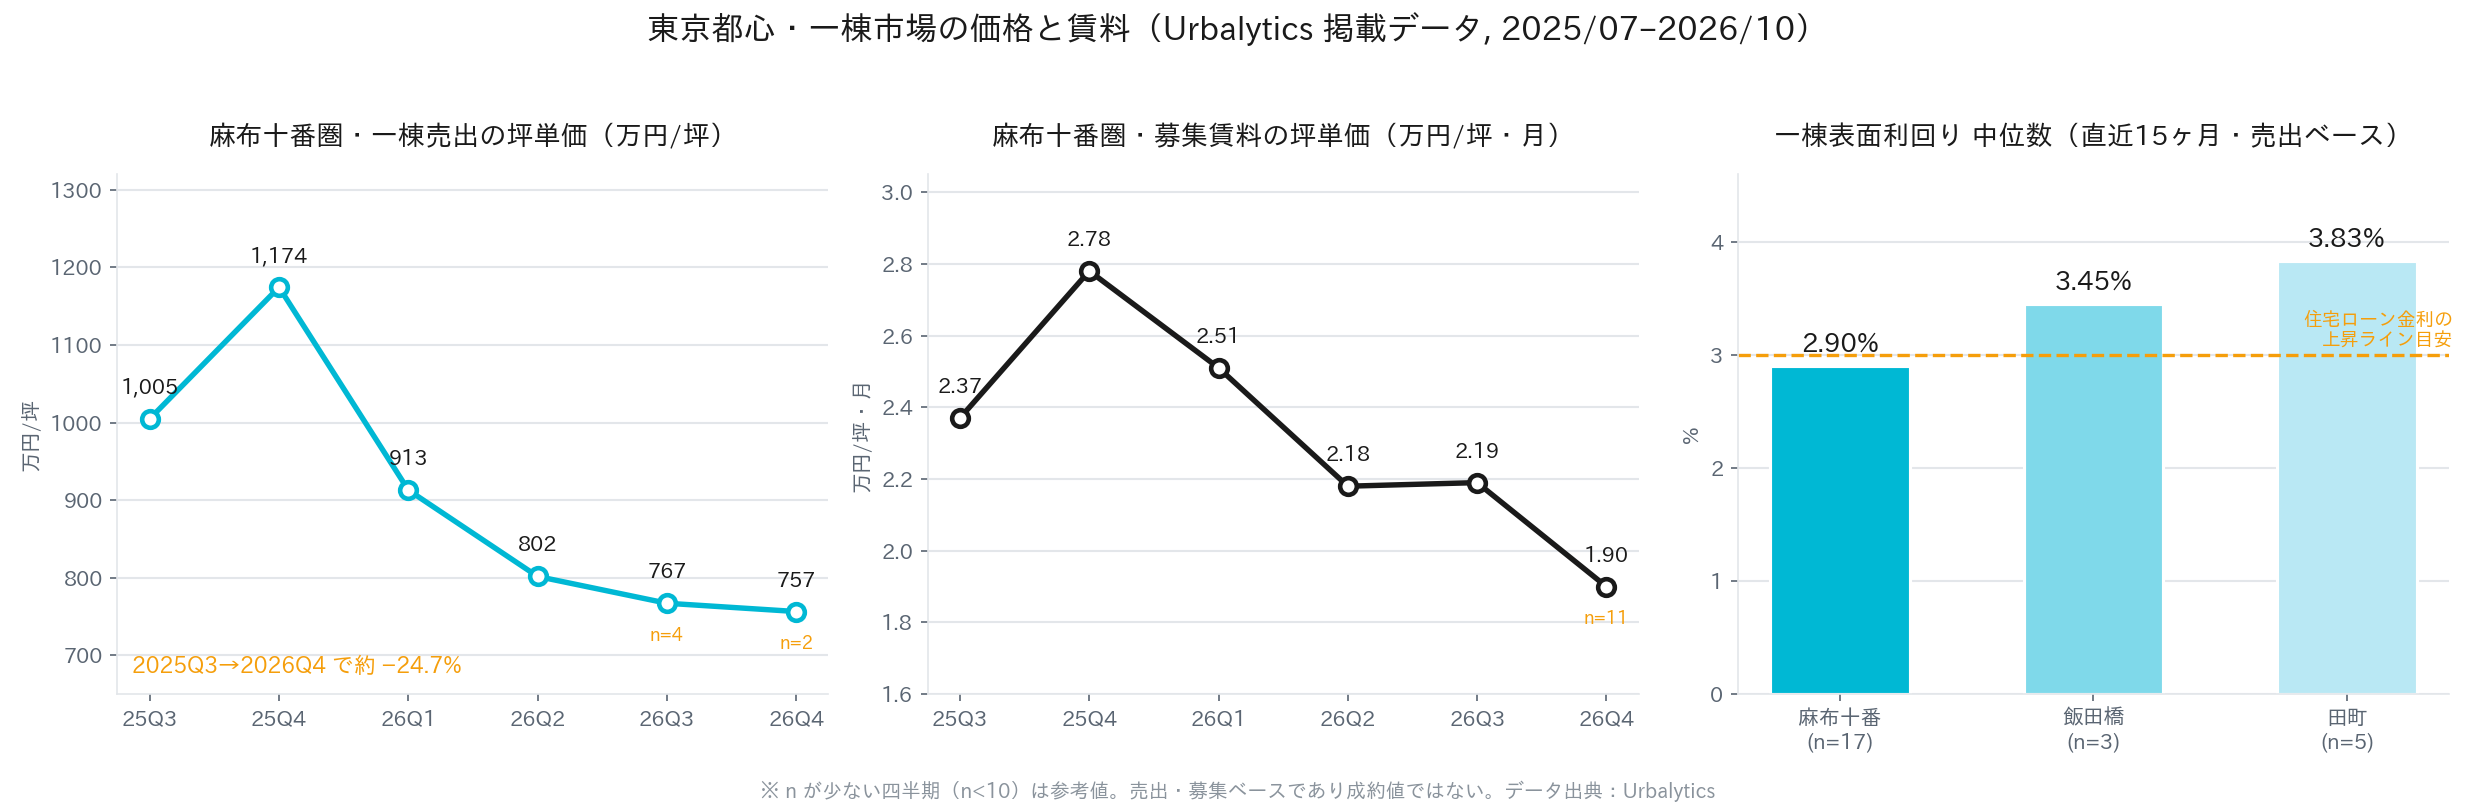
Urbalytics Insight Data posted on Urbalytics show that the average price per tsubo for whole-building assets in the Azabu-Juban station area fell from about 10.04 million yen/tsubo in Q3 2025 to about 7.56 million yen/tsubo in Q4 2026, a decline of nearly 25%. Over the same period, asking rents per tsubo fell from 23,700 yen/tsubo·month to 19,000 yen/tsubo·month. Weakness in both prices and rents indicates the adjustment here isn’t just about liquidity; the pricing benchmark itself is being reset.
Not a broad stall: outer-ring stations are catching demand pushed out
The widest crocodile mouths are exactly where unit prices are highest. That doesn’t mean the entire capital region is stalling; demand is being reallocated by higher rates.
Another data point the same day offers a contrast: in Nifty Real Estate’s 2026 station ranking, stations along Tobu Railway in southeastern Saitama jumped by as many as 12 places, with Omiya taking the top spot with a relative score of 100.0, driven by “through-service to the city center” and family-friendly environments.
This is no accident. When total prices in the 23-ward core shut out end-users, those budgets don’t disappear—they migrate along through-service lines to station areas where the commute is 15–20 minutes longer but total price is a full tier lower.
For investors, that migration path is more worth tracking than “where will fall.” Cooling in high-price core assets and warming in outer-ring stations can coexist in the same quarter. Using a citywide average chart to time buys and sells will inevitably misread one side.
The overlooked third hand: another reason listings don’t move is renovation
The second chokepoint Sakaki highlights rarely shows up in macro data but tangibly blocks deals: renovation (reform) can’t get done.
Rising materials and labor costs have pushed up both new-build prices and renovation quotes, while contractors are trapped between higher costs and acute labor shortages, with backlogs they can’t clear. More critically, renovate-and-resell operators have long locked in contractor capacity, so individual sellers often can’t get on the schedule.
He estimates the magnitude as: renovation quotes are 3–4 times higher than a decade ago. Partial upgrades run 5–6 million yen; full-gut renovations often exceed 10 million yen.
That leaves ~20-year-old stock in the toughest spot:
First, sell as-is and buyers will compare it with freshly renovated comps in the same area, concluding, “If it’s only 2–3 million more, of course I’ll take the renovated one,” leaving as-is units to stagnate.
Second, try to renovate but can’t secure a contractor, or the quote eats all expected profit—effectively taking a loss before listing.
Third, sell to a renovate-and-resell operator for convenience; the offer is usually deeply discounted, effectively handing over the entire renovation profit plus a risk premium.
Risk warning For cross-border investors, the easiest misread in this phase is confusing “asking price” with “achievable closing price.” Most prices on public portals still reflect the upper-jaw level, with an average gap of about 6%—and larger in individual cases—to where deals actually sign. If you back into yields from asks, you will systematically overstate returns; for ~20-year-old, unrenovated stock, add an extra allowance for underappreciated renovation cost and scheduling risk.
How the crocodile mouth will close
Shinji Fukushima, Head of Data Analysis at Mansion Research, offers a measured path: no one will keep pricing at levels that don’t sell, so further rises in closing prices are unlikely; more likely is that new asking prices step down gradually, closing the mouth from the upper jaw.
The weight of this view is in what it rules out. It neither calls for a crash nor for closing prices to keep surging—it assumes a period of sideways closing prices while asks slowly converge downward.
For holders, the cost in this period is liquidity, not book value; for buyers, negotiation room is opening, but the dispersion in listing quality will widen in parallel.
One nuance: the seller base isn’t monolithic. Tomoko Azuma observes that must-sell clients proactively cut prices, while asset-holding sellers who are merely “happy to sell at the right price” barely move—meaning inventory will accumulate a cohort of long-stale “decorative listings” that make headline stats look worse than true conditions.
Conclusion: this is a market where you need to run the numbers again
Over the past decade in Tokyo’s resale condo market, picking the right area often sufficed—underwriting precision mattered less. With the crocodile mouth open, that margin for error is gone.
Only two questions matter now: how far this listing’s ask is from actual closing levels in its station area, and whether its rent can support today’s mortgage rates.
Neither can be answered by eyeballing. Put the listing ask, the station-area rent per tsubo, and the whole-building yield distribution into Urbalytics; the very first chart will show how wide the mouth is.
#TokyoResaleCondos #WaniNoKuchi #PriceDivergence #Tokyo23Wards #MinatoWard #AzabuJuban #Iidabashi #BunkyoWard #MortgageRates #GrossYield #RenovationCosts #ResaleCondo #JapanRealEstate #CrossBorderInvestment #Urbalytics
References
1. TV Asahi (ANN) / Yahoo! News, 2026, Condo price “crocodile mouth” phenomenon: deals fail, inventory surges; both sellers and buyers under pressure, https://news.yahoo.co.jp/articles/1786f551f56c2e3cac3ae6fe9e60dd7afc6eb9da
2. Money Post Web / Yahoo! News, 2026, [Even in Bunkyo Ward: “Resale condos aren’t getting buyers!”] Expert analyzes why Minato Ward has many “risky stations”, https://news.yahoo.co.jp/articles/89da7113e71a89eabba21b7a82b46f58215bb070
3. Tokyo Kantei, 2026, Resale Condominium Price Divergence Report (2H 2025, published July 30, 2026) — cited in the articles above
4. Jiji Press, 2026, The benefits of AI are spreading widely; sentiment improves even among SMEs. Higher crude prices cloud the outlook — BOJ Tankan [In-depth], https://news.yahoo.co.jp/articles/c3f3603eccd1322f8088e137cfd7caaf0f991e87
5. Kenbiya, 2026, Will the pace of borrowing-rate hikes accelerate? The BOJ may shift from raising every six months to every three months, https://www.kenbiya.com/ar/
6. Urbalytics, 2026, Azabu-Juban / Iidabashi / Tamachi station areas: whole-building yield statistics and rent statistics (platform data, retrieved October 3, 2026), https://www.urbalytics.jp/market
7. Merkmal / Yahoo! News, 2026, Why did “stations in southeastern Saitama” jump by 12 ranks? The reality of Tobu Railway lines, praised for through-service to the city center and child-rearing environments, https://news.yahoo.co.jp/articles/b57579e80622428ab58ee401ca397709a910c5ef
Copyright: This article is original content by the author. Please do not reproduce, copy, or quote without permission. For usage requests, please contact the author or this site.
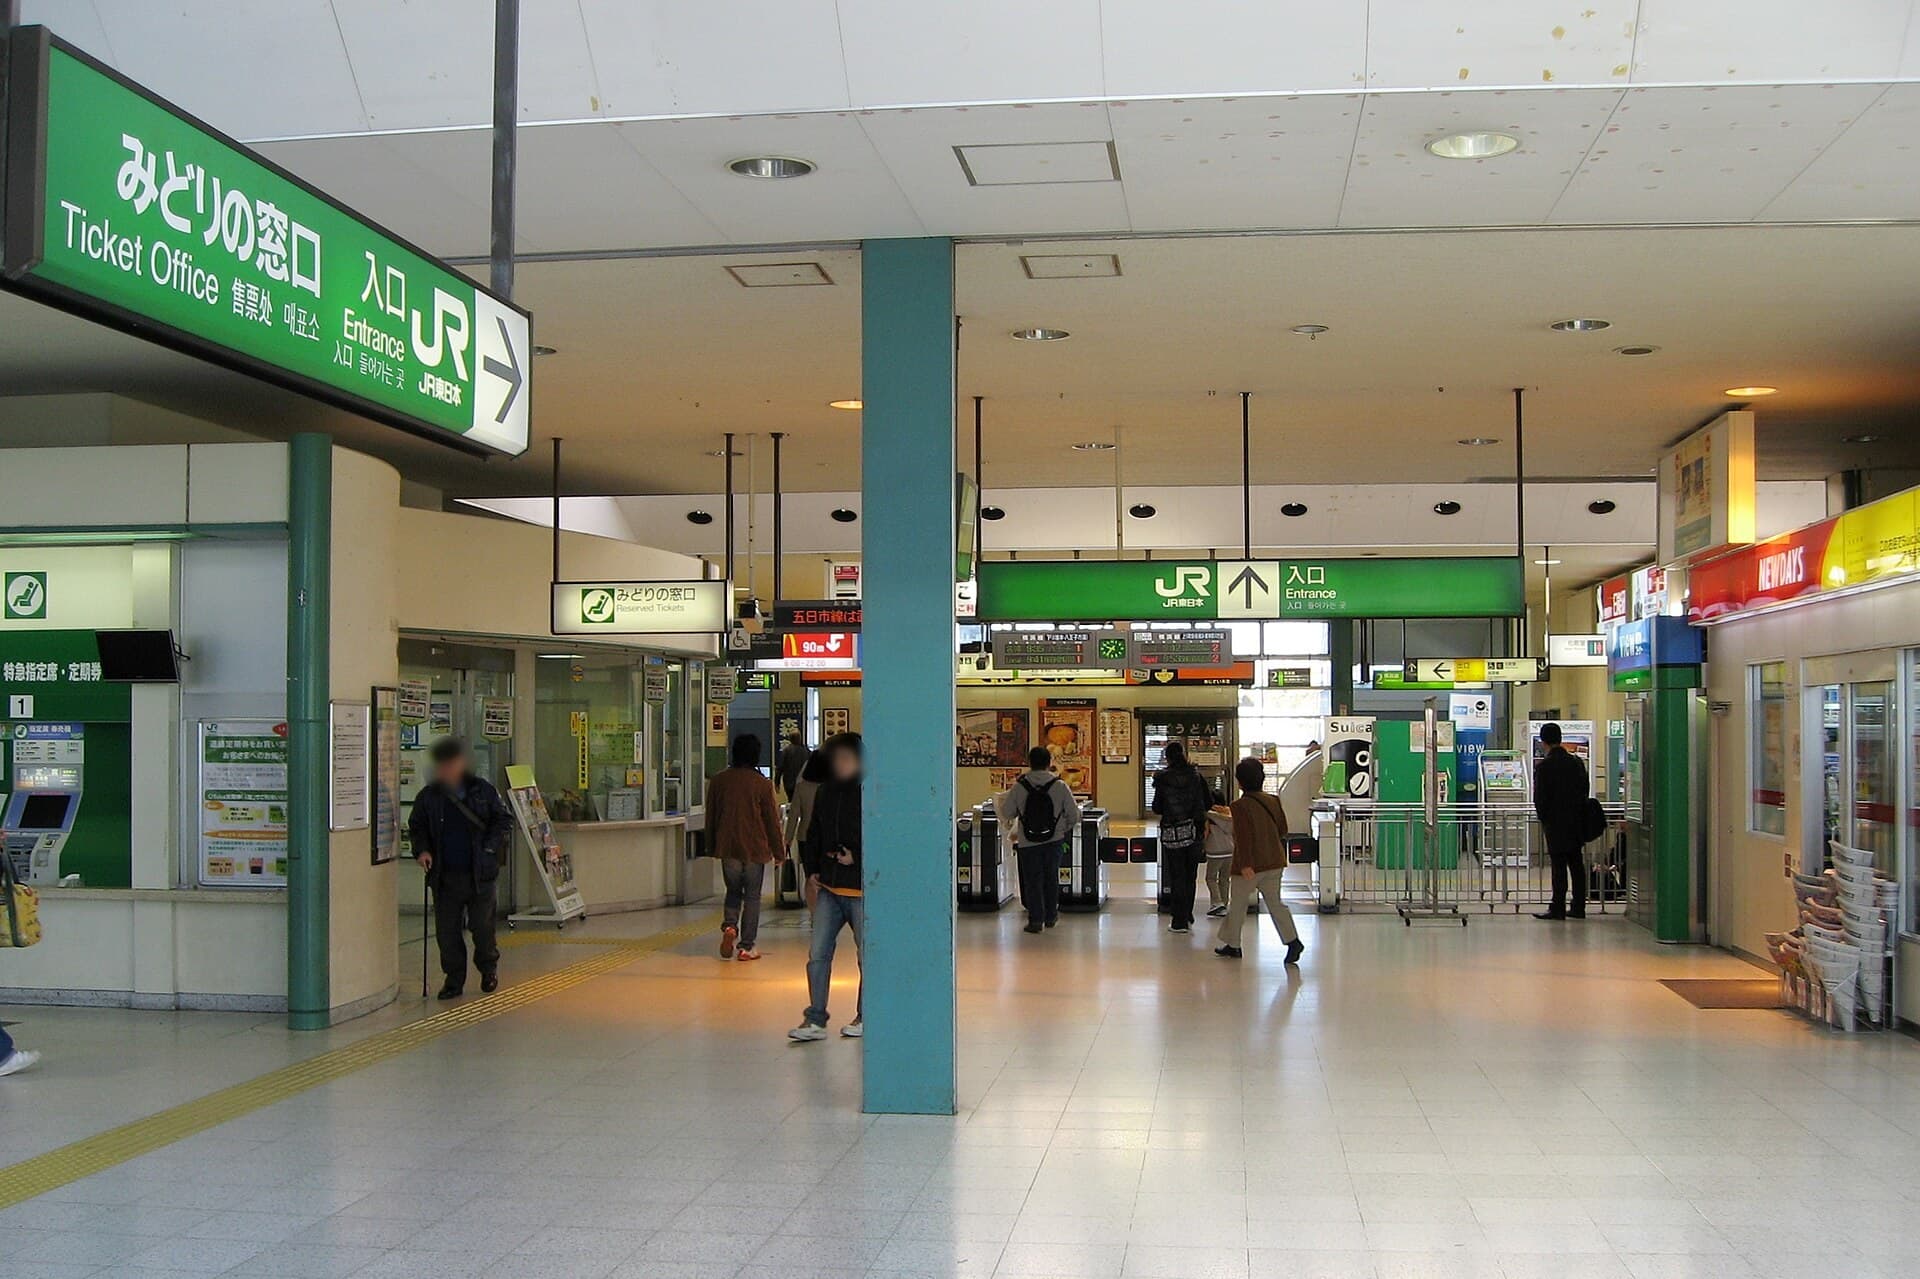
Photos in this article: 20110405-TokyoTower-Sakura 東京太郎/CC BY-SA 3.0(トリミング) Wikimedia Commons·Tamachi station SEIBU LINER/CC BY-SA 4.0(トリミング) Wikimedia Commons·Iidabashi Station 200719a 江戸村のとくぞう This photo was taken with Nikon D3400/CC BY-SA 4.0(トリミング) Wikimedia Commons·Azabujuban-Sta- Nyao148/CC BY-SA 3.0(トリミング) Wikimedia Commons·Azabu-Jūban 2018a 江戸村のとくぞう/CC BY-SA 4.0(トリミング) Wikimedia Commons