
Kanagawa real estate market report
Record counts Urbalytics aggregates every month for the 58 municipalities of Kanagawa. 57 of them clear the publication threshold (10+ records). Latest month: September 2026.
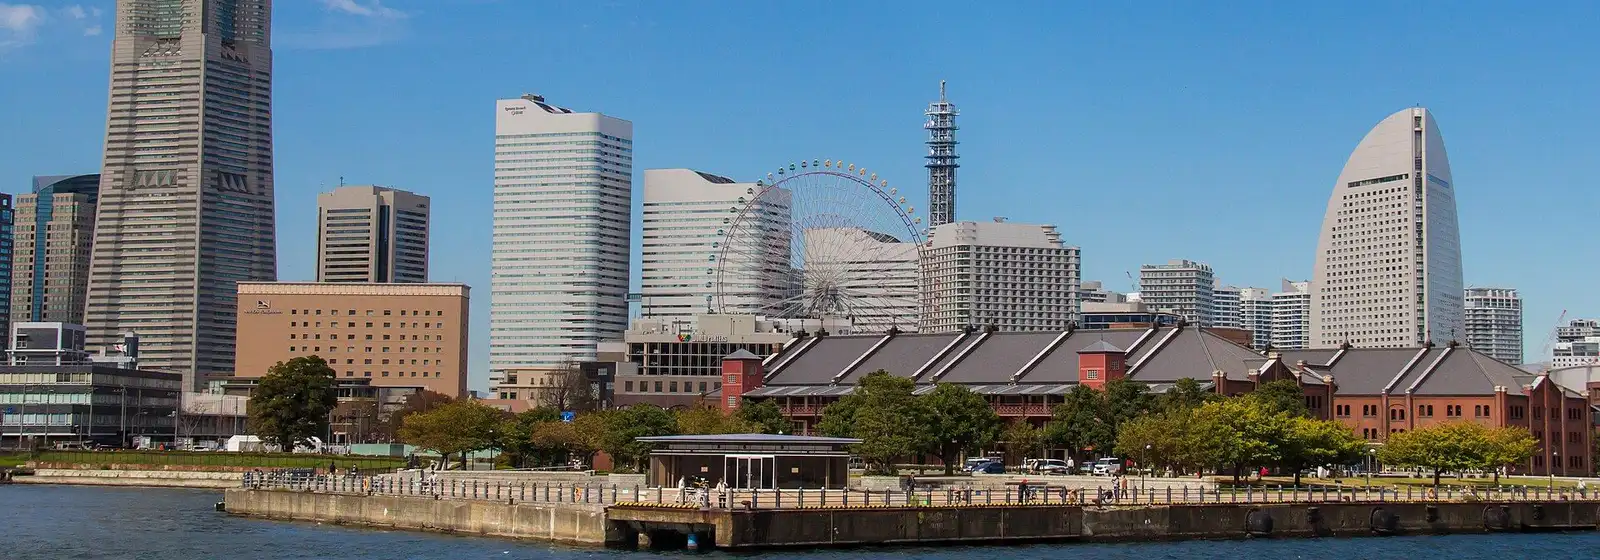
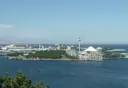
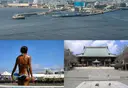
横浜みなとみらい地区·Japanbird/CC BY-SA 4.0 (cropped)·Wikimedia Commons
Yokohama: records by area
#18 administrative wards, and the centre of gravity for the prefecture.
Lower unit prices and higher yields are the cheap end. The darker band is the top 10%.
| Area | Income building | Condominium | House | Land | Total(records) | ||||
|---|---|---|---|---|---|---|---|---|---|
| Records | Gross yield% | Records | Price per ㎡ of floor area ¥M/㎡ | Records | Price per tsubo of floor area ¥M/tsubo | Records | Price per buildable tsubo ¥M/tsubo | ||
| 神奈川県 overall | 948 | 6.70 | 5,766 | 0.52 | 4,957 | 1.44 | 2,366 | 0.61 | 14,037 |
| 鶴見区 | 37 | 6.48 | 236 | 0.55 | 133 | 1.57 | 59 | 0.89 | 465 |
| 神奈川区 | 33 | 6.00 | 212 | 0.74 | 99 | 1.66 | 37 | 1.10 | 381 |
| 西区 | 22 | 6.10 | 224 | 1.02 | 36 | 2.08 | 17 | 0.86 | 299 |
| 中区 | 26 | 5.72 | 332 | 0.75 | 62 | 1.58 | 36 | 1.01 | 456 |
| 南区 | 47 | 6.70 | 258 | 0.51 | 108 | 1.43 | 48 | 0.72 | 461 |
| 保土ケ谷区 | 26 | 6.75 | 155 | 0.35 | 108 | 1.59 | 31 | 0.57 | 320 |
| 磯子区 | 23 | 7.19 | 147 | 0.40 | 84 | 1.60 | 38 | 0.80 | 292 |
| 金沢区 | 26 | 6.35 | 142 | 0.32 | 122 | 1.53 | 46 | 0.74 | 336 |
| 港北区 | 33 | 5.49 | 307 | 0.68 | 120 | 2.05 | 70 | 1.39 | 530 |
| 戸塚区 | 8 | 6.26 | 153 | 0.38 | 154 | 1.52 | 61 | 0.68 | 376 |
| 港南区 | 16 | 7.00 | 124 | 0.34 | 112 | 1.60 | 55 | 0.87 | 307 |
| 旭区 | 17 | 6.51 | 105 | 0.29 | 158 | 1.54 | 81 | 0.85 | 361 |
| 緑区 | 11 | 6.00 | 97 | 0.43 | 69 | 1.72 | 31 | 0.94 | 208 |
| 瀬谷区 | 5 | 6.77 | 23 | 0.33 | 84 | 1.65 | 26 | 0.89 | 138 |
| 栄区 | 8 | 7.75 | 41 | 0.39 | 68 | 1.46 | 40 | 0.70 | 157 |
| 泉区 | 9 | 7.01 | 40 | 0.44 | 91 | 1.62 | 55 | 0.90 | 195 |
| 青葉区 | 15 | 5.50 | 206 | 0.59 | 170 | 2.05 | 61 | 1.38 | 452 |
| 都筑区 | 4 | 5.90 | 130 | 0.72 | 60 | 2.23 | 28 | 1.45 | 222 |
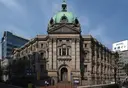
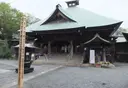
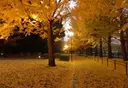
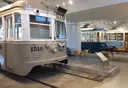


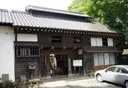
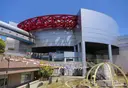
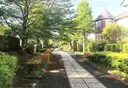
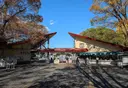
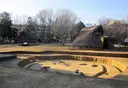
Area photographs from Wikimedia Commons (author and licence for each are given on that area’s own report page).
A dash means nothing of that type was on the market in that area that month. Figures are each area’s median (outliers dropped by the IQR rule), the same numbers the type pages publish. A metric is computed from as little as one record, but anything under 3 records is indicative only — the median of one or two listings is a fact about those listings rather than about the area — so those cells are excluded from the quartile shading and from the weighted figures on the cards above, though they are still shown. The cards weight areas with 3 records or more by record count; they are not the median for Yokohama as a whole, which is not a grain we keep.
Outside Yokohama: records by area
#The wards of Kawasaki and Sagamihara, plus the prefecture’s other municipalities.
Lower unit prices and higher yields are the cheap end. The darker band is the top 10%.
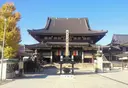
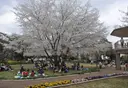
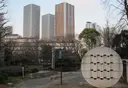
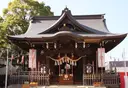

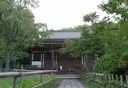

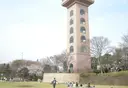
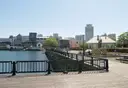
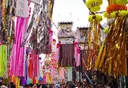
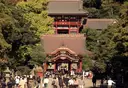



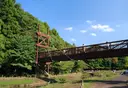
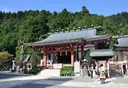
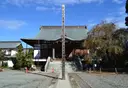
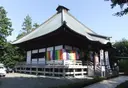
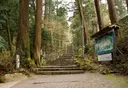
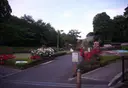
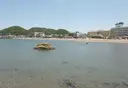
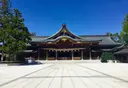
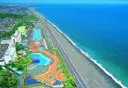
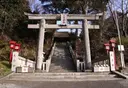
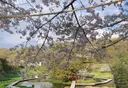
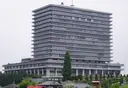



Area photographs from Wikimedia Commons (author and licence for each are given on that area’s own report page).
A dash means nothing of that type was on the market in that area that month. Figures are each area’s median (outliers dropped by the IQR rule), the same numbers the type pages publish. A metric is computed from as little as one record, but anything under 3 records is indicative only — the median of one or two listings is a fact about those listings rather than about the area — so those cells are excluded from the quartile shading and from the weighted figures on the cards above, though they are still shown. The cards weight areas with 3 records or more by record count; they are not the median for Outside Yokohama as a whole, which is not a grain we keep.
Latest articles
Urbalytics analysis built on price-revision history, closed sales and rental data.
- Market AnalysisRental property acquired within five years: What proposed inheritance valuations mean for Tokyo owners
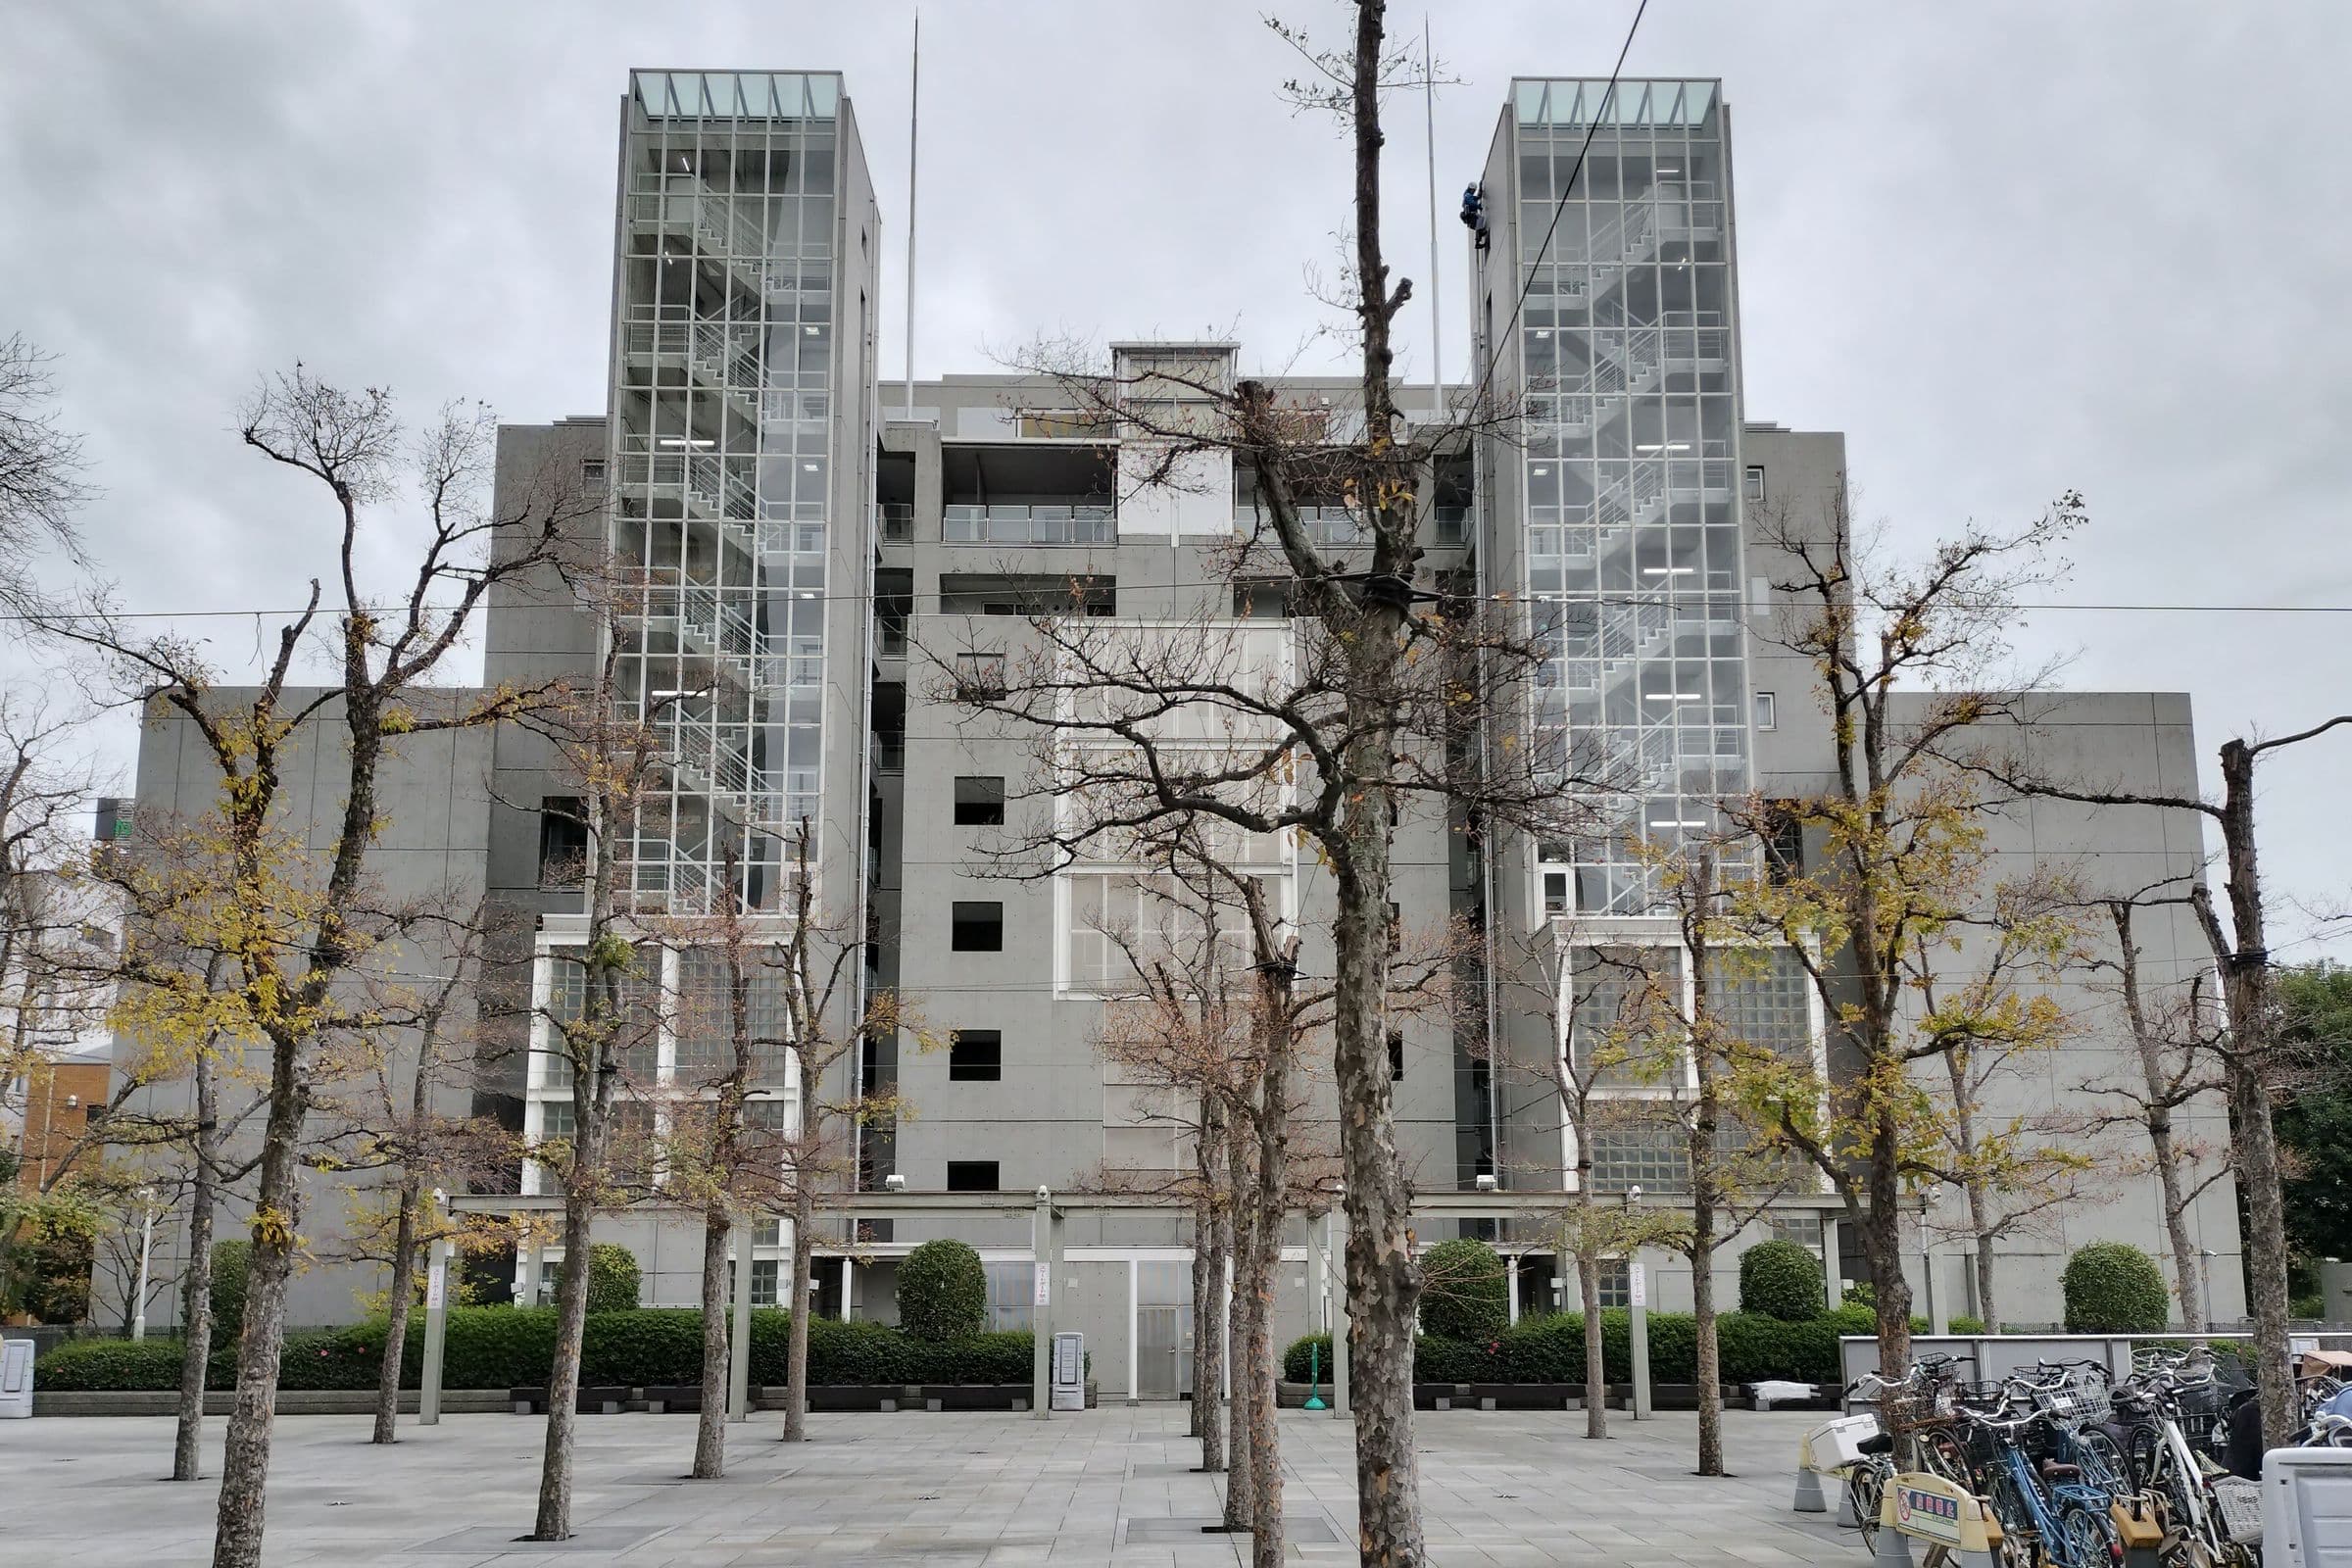
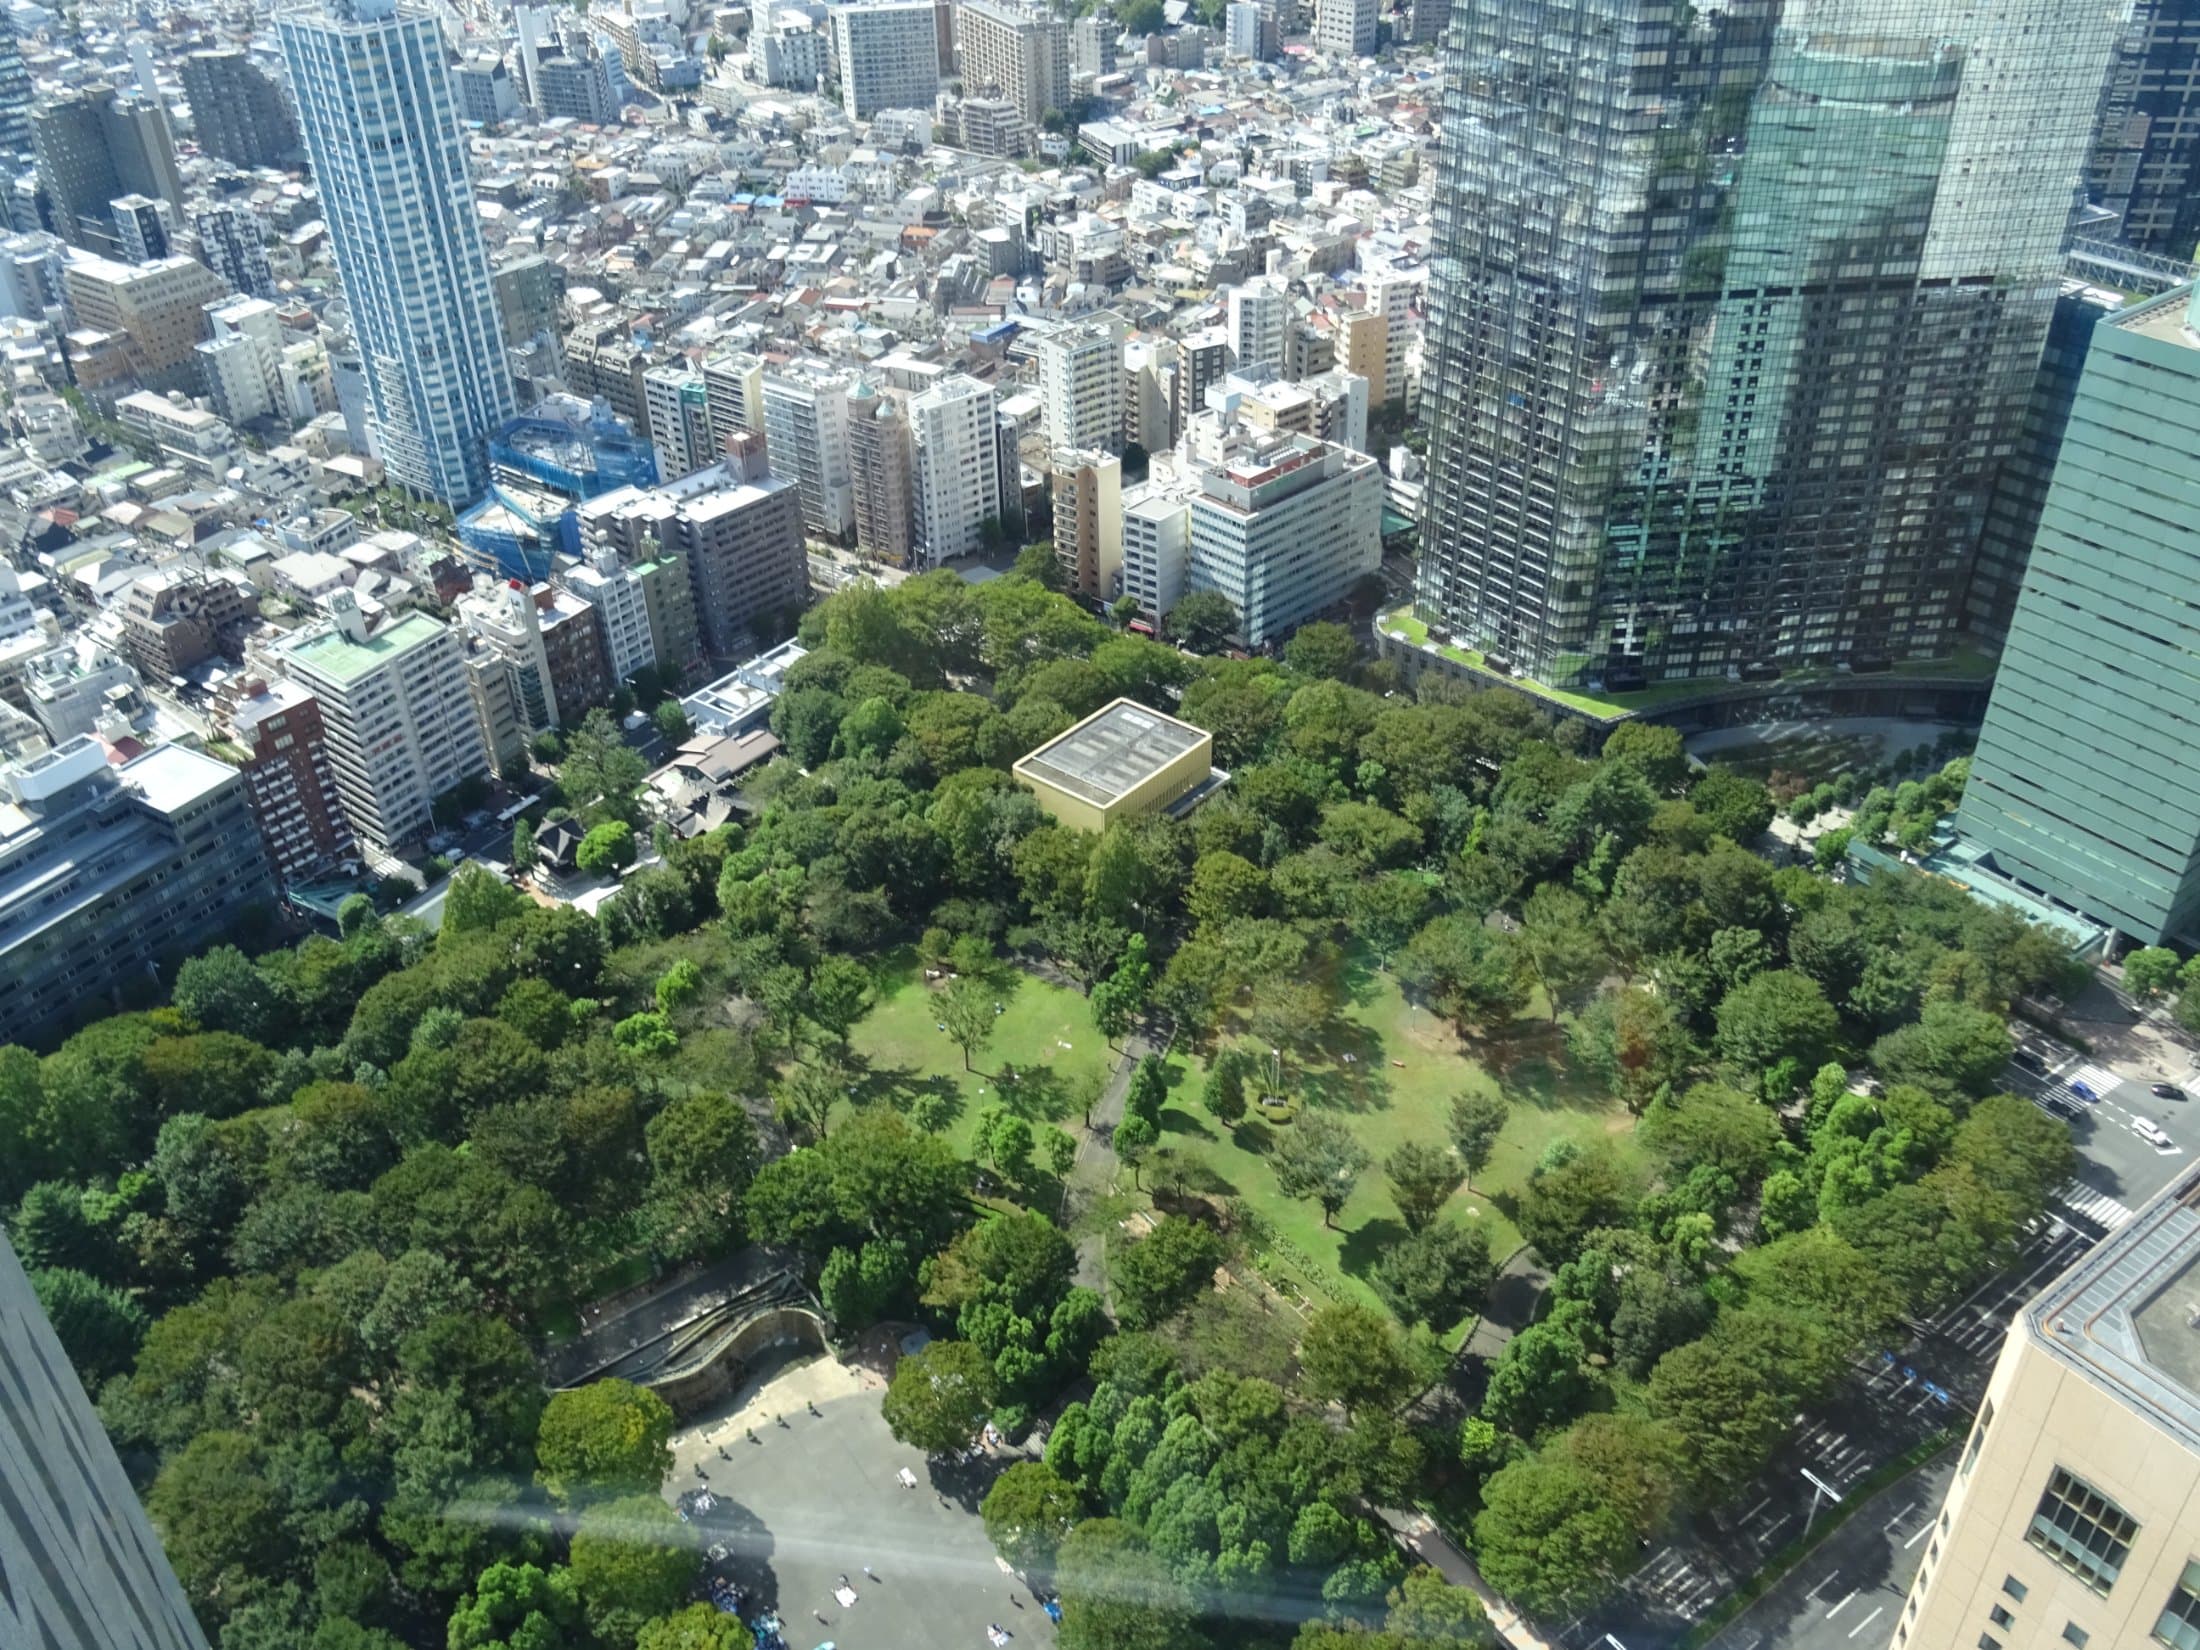
- Area & Property SpotlightShinjuku Central Park’s planned 39-story tower: What it means for nearby rental valuations
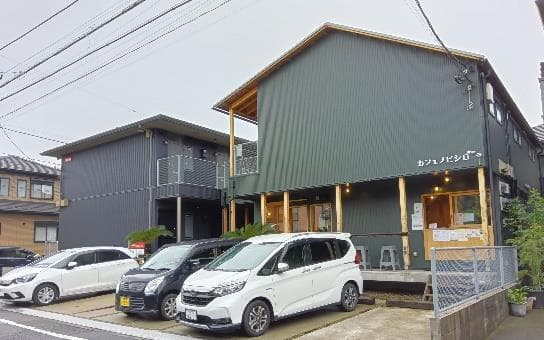
- Area & Property SpotlightFujisawa’s intergenerational housing: Who pays for discounted rents and community support?
- Price WatchTokyo Condo Market Watch (2026.10 #3) | More Price Cuts in Towers, Newer and Larger Units
- Market AnalysisTokyo investment condos average ¥41.49 million: Should whole-building prices follow?
- Area & Property SpotlightTeikyo University in Hachioji: Assessing Student Rentals Around Otsuka
Find properties in Kanagawa
Individual listings, price-change history, closed transactions and AI valuations are available on a free account.