Words: 1365 | Estimated Reading Time: 7 minutes | Views: 23
In Q3, gains concentrated in individually sold condo units; acquisition budgets for whole-building assets need to be calculated separately.
On October 19, Kenbiya released its July–September 2026 income-property report: the average asking price for investment condo units in Tokyo’s 23 wards reached ¥41.49 million, up 13.30% QoQ. If you’re evaluating a rental building, this surge can easily become a negotiating reference—since ‘Tokyo is up again,’ is your original budget already behind?
The same report provided another set of figures: in Tokyo’s 23 wards, the average for 一棟アパート (whole-building low-rise apartments) fell 0.38% QoQ, while 一棟マンション (whole-building condominium buildings) rose 0.57% QoQ. Quarterly averages for both whole-building categories were roughly flat. Applying the condo-unit increase directly to whole-building pricing crosses asset classes.
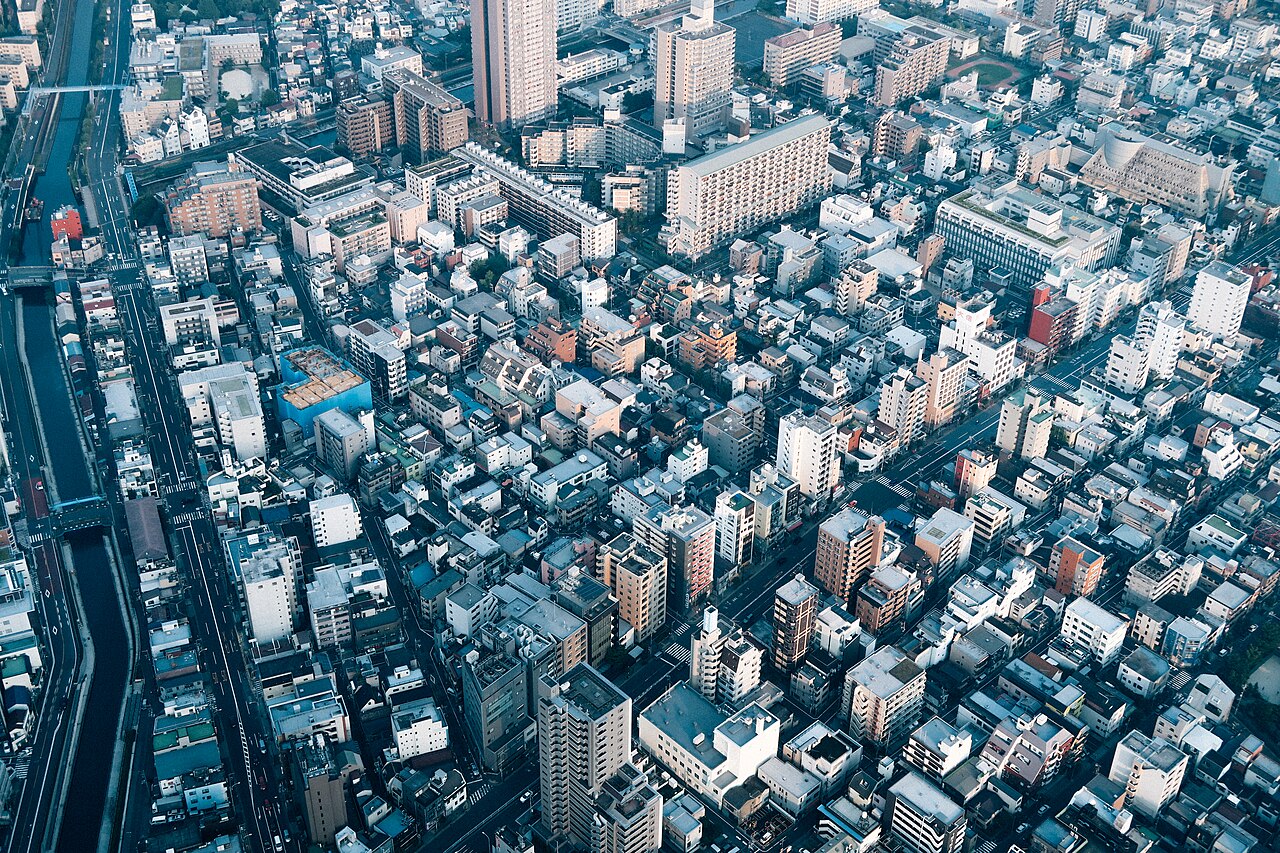
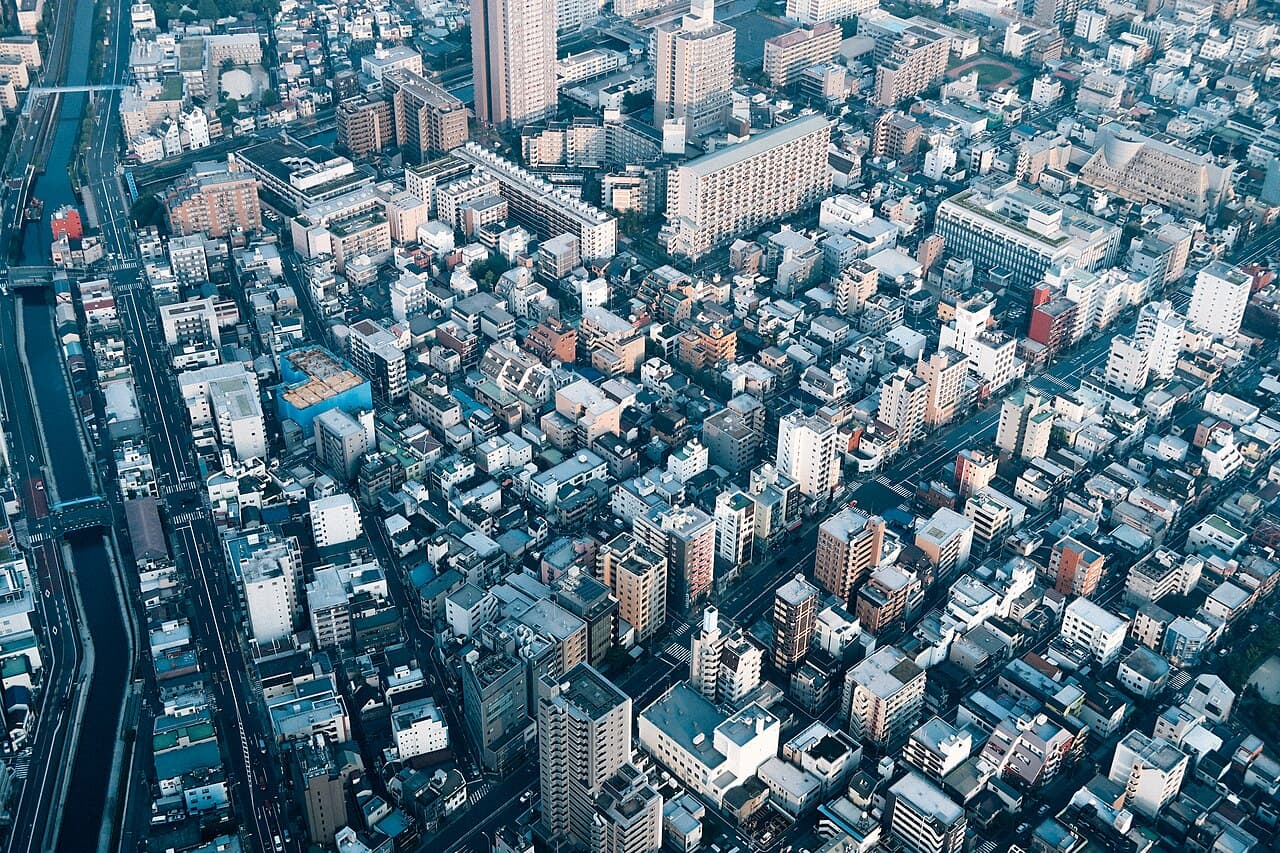
Reference photo of a Tokyo residential district; not part of this dataset. Fábio Hanashiro / Wikimedia Commons, CC0; page indicates 2016 publication.
Within Tokyo, the three listing categories traced different paths
The goal here is to judge whether ‘Tokyo price increases’ can justify a blanket markup across all income-property types. Kenbiya’s 区分マンション refers to individually sold condominium units; 一棟アパート and 一棟マンション are two whole-building residential categories the platform reports separately. Colloquially they may all be called ‘apartments’, but the asset, budget, and management responsibilities differ—keep the classifications when reading the report.
Tokyo 23 wards, Q3 2026: Condo units averaged ¥41.49 million, +13.30% QoQ; 一棟アパート averaged ¥140.62 million, −0.38% QoQ; 一棟マンション averaged ¥302.99 million, +0.57% QoQ. These totals are means of different baskets; you cannot judge which is ‘cheaper’ by comparing nominal totals.
Expanding to Greater Tokyo (Tokyo plus three neighboring prefectures), the pattern is similar: condo units averaged ¥33.50 million, up 10.56% QoQ; the two whole-building categories averaged ¥102.32 million and ¥241.21 million, up only 0.65% and 0.43%. The divergence is therefore not confined to the 23 wards.
The report aggregates residential income properties registered during the quarter; it does not provide a repeat-sales index tracking the same assets. Shifts in the share of expensive, larger, or newer listings also move the mean. This release supports the view that ‘the listing market is diverging by category,’ but it does not mean every like-for-like condo unit appreciated by 13.30%.
For whole-building buyers, the implication is concrete: if a seller raises the price of a whole building citing record highs in condo units, you should add comparables at the same station area, asset type, similar age, and scale. This quarterly report does not supply the basis for that premium.
Inquiry prices average only 75.7% of list—but that is not a 24.3% automatic discount
The report also compares average prices of ‘registered listings’ with those of ‘inquired listings.’ In Tokyo’s 23 wards, the inquiry-to-list ratio is 75.7% for condo units; 71.0% for 一棟アパート; and 95.8% for 一棟マンション.
Here, an ‘inquiry’ means a user asked an agent about a specific listing; it is not a buyer’s offer or a closing price. The two groups may comprise different listings as well: if people concentrate inquiries on cheaper properties, that alone pulls down the inquiry-group average without any actual price cuts at closing.
These ratios are useful for showing where buyer attention clusters by price band; they should not be turned into a uniform haircut. In particular, 95.8% should not be read as whole-building 一棟マンション typically conceding only 4.2%; the metric does not track negotiations for the same building from list to close.
For list-price adjustments, see Tokyo condo price-cut distribution. It counts how many listings revised prices—answering a different question than today’s quarterly listing averages. On the gap between listings and transactions, see Divergence between listing and closing prices for Tokyo existing condos.
Zooming in on Kamata: verify unit rents and whole-building yields separately
Macro reports still cannot tell a buyer how much rent a given building will collect each month. To ground comparisons in specific filters, we selected the Kamata Station area within Tokyo’s 23 wards and separately queried units for lease and whole buildings for sale. This is a localized valuation example, not a statement about all of Tokyo.
First, ‘Where does the monthly rent budget for small units sit?’: within a 15-minute walk of Kamata Station, 20–40 m² residential apartments. Among 779 valid active rental records, the median base monthly rent is ¥118,000, with the 25th and 75th percentiles at ¥98,000 and ¥137,000. Management fees are excluded.
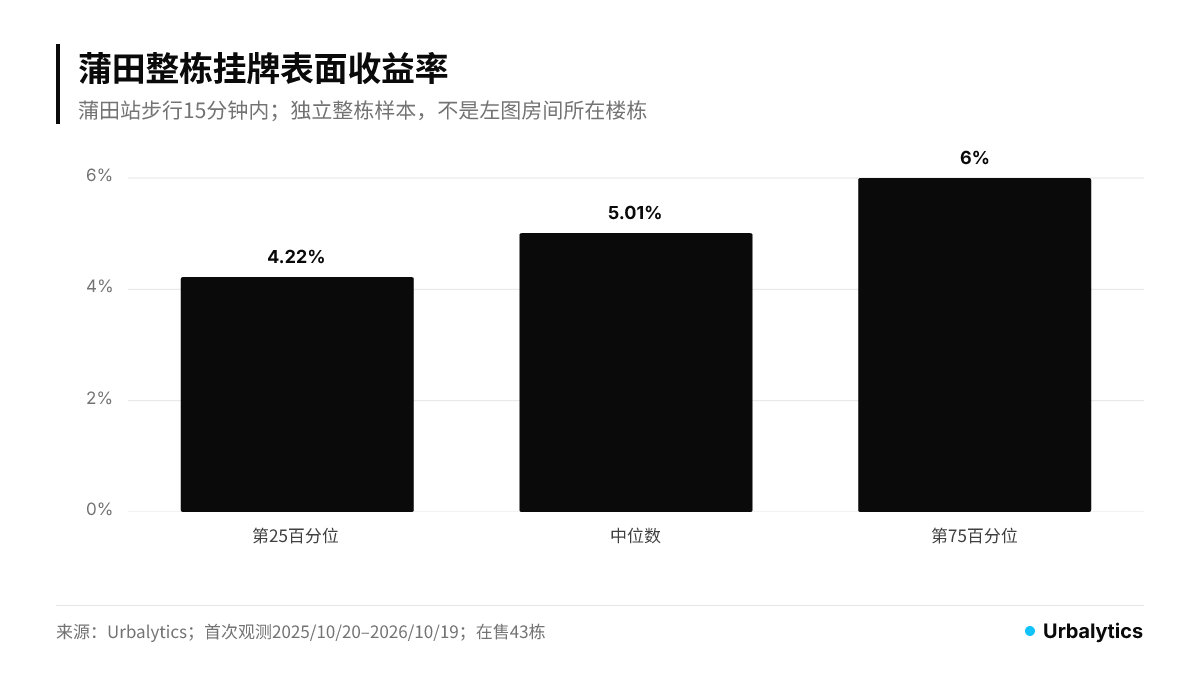
Second, ‘What range do advertised gross yields for nearby whole-building listings fall into?’: across 43 valid for-sale samples in the same station area, the median is 5.01%, with the 25th and 75th percentiles at 4.22% and 6.00%. This whole-building group mixes different structures and scales and is not identical to any single Kenbiya subcategory.
Dual-panel charts: A shows unit base monthly rent; B shows whole-building gross yield. The two panels depict the middle distributions of their respective samples; they are not rent–sale pairs for the same buildings.
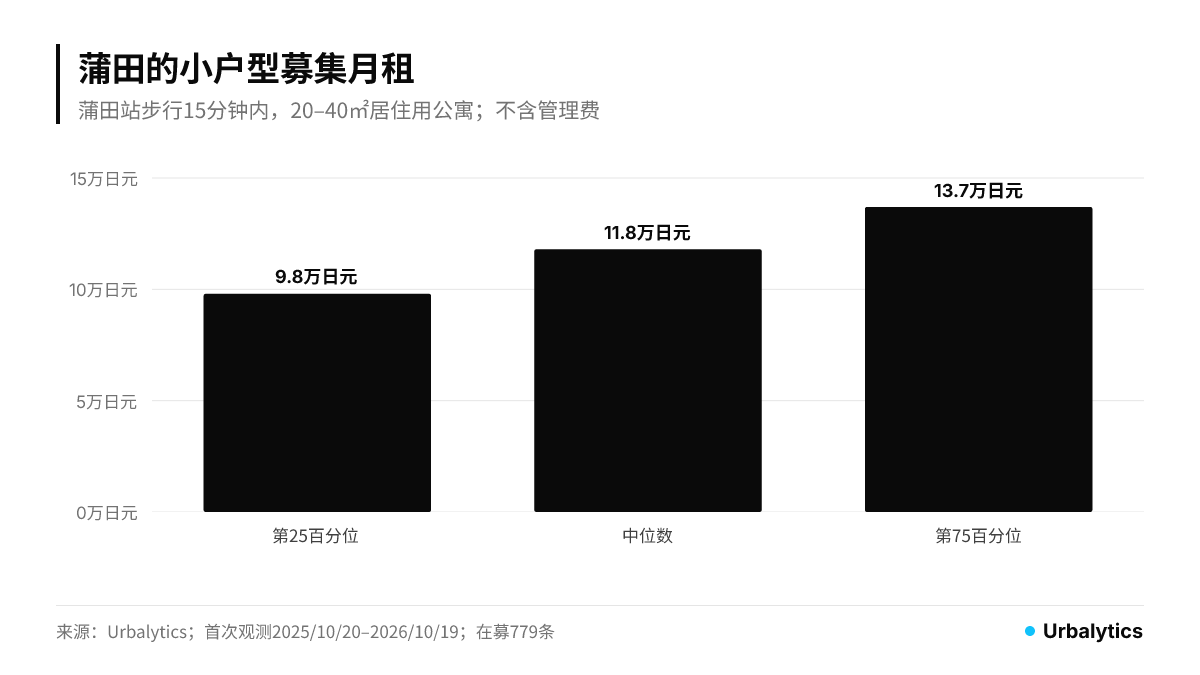
When inspecting properties, use the rent distribution to flag units on the rent roll that are clearly off-market, then match each by floor area, building age, floor, and amenities. If a seller assumes all vacancies will be ‘filled’ at ¥137,000, that applies a uniform upper-quartile rent; each unit should be justified.
The yield distribution is for selecting whole-building comparables. If a listing shows 6%, it only indicates proximity to the upper quartile of this sample; it is not automatically ‘cheap.’ Whether rent is calculated at full occupancy and whether recent repairs have been prepaid will change post-acquisition cash flow.
Do not multiply ¥118,000 by an assumed unit count and divide by 5.01% to get a supposed ‘Kamata standard building price.’ The two samples are not matched one-for-one; that would synthesize a building that does not exist.
Before adding a price-hike rationale to your budget, reconcile income and expenses
For this report, when buying whole buildings you can keep your original budget and list any seller-requested increase separately. Then reconcile three items: actual income from current leases, achievable asking rents for vacant units, and prices and yields of comparable whole-building listings. Condo-unit price gains do not enter the income schedule.
If the rent roll assumes full occupancy, deduct explainable vacancy and delinquencies, then add management, taxes, insurance, and repairs, and finally include principal and interest for this financing. The denominator of gross yield is typically just the property’s asking price; acquisition costs should be itemized separately. That is the pro forma for cash available after purchase.
Tokyo 23-ward condo units breaching ¥40 million is a noteworthy new data point today; for a Kamata rental building, how much more you are willing to pay should still rest on verifiable income, expenses, and comparable sales. If additional budget is justified only by that cross-category 13.30% increase, this quarterly report is insufficient to support a markup.
Data and sources
Kenbiya data: published October 19, 2026; covers new residential income-property listings registered from July 1 to September 30, 2026; prices and gross yields are sample averages, not closing prices. This article cites Kenbiya (Real Estate Investment and Income Property Information Site) and the LIFULL official release; they report the same survey and should not be treated as two independent statistical sources.
Urbalytics data: queried October 19, 2026; first-seen window set to October 20, 2025–October 19, 2026, using current record values; this is a cross-section of observed listings, not one year of closed deals or rent growth. All limited to Tokyo, Kamata Station area, within a 15-minute walk; rentals limited to residential apartments of 20–40 m², active, base rent. Of 795 scanned records, 16 excluded, leaving 779 valid; of 46 whole-building scanned records, 3 removed as duplicates, leaving 43 valid; no truncation and no outlier removal. Whole-building gross yield equals listed annual income divided by asking price; actual rent rolls and full-occupancy assumptions were not verified per building. Quantiles rounded to display precision.
For broader monthly data, see the Tokyo Public Market Report, whose monthly scope differs from the station-area filters used here.
Images: Fábio Hanashiro, Tokyo residential district, CC0; charts produced by Urbalytics based on this query.
Author: Chen
Tags: Tokyo investment property prices, Tokyo 23 wards, income property, condo units (区分マンション), 一棟アパート, 一棟マンション, Kamata, asking rents, gross yield, listing prices, Kenbiya, quarterly market report
Copyright: This article is original content by the author. Please do not reproduce, copy, or quote without permission. For usage requests, please contact the author or this site.