
Market Reports
Listings Urbalytics collects across Tokyo, Kanagawa, Chiba and Saitama, aggregated monthly at three grains: municipality, station and postal code. Alongside them, reports grouped by condominium brand rather than by place. These are derived statistics, not individual transaction records.
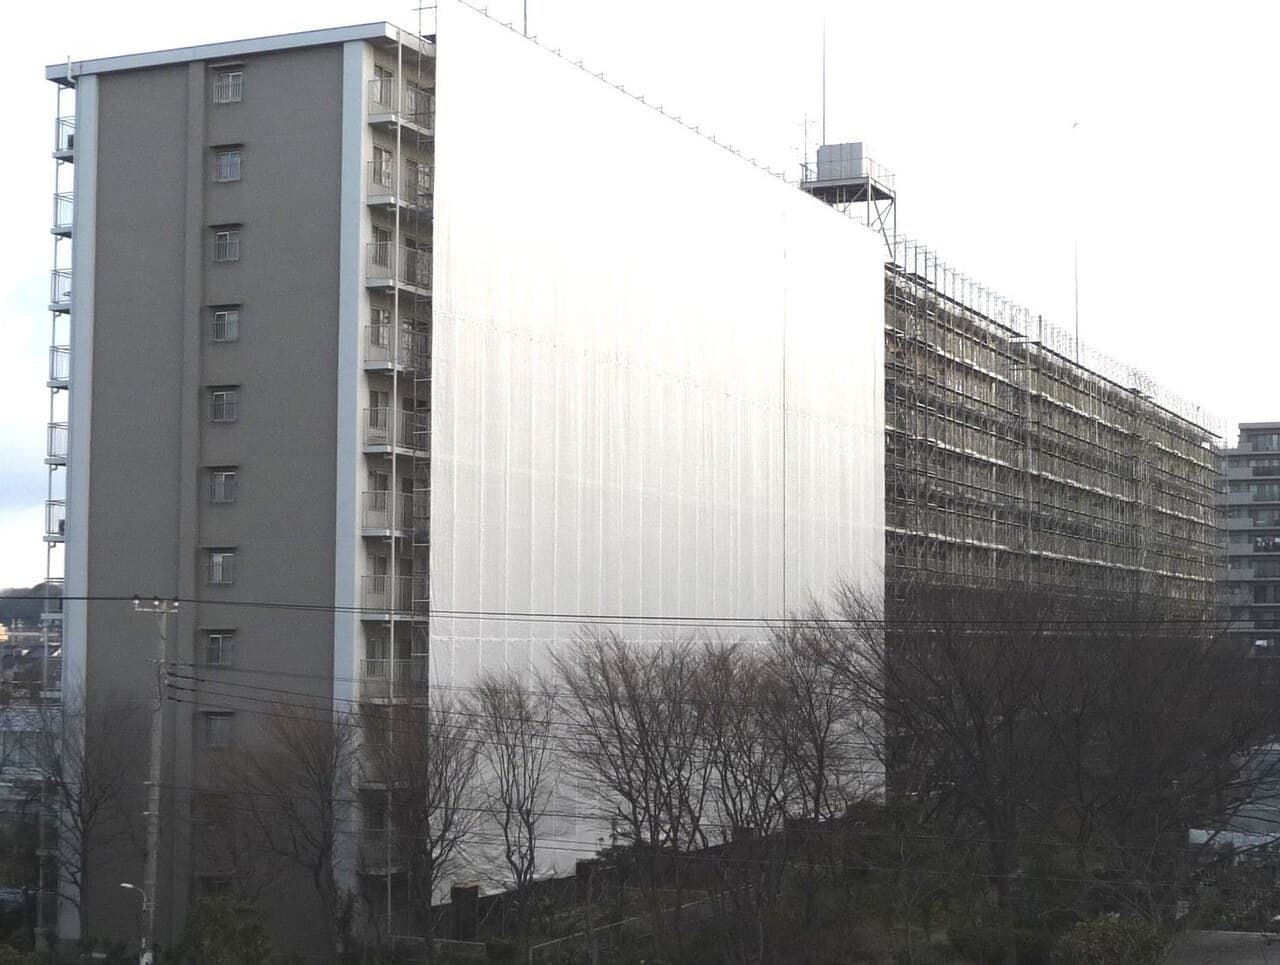
By brand (condominium)
#The same listings, grouped by a developer's brand series rather than by place. Compare price per tsubo, floor area, building age and walking distance across 13 developers and 39 brands.


By area (municipality)
#244 municipalities across Tokyo, Kanagawa, Chiba and Saitama. 227 of them clear the publication threshold (10+ records in at least three months) and carry a monthly report per property type.
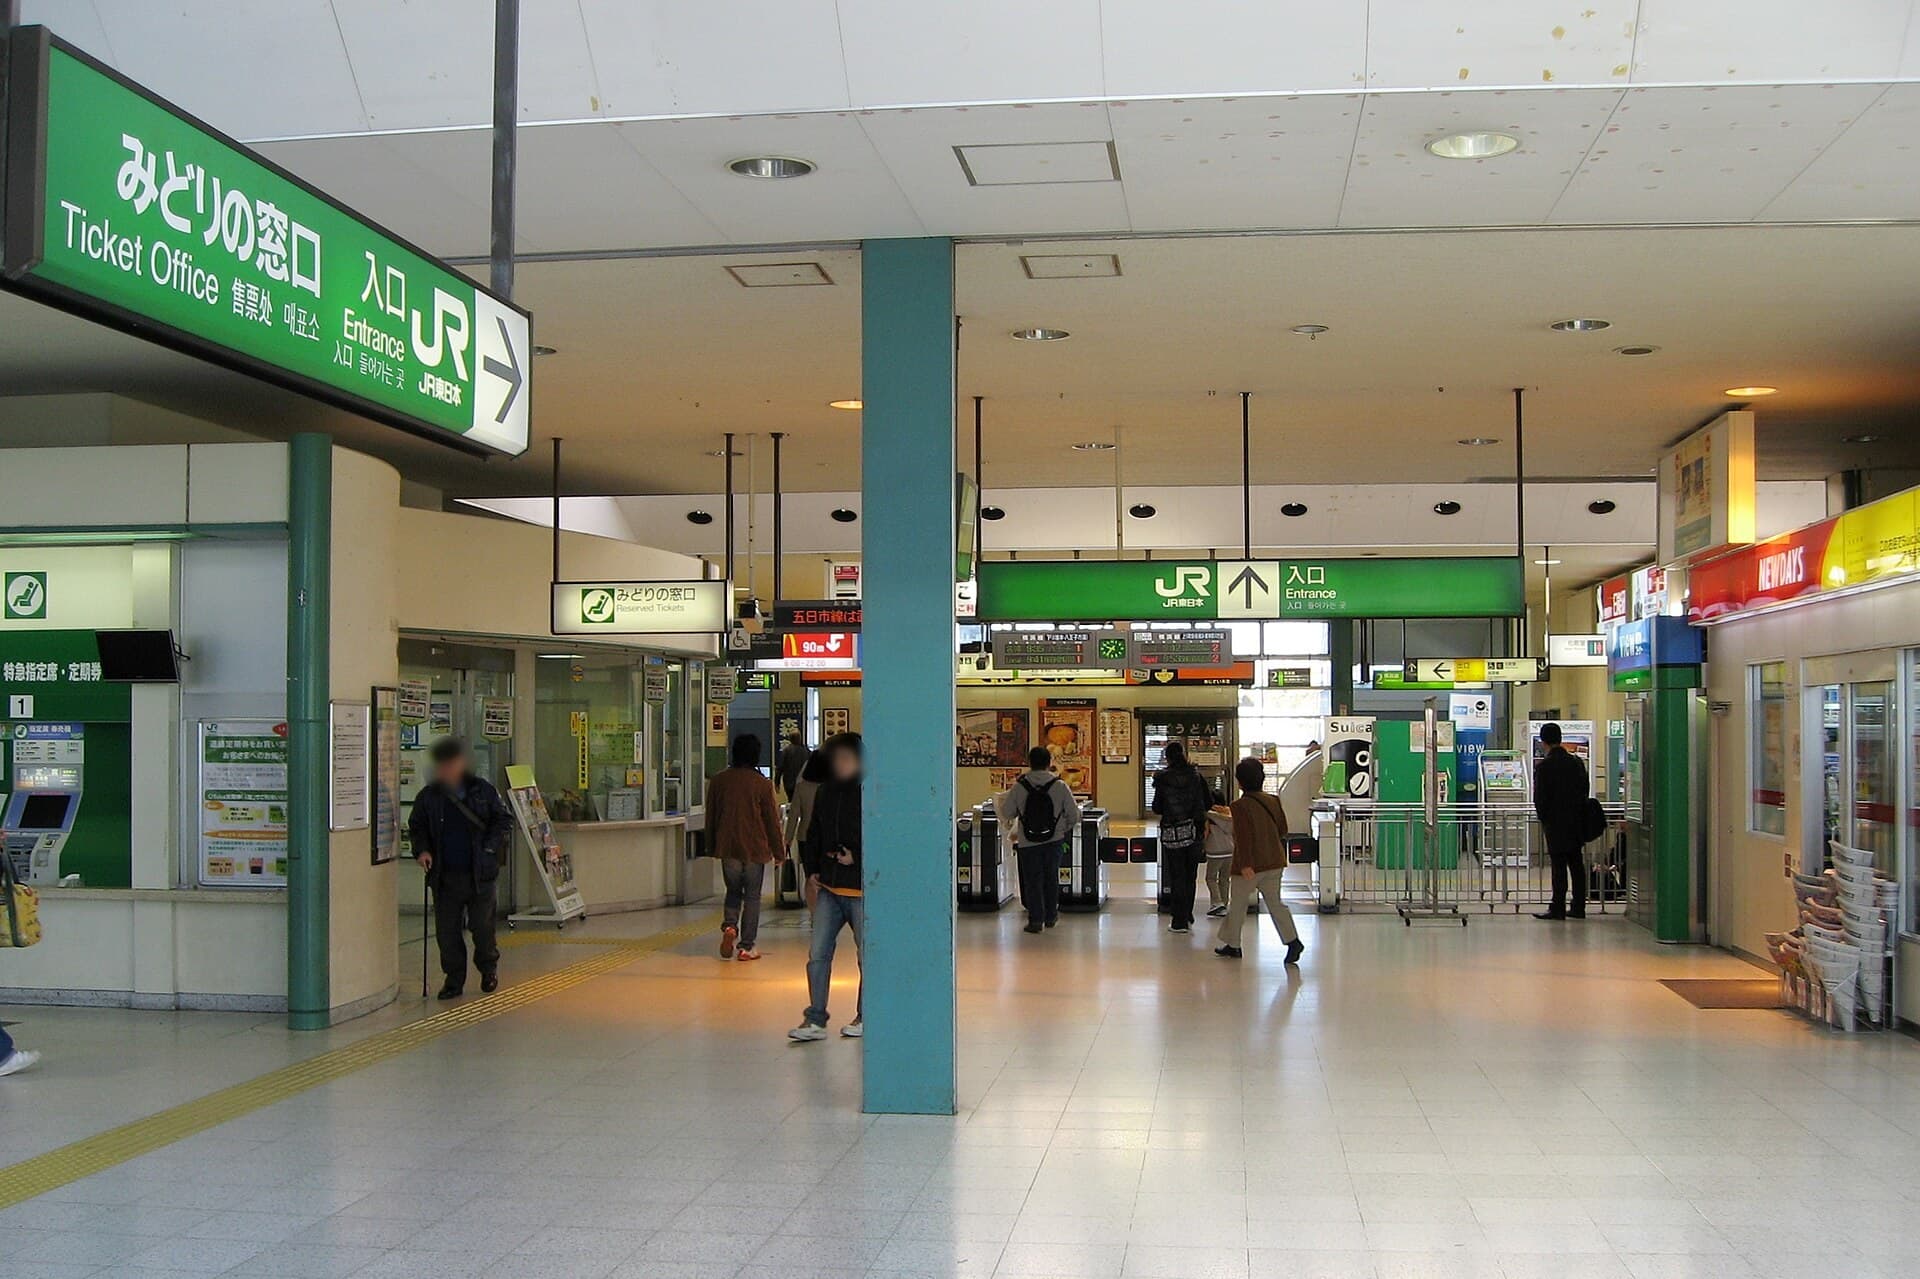
By station
#Aggregated by walking distance from the nearest station. 1,416 stations carry data, of which 2,147 station × property-type pairs clear the threshold. This is the grain for comparing prices along a line. Latest month: September 2026.


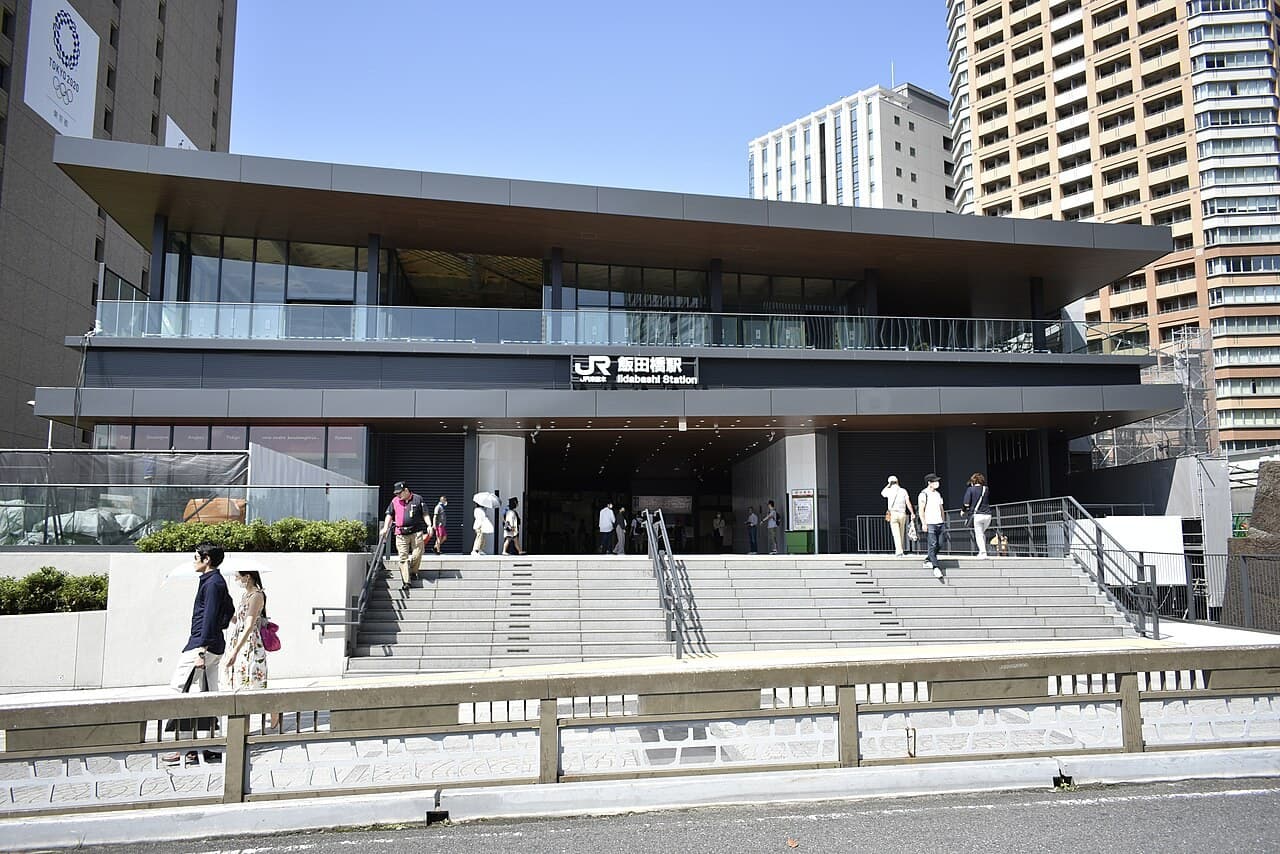
By postal code
#Aggregated by 7-digit postal code. Search by code or address to see that code's asking prices and rents. A code carries only 8.5 records on average, so months with fewer than 10 records show the count alone.
Price WatchGreater Tokyo · Price cuts, August 2026
Open Price WatchArea, station and postal code are the same listings aggregated over three different geographies; the brand axis is the same listings aggregated by brand rather than by place. One property is therefore counted in several reports, so do not add the record counts together. Each axis can also be at a different month.
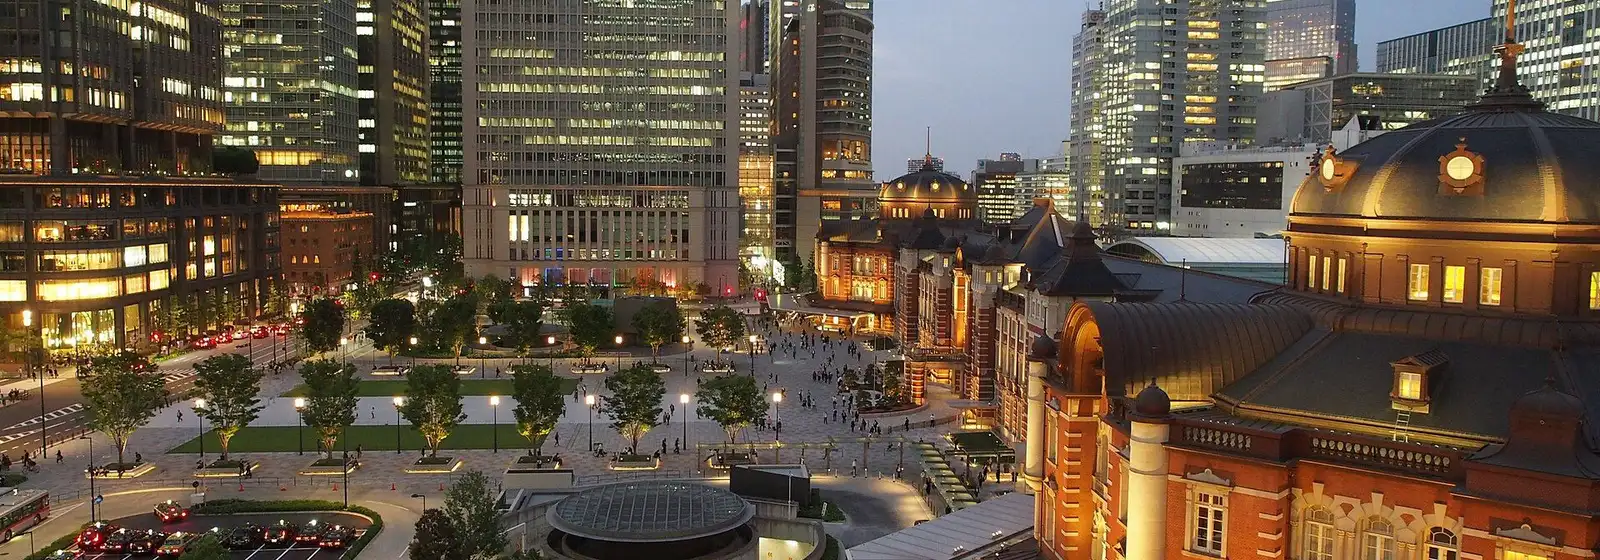
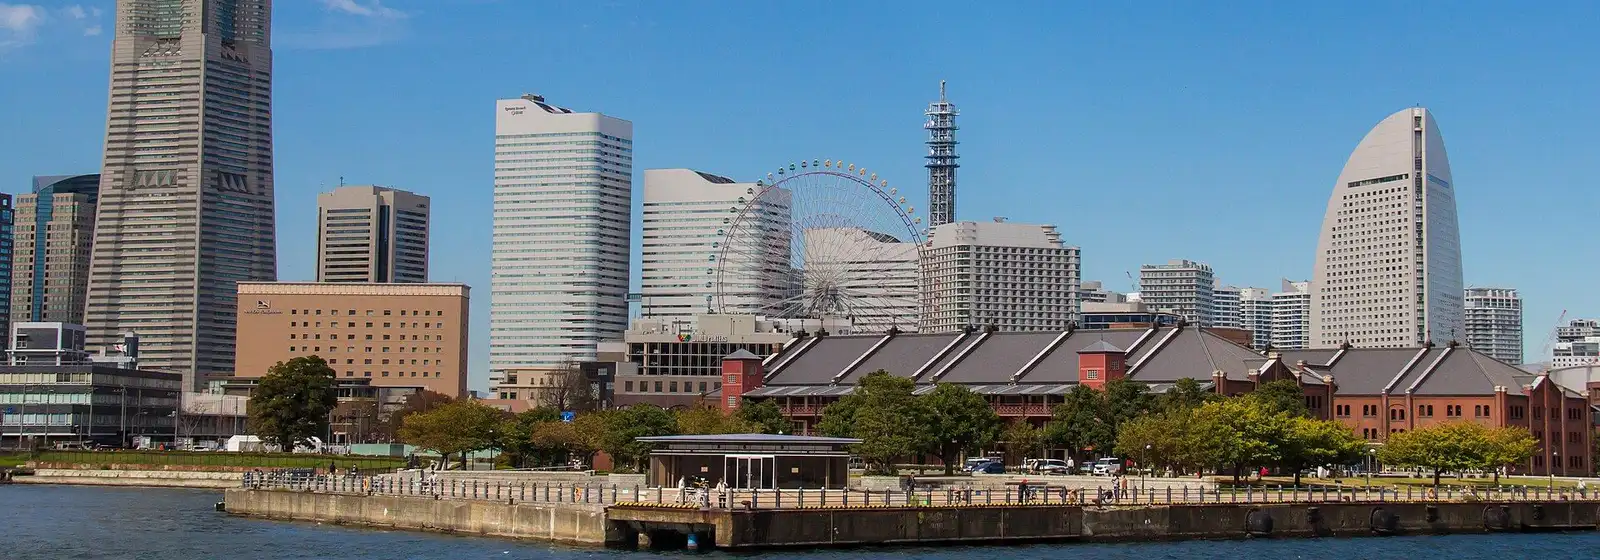
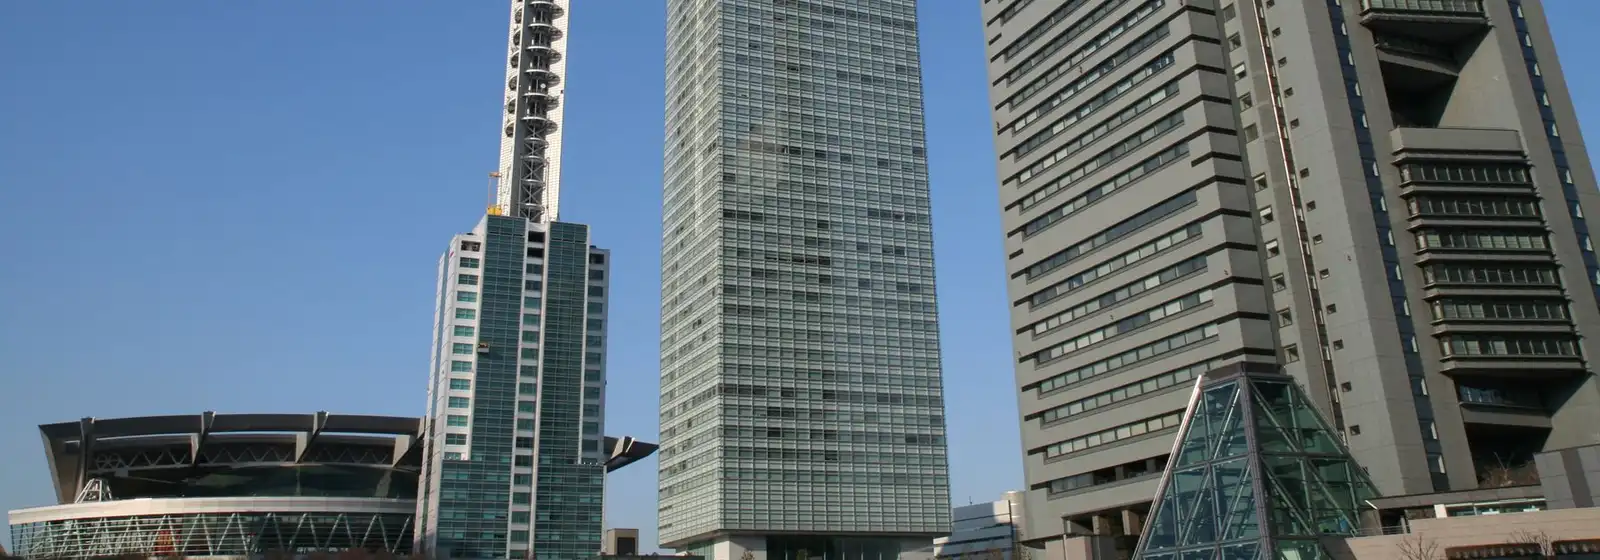
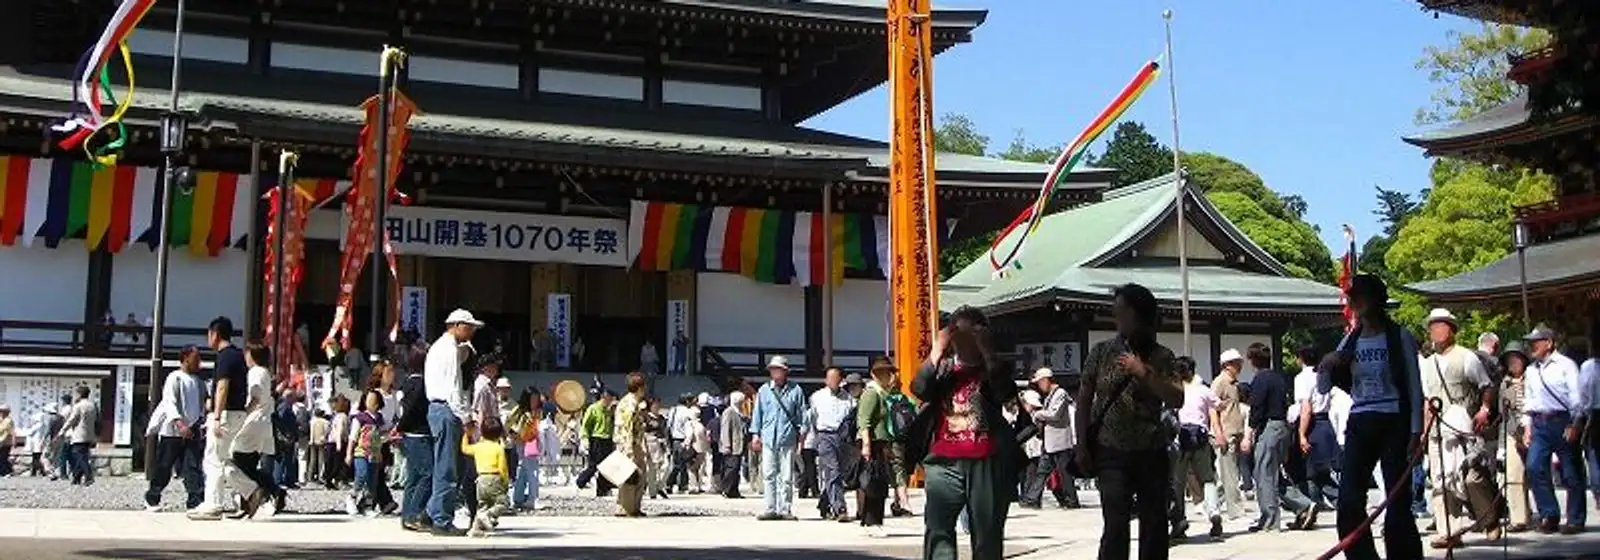
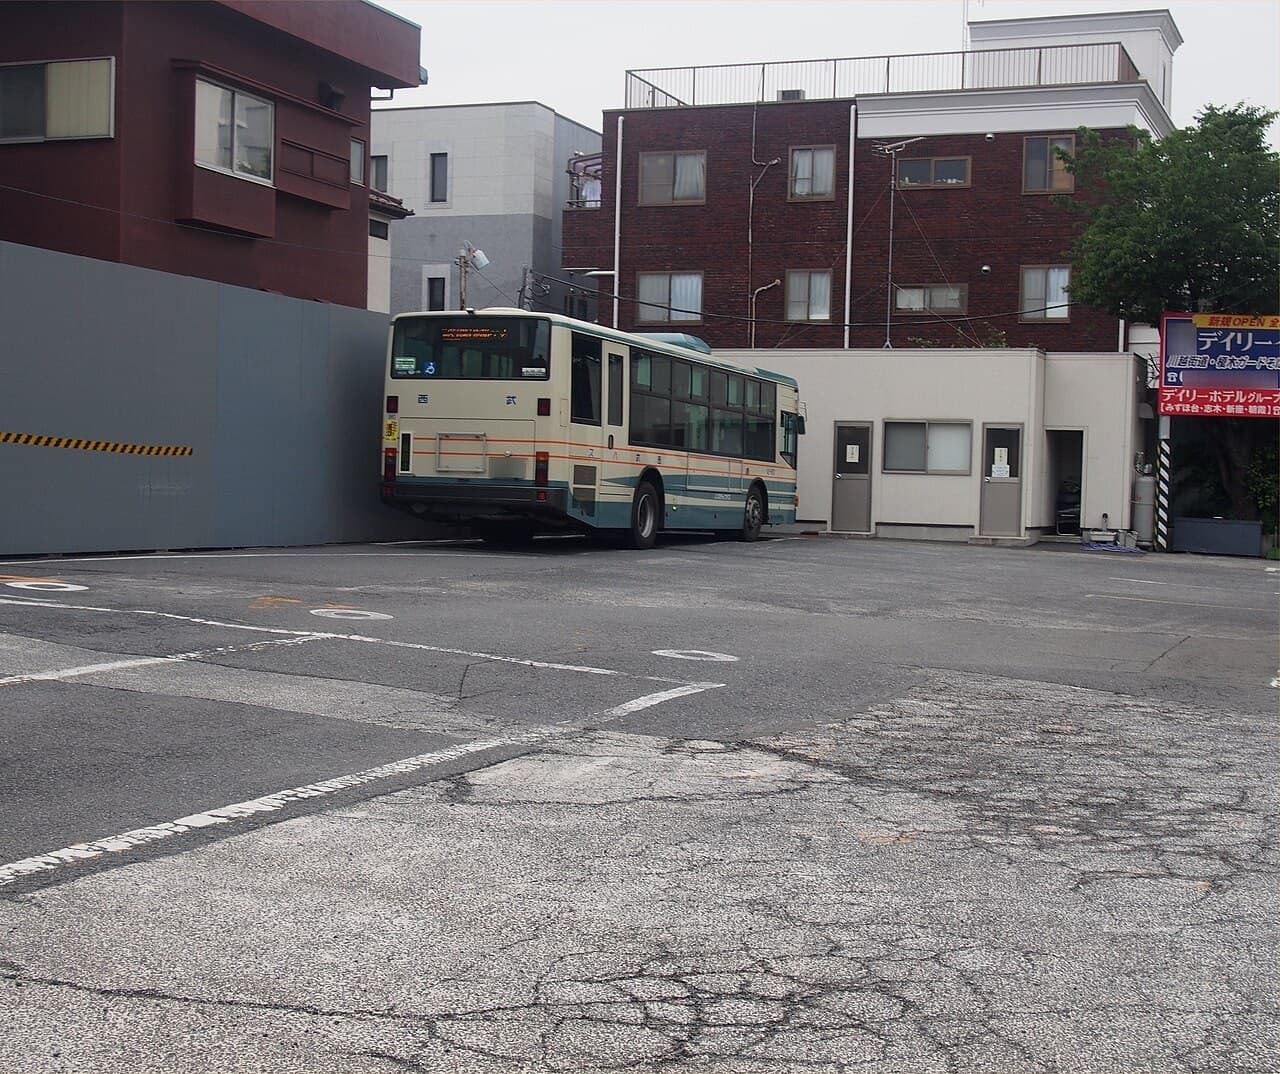
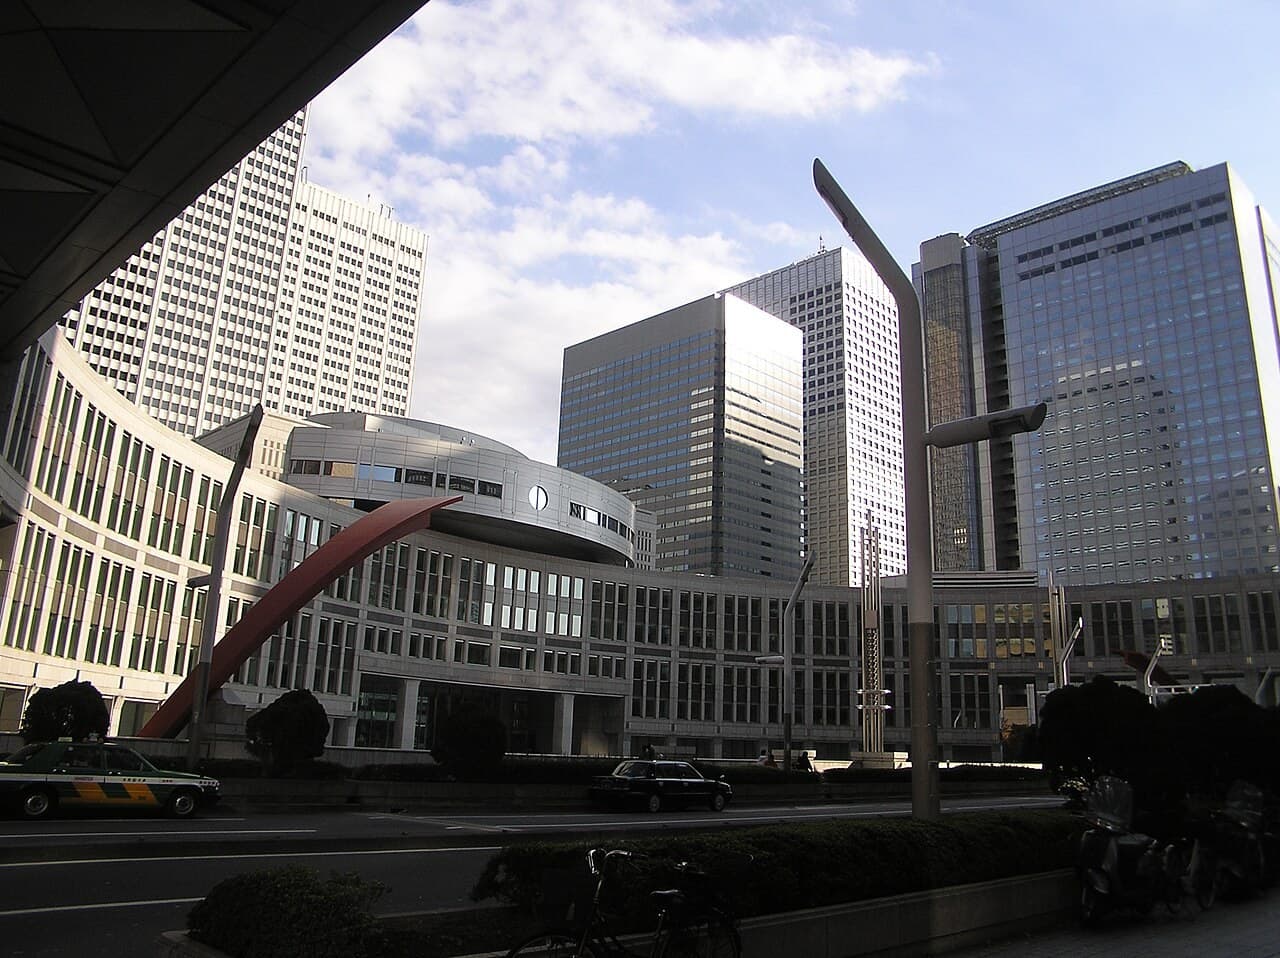
Area, Station, Developer photographs from Wikimedia Commons, cropped for this page (author and licence are given on each report page).
Latest articles
Urbalytics analysis built on price-revision history, closed sales and rental data.
- Market AnalysisA Railway Split the City in Two: 15 Hectares Returned at Sagamihara Station’s North Exit Push the ¥117.4 Billion Elevation Question to the Fore
- Market Analysis15 hectares lie vacant at the station front, yet prices are 30% below the Kanagawa average: Sagamihara Station North Exit is bottlenecked by a costly rail elevation
- Market AnalysisWhen the Crocodile’s Mouth Opens: Tokyo resale condo asks keep climbing while closings stall
- Market AnalysisThe “Invisible Housing Cost” of ¥32,000 per Month: Greater Tokyo resale condos are starting to stratify by “can you afford to hold?”
- Market AnalysisWill the Oedo Line Reach Saitama? Central Niiza’s ‘Railway White Space’ and a New Station Still on Paper
- Market AnalysisTokyo Metropolitan Government finally takes a stance on “flipping”: After Harumi Flag, how much of the short-term resale window remains
Find properties in Tokyo metropolitan area
Individual listings, price-change history, closed transactions and AI valuations are available on a free account.