Words: 1730 | Estimated Reading Time: 9 minutes | Views: 195
Kenbiya’s October data show the average asking price for apartment buildings in Tokyo’s 23 wards rising to JPY 322,980,000, the highest in a year. Yet multiplying price by gross yield suggests annual rental income per building also rose by roughly fourteen percent over the same period, leaving a much smaller increase attributable to higher valuations.
October Data: Condo Prices Fall as Apartment Buildings Hit a High
On November 14, Kenbiya published its Monthly Investment Property Market Report for October 2026, covering residential investment properties newly listed on its site that month. Individual condominium units and entire apartment buildings moved in opposite directions. In Tokyo’s 23 wards, the average asking price for condominium units was JPY 41,240,000, down 2.83% month on month for a second consecutive monthly decline. Apartment buildings, by contrast, rose 9.17% month on month and 19.82% year on year to their highest average in a year.
Across Tokyo, Kanagawa, Saitama and Chiba, the average asking price for apartment buildings was JPY 247,750,000, up 14.25% year on year. The broader capital region averaged JPY 243,190,000, also a one-year high. Nationwide, the average gross yield on apartment buildings reached 7.54%, another one-year high, though this was mainly driven by high-yield properties in regional markets. In Tokyo’s 23 wards, the average gross yield was 5.01%, down 0.24 percentage points from a year earlier.
Averages for properties listed on Kenbiya (October 2025 → October 2026):
Apartment building asking prices, Tokyo’s 23 wards: JPY 269,550,000 in October 2025 → JPY 322,980,000 in October 2026 (+19.82% year on year)
Apartment building gross yields, Tokyo’s 23 wards: 5.25% → 5.01% (-0.24 percentage points)
Apartment building asking prices, Tokyo, Kanagawa, Saitama and Chiba: JPY 216,840,000 → JPY 247,750,000 (+14.25% year on year)
Apartment building gross yields, Tokyo, Kanagawa, Saitama and Chiba: 6.37% → 6.21% (-0.16 percentage points)
Individual condominium asking prices, Tokyo’s 23 wards: JPY 33,940,000 → JPY 41,240,000 (+21.51% year on year)
Individual condominium gross yields, Tokyo’s 23 wards: 5.20% → 5.13% (-0.07 percentage points)
Source: Kenbiya, Monthly Investment Property Market Report, detailed report for October 2026.

How Much of the Price Increase Reflects Larger Buildings?
The average asking price is a simple average of properties listed that month, so the mix of buildings directly affects the result. In Tokyo’s 23 wards, average apartment building asking prices fell 6.51% month on month in June, rose 7.36% in July, and rose another 9.17% in October. Market-wide valuations do not swing back and forth like this over a few months. A more reasonable explanation is that the size and location of buildings listed vary considerably from month to month.
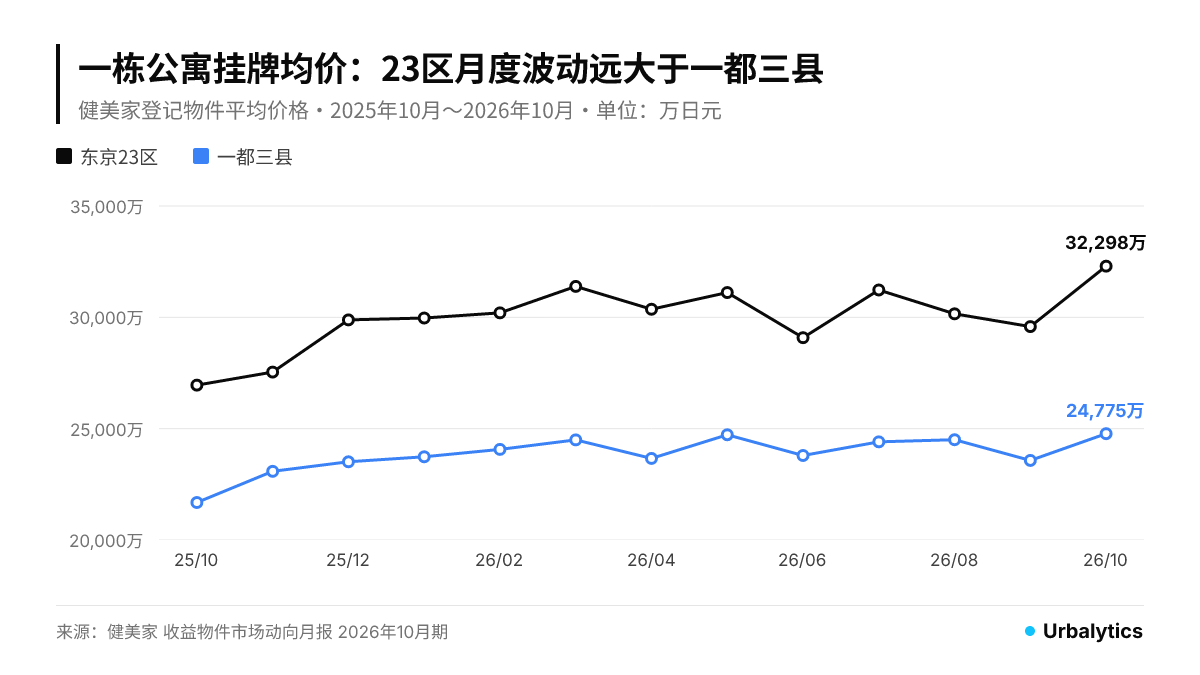
Multiplying the average price by the average gross yield gives a rough estimate of annual rental income per building. In Tokyo’s 23 wards, this rose from approximately JPY 14,150,000 a year earlier to JPY 16,180,000, an increase of about 14%, against an average asking price increase of roughly 20%. Most of the price increase therefore corresponds to buildings with higher rental income, typically larger or newer buildings. The increase in price relative to rent is reflected in gross yields falling from 5.25% to 5.01%, equivalent to paying approximately 5% more for the same rental income.
The pattern is even clearer across Tokyo, Kanagawa, Saitama and Chiba. Estimated annual rental income rose from around JPY 13,810,000 to JPY 15,390,000, approximately 11%, while average asking prices rose 14.25%, leaving a valuation increase of only about 3%. This is only a rough calculation: Kenbiya publishes separate averages for prices and yields, and multiplying them does not produce the average rent calculated building by building. Still, it is enough to show why “average prices at a new high” does not mean “the same building costs twenty percent more.”
Urbalytics Data: Modest Growth in Prices per Unit of Floor Area, Little Change in Median Yields
A separate dataset provides a cross-check. Urbalytics Tokyo Area Market Reports calculate ward-level medians for entire investment buildings listed for sale. Across Tokyo Metropolis, the median gross yield for these buildings in November 2025 was 5.15% (1,919 listings), compared with a October 2026 median of 5.11% (2,398 listings), virtually unchanged over the year. Over the same period, asking prices per tsubo of building floor area in Tokyo’s 23 wards, calculated by weighting ward medians by listing count, rose from JPY 2,969,000 to JPY 3,194,000 per tsubo, an increase of approximately 7.6%. A tsubo is a Japanese unit of floor area.
Urbalytics Data Insights
Taken together, the datasets show prices per tsubo rising by less than ten percent and median gross yields remaining broadly flat, while average prices per building rose by nearly twenty percent. The gap mainly reflects larger, newer buildings coming onto the market. Comparisons should focus on prices per tsubo and rental income, rather than average prices per building.
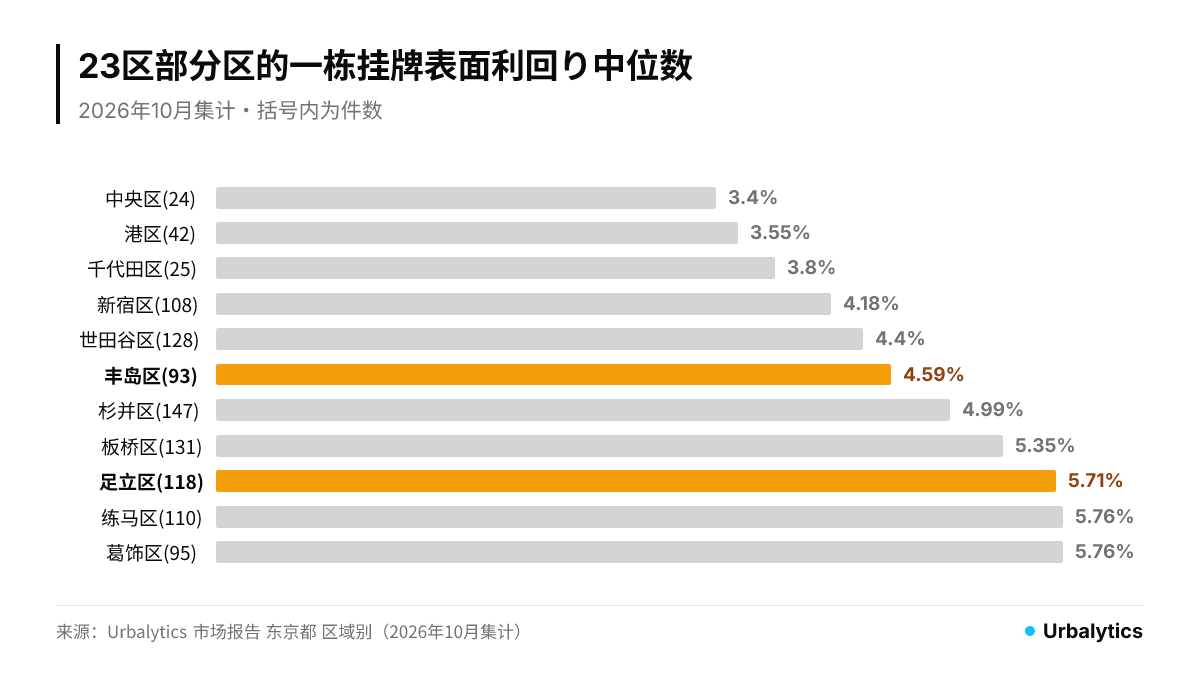
Differences between wards remain much larger than changes over the year. In October, median gross yields were 3.40% in Chuo and 3.55% in Minato, versus more than 5.7% in Adachi, Nerima and Katsushika. Kenbiya’s 5.01% average for Tokyo’s 23 wards was roughly in line with Suginami’s 4.99%.
Station-Level Trends: Ikebukuro and Kita-Senju Move in Opposite Directions
Consider two stations, using entire buildings with listing or price-change records from May through October in each year. At Ikebukuro Station, the median gross yield rose from 4.45% (41 listings) to 4.80% (50 listings), while the median asking price rose from JPY 228,000,000 to JPY 272,500,000. At Kita-Senju Station, the median gross yield fell from 5.56% (42 listings) to 5.19% (38 listings), while the median asking price rose from JPY 103,500,000 to JPY 162,800,000.
Station data at a glance:
Ikebukuro: median gross yield for entire buildings 4.45% (May–October 2025, 41 listings) → 4.80% (May–October 2026, 50 listings); median building asking price JPY 228,000,000 → JPY 272,500,000; median apartment asking rent JPY 4,615/m² (past 12 months, 921 listings)
Kita-Senju: median gross yield for entire buildings 5.56% (42 listings) → 5.19% (38 listings); median building asking price JPY 103,500,000 → JPY 162,800,000; median apartment asking rent JPY 4,400/m² (437 listings)
Source: Urbalytics entire-building sale listings and rental listings, accessed November 14, 2026.
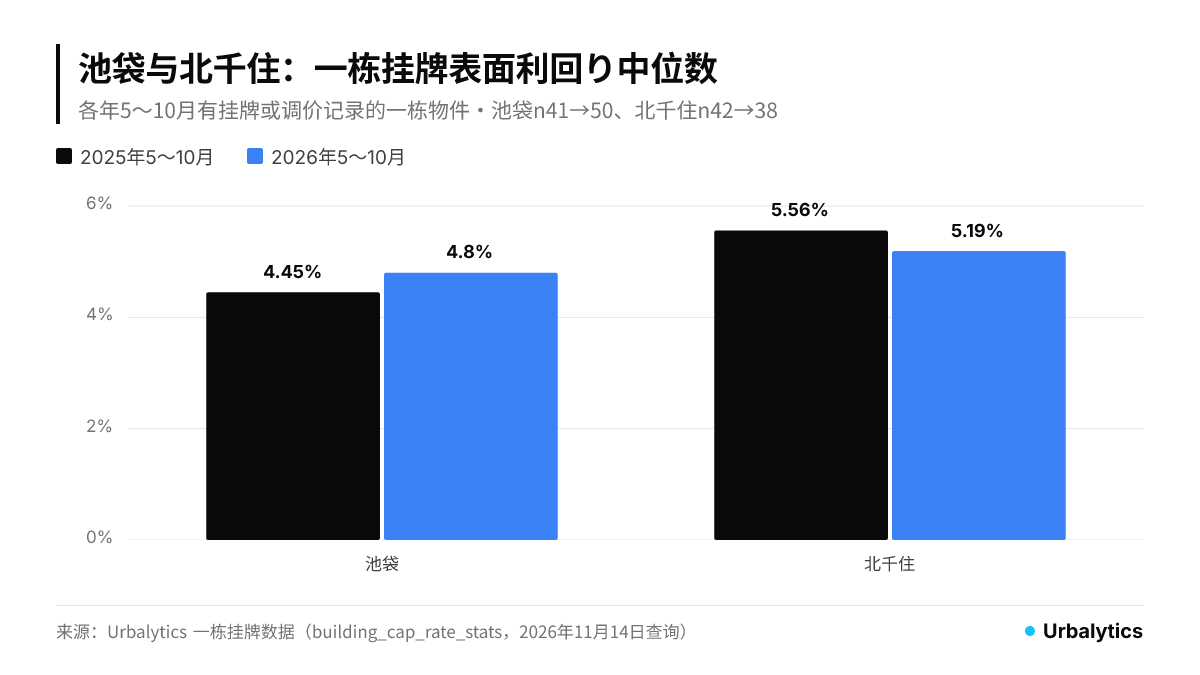
Kita-Senju’s sharp increase in median asking prices partly reflects a different mix of listings this year; the sample even includes a new building scheduled for completion in 2027. However, the 0.37-percentage-point decline in median gross yield indicates that sellers are indeed asking more relative to rental income around this station. Ikebukuro shows the opposite pattern: median prices and yields both rose, indicating that rental income quoted in building listings increased faster than prices.
For rental apartments of 20–60 m² within a 10-minute walk of each station, listed over the past 12 months (November 2025 through October 2026), median asking rents were JPY 4,615/m² in Ikebukuro (921 listings) and JPY 4,400/m² in Kita-Senju (437 listings). That is a gap of less than 5%, yet median gross yields on entire buildings differed by approximately 0.4 percentage points. Kita-Senju’s asking rents are close to Ikebukuro’s, while its listed gross yields are higher—precisely why investors look farther out. But that yield gap has narrowed markedly over the past year.
What This Means for Buyers
When average building asking prices hit a new high, first look at prices per tsubo and price-to-rent multiples. The average listed gross yield for entire buildings in Tokyo’s 23 wards is around 5%. This is projected rental income at full occupancy or current rental income divided by the asking price; income after vacancy, management and repairs will be lower. As discussed in our article Residential REIT Rents on Tenant Turnover and Borrowing Rates, borrowing rates for residential REITs have risen to 2.12%. Individual investors typically face higher financing costs, so a gross yield of around 5% leaves only a modest spread.
Asking prices may also leave room for negotiation. Urbalytics’ price-cut tracker shows that 767 entire investment buildings in Tokyo Metropolis had asking-price reductions in August 2026, with a median cut of 5.0%. Average asking prices for individual condominium units in Tokyo’s 23 wards have already fallen month on month for two consecutive months, and price adjustments for individual condominiums in central Tokyo are also underway. Higher average asking prices for entire buildings do not mean every seller can close at their quoted price.
The key is to check rental assumptions at station level. Stations such as Kita-Senju, where asking rents approach Ikebukuro’s but gross yields remain about 0.4 percentage points higher, merit consideration. Still, check each building’s quoted rental income against asking rents at nearby comparable properties, and factor the past year’s yield compression into your exit-price assumptions.
Data Notes
Kenbiya’s figures are average asking prices and gross yields for properties listed during the month, not transaction prices. Its “capital region” includes Tokyo, Kanagawa, Saitama, Chiba, Ibaraki, Tochigi, Gunma and Yamanashi. The article’s “estimated annual rental income” is average price multiplied by average gross yield and is intended only to indicate scale. Urbalytics’ ward figures are listing medians, with outliers removed using the interquartile-range method. Prices per tsubo for Tokyo’s 23 wards are ward medians weighted by listing count, not the overall median for the 23 wards. The entire-building dataset for April 2026 has fewer listings because some sources were unavailable. Station-level data cover entire buildings with listing or price-change records during the period. Annual rental income uses figures quoted in listings and combines full-occupancy projections with income from in-place leases. Apartment rents are asking base rents excluding management fees, not achieved rents.
#ApartmentBuildings #GrossYield #Tokyo23Wards #TokyoKanagawaSaitamaChiba #InvestmentProperty #Kenbiya #AskingPrices #Ikebukuro #KitaSenju #IndividualCondominiums #JapanRealEstateInvestment #Urbalytics
References
Kenbiya, 2026, “Average Condominium Prices Continue to Fall in the Capital Region and Tokyo’s 23 Wards, While Apartment Building Prices Reach a 1-Year High: Monthly Investment Property Market Report, October 2026” Link
Kenbiya Co., Ltd., 2026, “Monthly Investment Real Estate Market Report, October 2026” (PDF) Link
Urbalytics, 2026, Tokyo Area Market Reports (compiled for November 2025 through October 2026) Link
Cover: illustrative image (Photo: Ryan Rivers / Unsplash)
Copyright: This article is original content by the author. Please do not reproduce, copy, or quote without permission. For usage requests, please contact the author or this site.