Words: 1987 | Estimated Reading Time: 10 minutes | Views: 11
Price corrections have begun in central Tokyo’s resale condo market, but remain concentrated in the most expensive wards, Minato and Chiyoda, following their summer peaks. The broader signal is that listing inventory has grown roughly seventy to eighty percent over the past year while asking rents have barely moved. For investors buying individual condo units, better returns must therefore come from negotiating the purchase price.
What a Grid-Based Report Reveals
On November 7, Gold Online republished the Tokyo Resale Condominium Market Survey Report for July–September 2026 by real-estate technology research firm Tsukuru Research Institute. The report divides Tokyo into 12,939 grid cells measuring 250 meters across. For each cell, it calculates the average asking price per sqm for reinforced-concrete or steel-reinforced-concrete condos within an 800-meter radius, aged between 1 and 30 years, with a private floor area of at least 40 sqm.
The simple average across grid cells shows asking prices per sqm rising 1.6% quarter on quarter in July–September 2026, with a median increase of 1.0%. The year-on-year average increase was 13.1%, with a median of 12.7%. Prices were still rising in most locations, but considerably more cells recorded quarterly declines. Some locations in central wards including Chiyoda, Minato and Meguro were also below year-earlier levels. The report concludes that the market is shifting from broad-based gains toward greater property selectivity: sellers of less competitive or overpriced properties face pressure to make concessions first.
An important caveat: the report uses asking prices, not transaction prices, and does not control for changes in building age or unit layout within each grid cell. It indicates weakening price momentum, not how much any particular property has lost in value.
Transaction data had already moved ahead of asking prices. East Japan Real Estate Information Network Systems (REINS) data compiled by Diamond Real Estate Research Institute put Tokyo’s resale condo transaction price in September 2026 at ¥67,280,000, down 3.3% year on year and below the year-earlier level for the second consecutive month. Asking prices, meanwhile, rose 11.3% year on year to ¥89,990,000. The gap between sellers’ expectations and what buyers actually paid continued to widen.
Ward-Level Trends: Minato Falls, Chiyoda Retreats from Its Peak, Meguro Keeps Rising
The grid report’s locations with year-on-year declines are scattered. To examine the broader trend, we used monthly ward-level data from Urbalytics Market Reports to track median asking prices per sqm across the three wards over the past year.
Minato: ¥2,492,000 in October 2025 and ¥2,491,000 in July 2026, falling in October 2026 to ¥2,346,000 (1,576 listings), down approximately 5.9% year on year.
Chiyoda: ¥1,874,000 in October 2025, rising to ¥2,437,000 in July 2026 before retreating in October to ¥2,157,000 (366 listings), still approximately 15% above a year earlier but roughly ten percent below July.
Meguro: ¥1,273,000, ¥1,575,000 and ¥1,648,000 (520 listings), continuing to rise. For comparison, the Tokyo-wide figures were ¥936,000, ¥1,097,000 and ¥1,185,000.
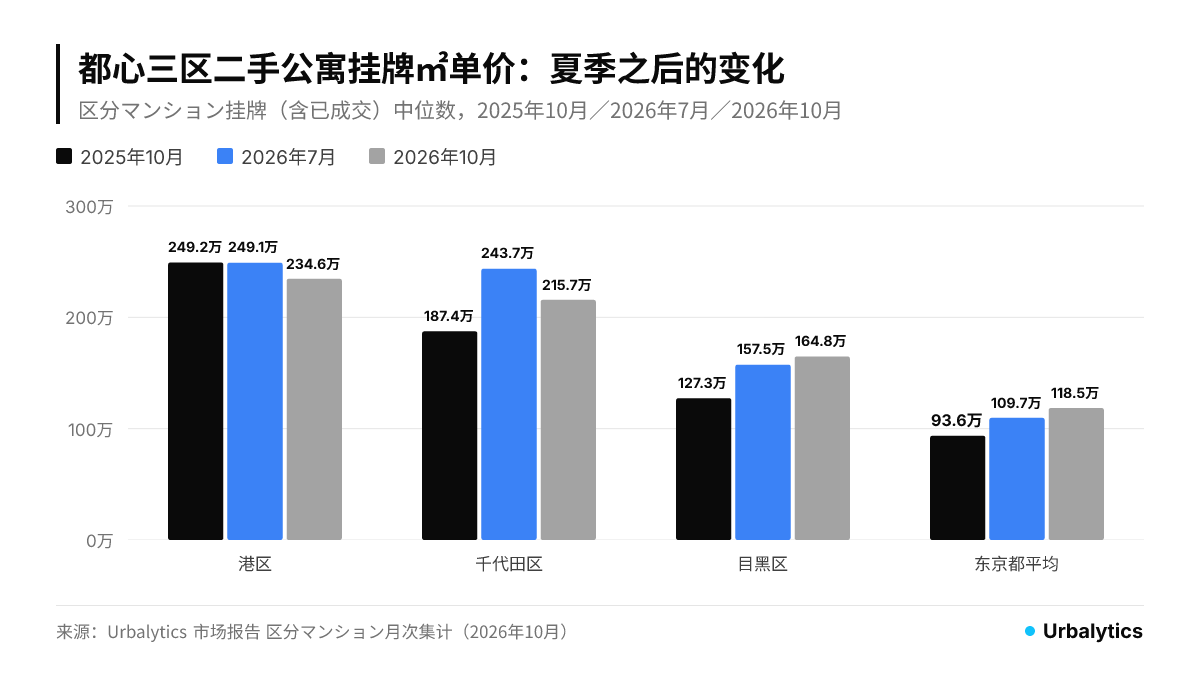
The divergence is readily explained. Minato’s prices per sqm were already roughly twice the Tokyo average, so rising interest rates first reduced the pool of buyers able to afford them. Chiyoda has a small sample: just 198 listings in October last year. Median listed floor area also changed from 45.1 sqm to 51.1 sqm, making year-on-year comparisons particularly sensitive to the listing mix. The retreat from the July peak is a more reliable reference. Meguro’s prices per sqm are only around seventy percent of Minato’s, and owner-occupier families are still buying.
The claim that central Tokyo prices have started falling therefore needs qualification: Minato has declined at the ward level, and Chiyoda has retreated from its summer peak. In Meguro, weakness remains limited to certain locations.
A Clearer Signal Than Prices: Inventory Up Roughly Seventy to Eighty Percent in a Year
Median prices can be distorted by changes in the listing mix; listing counts offer a more direct signal. In October 2026, Minato had 1,576 resale condo listings, up from 864 a year earlier, an increase of 82.4%. Chiyoda rose from 198 to 366, up 84.8%; Meguro rose from 306 to 520, up 69.9%. Across Tokyo, listings increased from 12,095 to 17,645, up 45.9%.
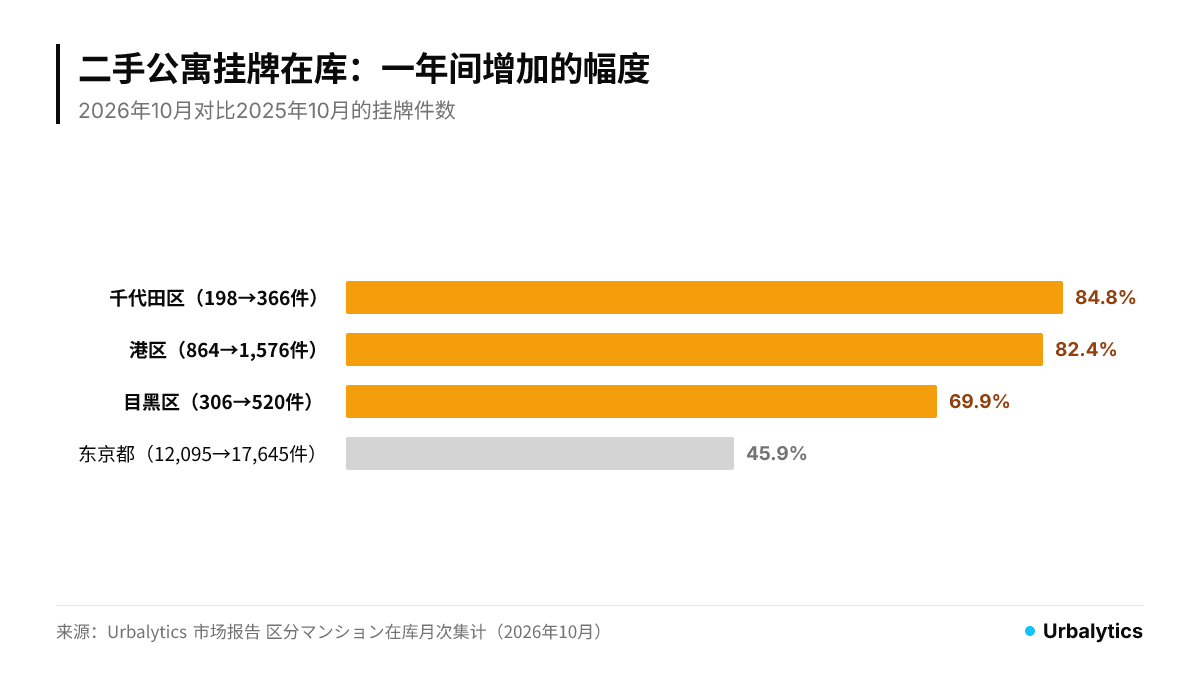
Inventory growth in the three wards exceeded Tokyo’s overall pace by more than twenty to nearly forty percentage points. Asking-price cuts are already occurring: Urbalytics’ price-reduction tracker shows that in August 2026, Minato recorded 700 resale condos with asking-price cuts, with a median reduction of 4.0%. Chiyoda recorded 136, with a median cut of 4.4%; Meguro recorded 220, with a median cut of 3.5%.
For buyers, the negotiating environment has changed. There are considerably more comparable properties than a year ago, making it harder for sellers to defend their asking price solely by pointing to a recent high-priced sale nearby.
Urbalytics Data Insight
A ward’s median price can fluctuate with its listing mix, while inventory and price-cut counts are less sensitive to that mix. When assessing whether central Tokyo’s market is turning, it is more reliable to examine inventory and price cuts before prices per sqm. Monthly ward-level figures are available on pages such as the Minato Resale Condo Market Report and other ward-level reports.
With Rents Largely Flat, Better Yields Must Come from Lower Prices
Whether softer prices are good or bad news for individual-condo investors depends on rents. Using Urbalytics rental listings, we examined condos in the three wards with at least 40 sqm of private floor area, completed in 1996 or later. We compared average monthly asking rent per tsubo, a Japanese floor-area unit, including management fees, grouping listings by the quarter in which they were first observed.
Minato declined from ¥24,700 in July–September 2025 to ¥24,100 in July–September 2026, a fall of 2.4%. Chiyoda was essentially flat, moving from ¥20,300 to ¥20,400. Meguro rose from ¥17,500 to ¥18,500, up 5.7%. Quarterly samples in 2025 contained only 24–90 listings, so Chiyoda’s figures in particular should be treated as indicative only. Even so, the overall message is consistent: asking rents for family-sized condos have not risen substantially in central Tokyo.
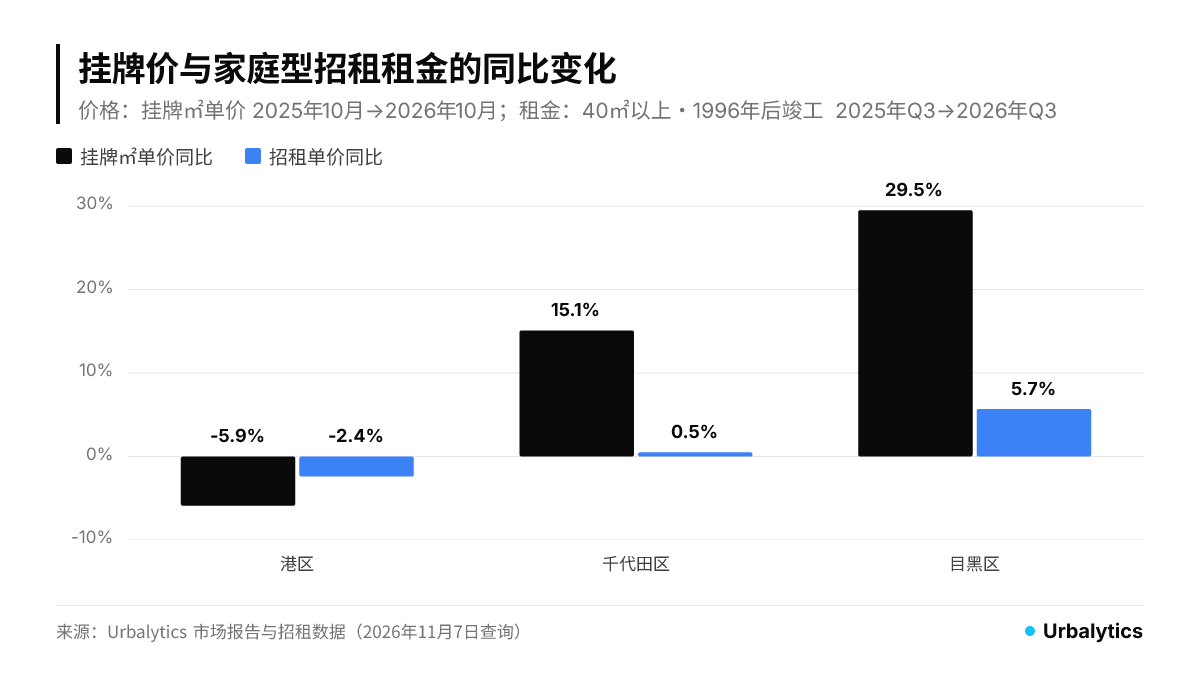
Taken together, the figures show modest declines in both prices and asking rents in Minato. In Chiyoda and Meguro, price growth far outpaced asking-rent growth. Properties bought in those latter wards over the past year therefore offer lower gross yields than a year earlier.
Whole-building rental property listings provide a reference for yields in the same locations. In Minato, the median gross yield for whole-building investment properties rose from 3.00% (35 listings) in October 2025 to 3.55% (42 listings) in October 2026. Meguro rose from 3.87% (48 listings) to 4.03% (44 listings), while the Tokyo-wide average remained broadly stable at 5.10% and 5.11%. Each ward’s sample contains only around forty properties, so just one or two buildings can shift the median. Nevertheless, the recovery in central Tokyo gross yields is consistent with the individual-condo market.
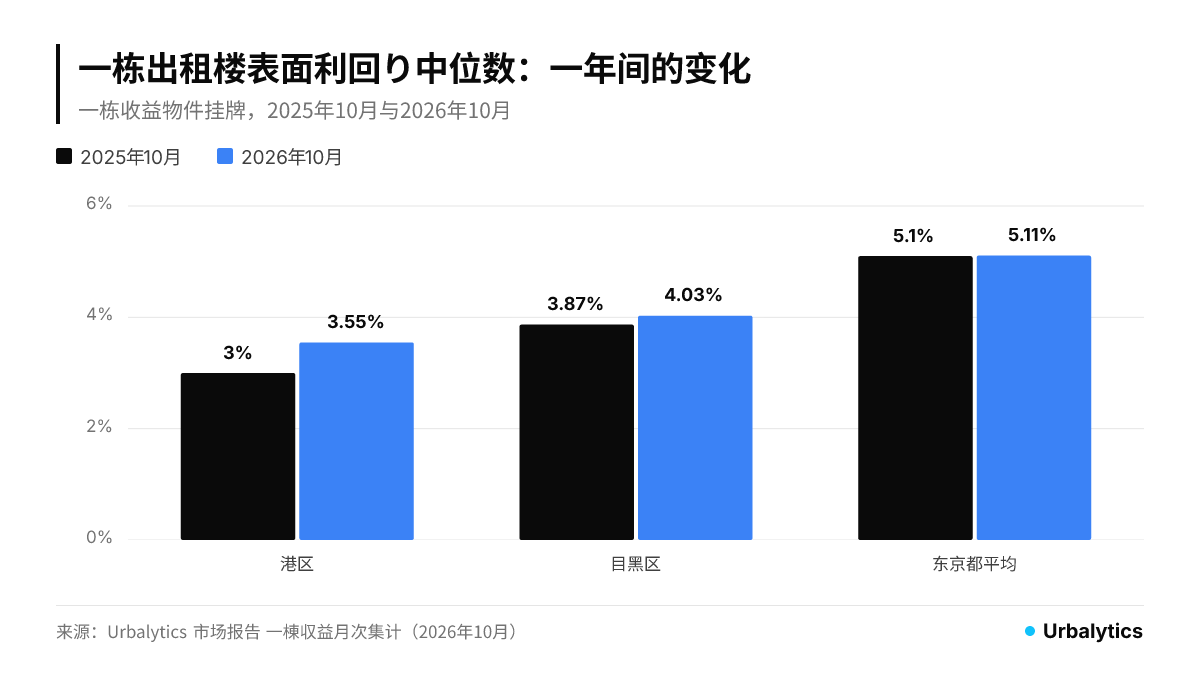
The recovery reflects higher funding costs. The Bank of Japan raised its policy rate to around 1.25% on September 18 and left it unchanged at its October meeting. The 10-year Japanese government bond yield exceeded 3% on September 1 for the first time in roughly 30 years. The coupon on the 10-year government bond issued in October was set at 3.1%.
Minato’s median whole-building gross yield remains around 3.5%. Income after management, repairs and vacancy costs is lower, leaving almost no scope for positive leverage when buying with debt. If rents do not rise, further price adjustments are the only way for yields to catch up with funding costs.
Where to Start Negotiating on a Central Tokyo Condo
Asking prices in Minato and Chiyoda have moved below their peaks, but remain far from cheap. A more practical negotiating benchmark is current asking rent in the same building or block, rather than a recent high-priced sale. For a family-sized unit, multiply the building’s recent asking rent per unit of floor area by the unit’s area and 12 months, then divide by the asking sale price to estimate gross yield. Compare that with the current borrowing rate: the narrower the gap, the stronger the case for requesting a price concession.
With inventory up roughly eighty percent, long-listed properties that have already had a price cut are the strongest candidates for an offer. The median reduction across Minato’s 700 price-cut listings in August was only 4.0%, suggesting that most sellers were still testing the market with modest adjustments. Buyers need not settle for similarly small concessions on properties listed for more than three months and still priced at summer levels.
Meguro is different. Prices are still rising, and asking rents have increased 5.7%, with owner-occupier demand supporting price gains. But prices have risen much faster than rents over the past year, so buying at today’s prices means accepting a lower gross yield than last year. Investors are better served by waiting for inventory to build further than by chasing prices.
Interest rates triggered this adjustment and will continue to shape it. The timing of the Bank of Japan’s next rate increase, and whether long-term rates stabilize around 3%, will determine whether central Tokyo prices move lower or hold near current levels.
Data Notes
Ward-level prices and inventory come from the monthly individual-condo-unit statistics in Urbalytics Market Reports. Prices are median asking prices, including listing records for properties that have since sold, across all building ages and floor areas in each ward. This differs from Tsukuru Research Institute’s sample, which is limited to buildings no more than 30 years old and units of at least 40 sqm; the resulting rates of change are not directly comparable. Inventory means listings recorded during the month, not completed transactions. Price-cut counts and reductions come from the same pages’ price-reduction tracker for August 2026.
Rental figures are asking rents from Urbalytics rental listings, including management fees, not rents agreed in signed leases. Samples are grouped by the quarter of first observation. Quarterly samples in 2025 are substantially smaller than in 2026, and quarterly averages are also affected by the listing mix. Whole-building yields are gross yields calculated using asking prices, before expenses. Annual income may assume full occupancy or reflect in-place leases.
For more detail on monthly trends by ward, see the Tokyo Market Report. Our earlier analysis of how central Tokyo price cuts are spreading includes Price Cuts Begin in Central Tokyo and the Bay Area, with Nearly Sixty Percent of Kachidoki Listings Reduced and Properties Around ¥100,000,000 See the Most Price Cuts, While Those Below ¥50,000,000 Barely Move.

#CentralTokyo #Minato #Chiyoda #Meguro #ResaleCondos #IndividualCondoUnits #PriceCorrection #ListingInventory #PriceCuts #AskingRents #GrossYield #BOJRateHikes #JapanPropertyInvestment #Urbalytics
Sources
Gold Online (Yahoo! News), 2026, More Tokyo Resale Condo Locations Fall Below Year-Earlier Prices: The Price Correction That Began in Central Tokyo in Summer 2026
Diamond Real Estate Research Institute, 2026, Tokyo Resale Condo Market in September: Transaction Price of ¥67,280,000, Below Year-Earlier Levels for 2 Consecutive Months
Kumamoto Nichinichi Shimbun (Kyodo News), 2026, Bank of Japan Raises Rate to 1.25%, Accelerating to an Interval as Short as 3 Months
Sumitomo Mitsui DS Asset Management, 2026, Bank of Japan Policy Meeting Review, October 2026
Kumamoto Nichinichi Shimbun (Kyodo News), 2026, 10-Year Government Bond Coupon Set at 3.1% as Interest Rates Reach a 30-Year High
Urbalytics, 2026, Chiyoda Individual Condo Unit Market Report, Meguro Individual Condo Unit Market Report, Minato Whole-Building Investment Property Market Report
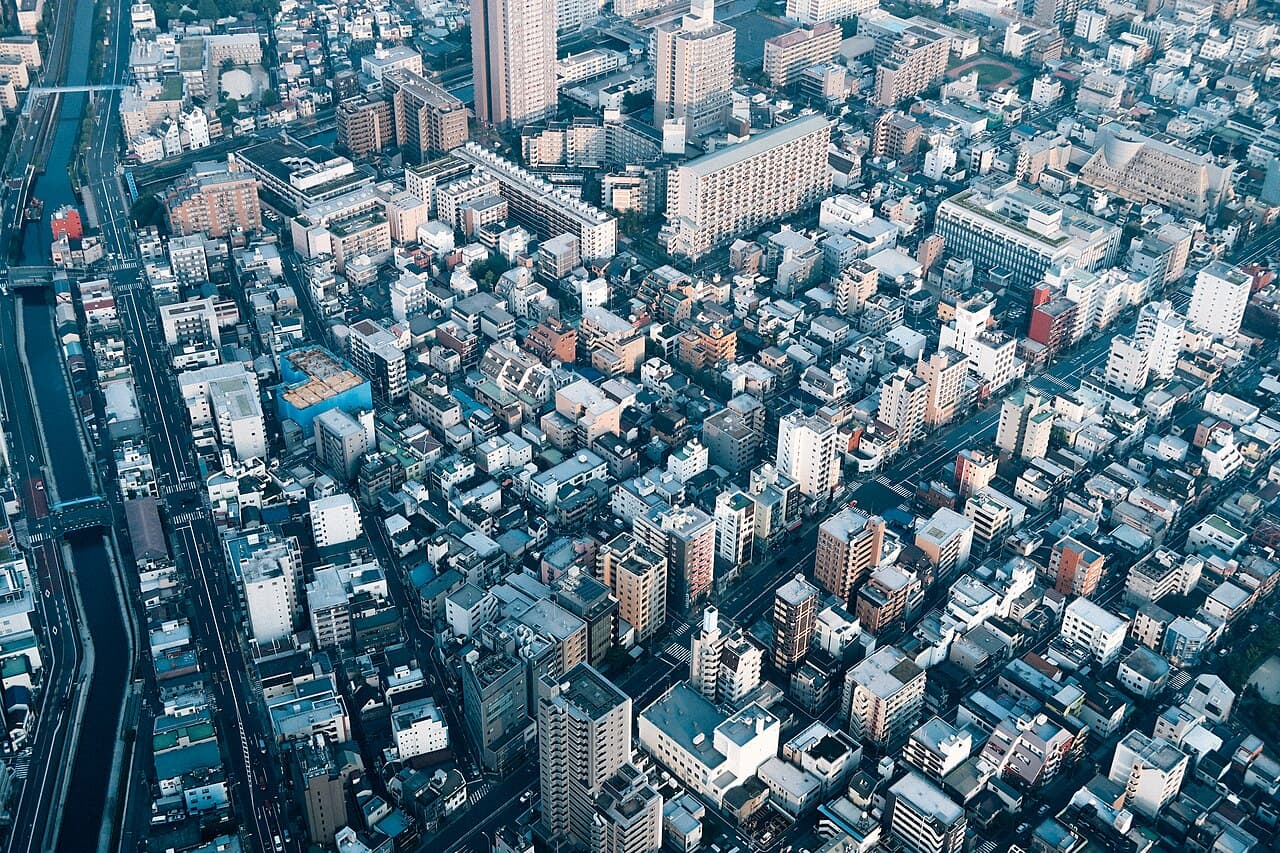
Cover image: illustrative photograph (Photo: Ryusei Machida / Unsplash)
Copyright: This article is original content by the author. Please do not reproduce, copy, or quote without permission. For usage requests, please contact the author or this site.