
Meguro, Tokyo condominium units market report
Record counts, unit-price trends and a comparison against the Tokyo average, aggregated monthly by Urbalytics for condominium units listed in Meguro, Tokyo. Latest month: October 2026.
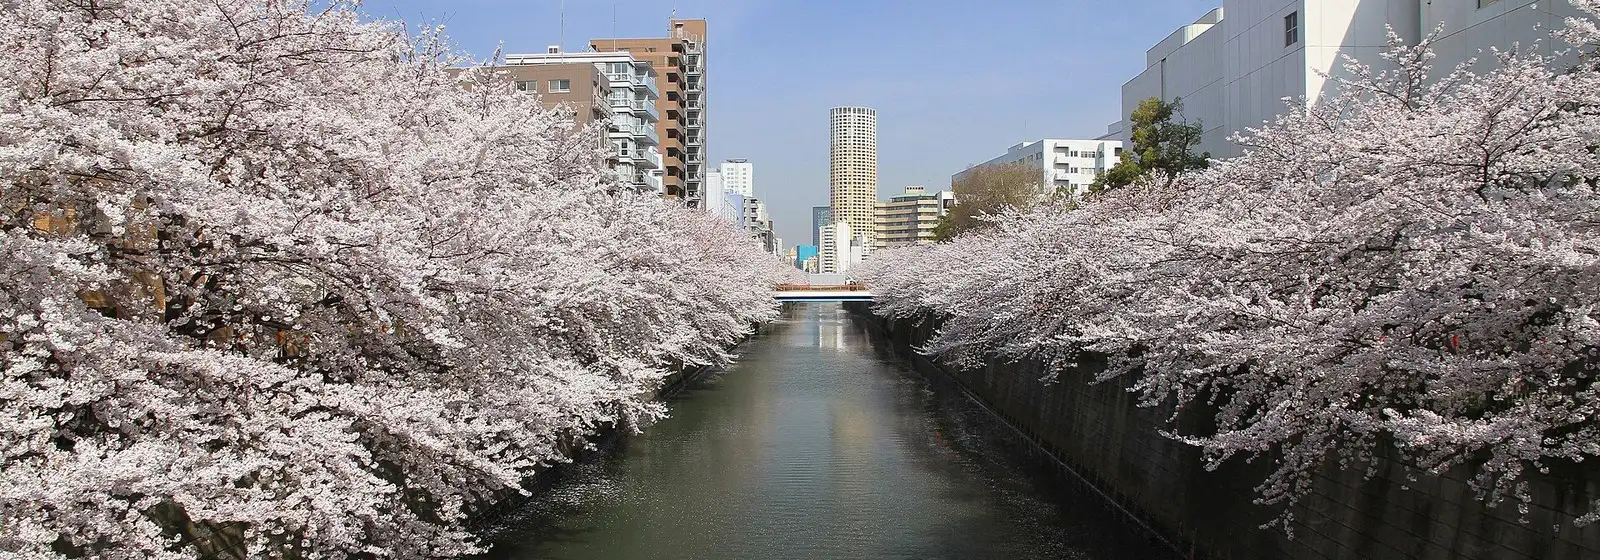
Meguro Meguro River Cherry Trees·京浜にけ/CC BY-SA 3.0 (cropped)·Wikimedia Commons
Meguro, Tokyo condominium units|overview
#Counts are condominium units listings in Meguro, Tokyo for which a price could be obtained (on the market and closed). The commentary is derived mechanically from the figures on this page.
What the data says
- As of October 2026, Price per ㎡ of floor area for condominium units in Meguro, Tokyo is ¥1.65M/㎡ — 39.1% above the Tokyo average of ¥1.19M/㎡ (520 records).
asking price and area for condominium units
#Condominium — Asking price and Price per ㎡ of floor area over time
Asking price = the median of prices published to the market. Read as a series, the level of the total shows where the market is moving.
Price per ㎡ of floor area = asking price ÷ floor area. What the property is asking per unit of space (1 tsubo ≈ 3.31㎡).
Asking price
Unit: ¥MPrice per ㎡ of floor area
Unit: ¥M/㎡| Month | Asking price — Meguro | Asking price — Tokyo | Difference (Asking price) | Price per ㎡ of floor area — Meguro | Price per ㎡ of floor area — Tokyo | Records |
|---|---|---|---|---|---|---|
| 2026年10月 | 89.9 | 62.0 | +45.0% | 1.65 | 1.19 | 520 |
| 2026年9月 | 85.8 | 59.8 | +43.5% | 1.61 | 1.17 | 444 |
| 2026年8月 | 87.0 | 58.6 | +48.5% | 1.57 | 1.14 | 367 |
| 2026年7月 | 89.8 | 54.8 | +63.9% | 1.58 | 1.10 | 519 |
| 2026年6月 | 79.8 | 53.8 | +48.3% | 1.50 | 1.09 | 649 |
| 2026年5月 | 76.8 | 48.0 | +60.1% | 1.43 | 1.02 | 543 |
| 2026年4月 | 68.9 | 45.8 | +50.5% | 1.40 | 1.00 | 323 |
| 2026年3月 | 77.5 | 49.8 | +55.5% | 1.46 | 1.03 | 373 |
| 2026年2月 | 69.8 | 49.3 | +41.6% | 1.38 | 1.01 | 348 |
| 2026年1月 | 64.8 | 47.8 | +35.6% | 1.38 | 1.00 | 310 |
| 2025年12月 | 65.0 | 48.8 | +33.1% | 1.32 | 0.99 | 293 |
| 2025年11月 | 69.0 | 45.0 | +53.3% | 1.36 | 0.95 | 294 |
| 2025年10月 | 63.8 | 44.0 | +45.0% | 1.27 | 0.94 | 306 |
| 2025年9月 | 63.8 | 43.8 | +45.7% | 1.33 | 0.93 | 307 |
| 2025年8月 | 59.4 | 41.8 | +42.1% | 1.21 | 0.91 | 282 |
| 2025年7月 | 75.8 | 47.5 | +59.6% | 1.36 | 0.95 | 358 |
| 2025年6月 | 59.9 | 40.0 | +49.7% | 1.26 | 0.89 | 329 |
| 2025年5月 | 55.0 | 39.6 | +39.0% | 1.22 | 0.87 | 389 |
| 2025年4月 | 48.1 | 36.8 | +30.7% | 1.05 | 0.83 | 366 |
| 2025年3月 | 51.3 | 38.0 | +34.9% | 1.09 | 0.83 | 383 |
| 2025年2月 | 84.8 | 52.8 | +60.6% | 1.41 | 0.96 | 438 |
| 2025年1月 | 89.8 | 55.8 | +60.9% | 1.49 | 1.01 | 445 |
| 2024年12月 | 85.0 | 52.8 | +61.0% | 1.43 | 0.97 | 383 |
| 2024年11月 | 103.9 | 69.8 | +48.9% | 1.62 | 1.16 | 179 |
| 2024年10月 | 98.0 | 69.8 | +40.4% | 1.56 | 1.17 | 162 |
| 2024年9月 | 98.0 | 66.8 | +46.6% | 1.59 | 1.13 | 171 |
| 2024年8月 | 89.8 | 63.8 | +40.8% | 1.55 | 1.08 | 141 |
| 2024年7月 | 89.4 | 61.3 | +45.8% | 1.53 | 1.03 | 159 |
| 2024年6月 | 93.9 | 65.0 | +44.5% | 1.49 | 1.07 | 186 |
| 2024年5月 | 94.3 | 64.8 | +45.5% | 1.55 | 1.06 | 177 |
| 2024年4月 | 90.0 | 58.8 | +53.0% | 1.51 | 1.00 | 203 |
| 2024年3月 | 82.8 | 56.8 | +45.8% | 1.43 | 0.97 | 231 |
| 2024年2月 | 80.0 | 57.7 | +38.6% | 1.41 | 0.98 | 262 |
| 2024年1月 | 78.4 | 55.8 | +40.5% | 1.35 | 0.96 | 301 |
| 2023年12月 | 79.8 | 54.8 | +45.6% | 1.36 | 0.94 | 320 |
| 2023年11月 | 81.8 | 54.8 | +49.3% | 1.30 | 0.94 | 337 |
| 2023年10月 | 86.8 | 55.0 | +57.8% | 1.38 | 0.96 | 309 |
| 2023年9月 | 84.8 | 54.8 | +54.7% | 1.28 | 0.93 | 233 |
| 2023年8月 | 81.7 | 54.8 | +49.1% | 1.28 | 0.93 | 223 |
| 2023年7月 | 83.8 | 54.8 | +52.9% | 1.31 | 0.94 | 212 |
| 2023年6月 | 84.8 | 59.8 | +41.8% | 1.31 | 1.01 | 310 |
| 2023年5月 | 72.4 | 49.9 | +45.0% | 1.25 | 0.88 | 188 |
| 2023年4月 | 69.7 | 49.8 | +39.9% | 1.26 | 0.87 | 180 |
| 2023年3月 | 69.8 | 47.8 | +46.0% | 1.25 | 0.86 | 131 |
| 2023年2月 | 69.8 | 47.8 | +46.0% | 1.27 | 0.84 | 137 |
| 2023年1月 | 75.8 | 53.9 | +40.6% | 1.29 | 0.91 | 84 |
| 2022年12月 | 75.9 | 51.8 | +46.5% | 1.31 | 0.89 | 201 |
Source: monthly aggregates of listing and rental-offer data collected by Urbalytics
Conditions
- Source: listings Urbalytics collects (on the market and closed)
- Publication threshold: figures shown only for months with 10 or more records
- Statistic: median (P20–P80 is the 20th to 80th percentile). Outliers removed by the IQR method
- In a thin month (10–30 records) both the median and the P20–P80 band move on a single listing. Read them alongside the record count shown next to each figure.
- Period: from 12 2022 — the window over which each property type is aggregated independently
What the data says
- As of October 2026, Price per ㎡ of floor area for condominium units in Meguro, Tokyo is ¥1.65M/㎡ — 39.1% above the Tokyo average of ¥1.19M/㎡ (520 records).
- From December 2022 to October 2026, Price per ㎡ of floor area for condominium units in Meguro, Tokyo went from ¥1.31M/㎡ to ¥1.65M/㎡ — up (+26.1%).
- From December 2022 to October 2026, Asking price for condominium units in Meguro, Tokyo went from ¥75.9M to ¥89.9M — up (+18.4%).
Condominium — Exclusive floor area over time
Exclusive floor area = the median Exclusive floor area among listed properties. At the same Price per ㎡ of floor area, more space still means a higher total — which is why this is read alongside the price series.
| Month | Meguro | Tokyo | Difference | Records |
|---|---|---|---|---|
| 2026年10月 | 56.2 | 57.7 | −2.6% | 520 |
| 2026年9月 | 56.0 | 58.0 | −3.4% | 444 |
| 2026年8月 | 56.9 | 57.5 | −1.0% | 367 |
| 2026年7月 | 55.4 | 57.0 | −2.8% | 519 |
| 2026年6月 | 54.0 | 56.7 | −4.8% | 649 |
| 2026年5月 | 55.3 | 56.1 | −1.4% | 543 |
| 2026年4月 | 53.7 | 55.8 | −3.8% | 323 |
| 2026年3月 | 53.8 | 56.8 | −5.3% | 373 |
| 2026年2月 | 50.2 | 57.3 | −12.4% | 348 |
| 2026年1月 | 49.2 | 56.6 | −13.1% | 310 |
| 2025年12月 | 52.9 | 57.5 | −8.0% | 293 |
| 2025年11月 | 53.7 | 56.5 | −5.0% | 294 |
| 2025年10月 | 49.5 | 56.5 | −12.4% | 306 |
| 2025年9月 | 49.5 | 56.7 | −12.7% | 307 |
| 2025年8月 | 46.8 | 55.8 | −16.1% | 282 |
| 2025年7月 | 54.3 | 57.8 | −6.1% | 358 |
| 2025年6月 | 48.8 | 55.7 | −12.4% | 329 |
| 2025年5月 | 45.9 | 55.3 | −17.0% | 389 |
| 2025年4月 | 42.9 | 54.4 | −21.1% | 366 |
| 2025年3月 | 46.7 | 55.8 | −16.3% | 383 |
| 2025年2月 | 57.9 | 62.0 | −6.6% | 438 |
| 2025年1月 | 58.0 | 62.0 | −6.5% | 445 |
| 2024年12月 | 57.8 | 62.0 | −6.8% | 383 |
| 2024年11月 | 64.4 | 66.0 | −2.4% | 179 |
| 2024年10月 | 60.1 | 65.6 | −8.4% | 162 |
| 2024年9月 | 61.2 | 64.6 | −5.3% | 171 |
| 2024年8月 | 58.2 | 65.4 | −11.0% | 141 |
| 2024年7月 | 58.3 | 65.1 | −10.4% | 159 |
| 2024年6月 | 60.8 | 66.0 | −7.9% | 186 |
| 2024年5月 | 60.5 | 66.0 | −8.3% | 177 |
| 2024年4月 | 58.1 | 64.8 | −10.3% | 203 |
| 2024年3月 | 57.0 | 64.0 | −10.9% | 231 |
| 2024年2月 | 56.8 | 64.2 | −11.5% | 262 |
| 2024年1月 | 56.5 | 64.0 | −11.7% | 301 |
| 2023年12月 | 57.8 | 64.0 | −9.7% | 320 |
| 2023年11月 | 60.0 | 63.6 | −5.7% | 337 |
| 2023年10月 | 59.2 | 64.0 | −7.5% | 309 |
| 2023年9月 | 62.0 | 64.0 | −3.1% | 233 |
| 2023年8月 | 59.7 | 64.0 | −6.7% | 223 |
| 2023年7月 | 60.9 | 63.8 | −4.5% | 212 |
| 2023年6月 | 61.1 | 64.0 | −4.5% | 310 |
| 2023年5月 | 56.0 | 62.0 | −9.7% | 188 |
| 2023年4月 | 56.0 | 62.0 | −9.7% | 180 |
| 2023年3月 | 56.0 | 62.0 | −9.7% | 131 |
| 2023年2月 | 55.3 | 62.0 | −10.8% | 137 |
| 2023年1月 | 60.0 | 64.0 | −6.3% | 84 |
| 2022年12月 | 58.0 | 64.0 | −9.4% | 201 |
Source: monthly aggregates of listing and rental-offer data collected by Urbalytics
Conditions
- Source: listings Urbalytics collects (on the market and closed)
- Area: building area is gross floor area (exclusive area for condominium units); land area is the registered figure
- Publication threshold: figures shown only for months with 10 or more records
- Statistic: median (P20–P80 is the 20th to 80th percentile)
What the data says
- As of October 2026, Exclusive floor area for condominium units in Meguro, Tokyo is 56.2㎡ — 2.6% below the Tokyo average of 57.7㎡ (520 records).
Asking rent and area over time
#Total rent = monthly rent + common charges; rent per unit area is that divided by area. Area is the variable between the two — a month where only the total moved is a month where the space on offer changed, not the price.
Sign up free to see all the data
Detailed distributions and trends are available on a free account.
condominium units: listings over time
#Sign up free to see all the data
Detailed distributions and trends are available on a free account.
Figures on this page are derived statistics: monthly aggregates of listing and rental-offer data collected by Urbalytics. They are not individual transaction records.
Condominium prices in areas near Meguro, Tokyo
Municipalities with a Condominium report, nearest to Meguro, Tokyo first. Distance is measured between municipality centres.
- 渋谷区3.8km857October 2026
- 品川区3.8km857October 2026
- 世田谷区4.5km1,000October 2026
- 港区5.8km1,576October 2026
- 大田区6.5km723October 2026
- 川崎市中原区6.8km274October 2026
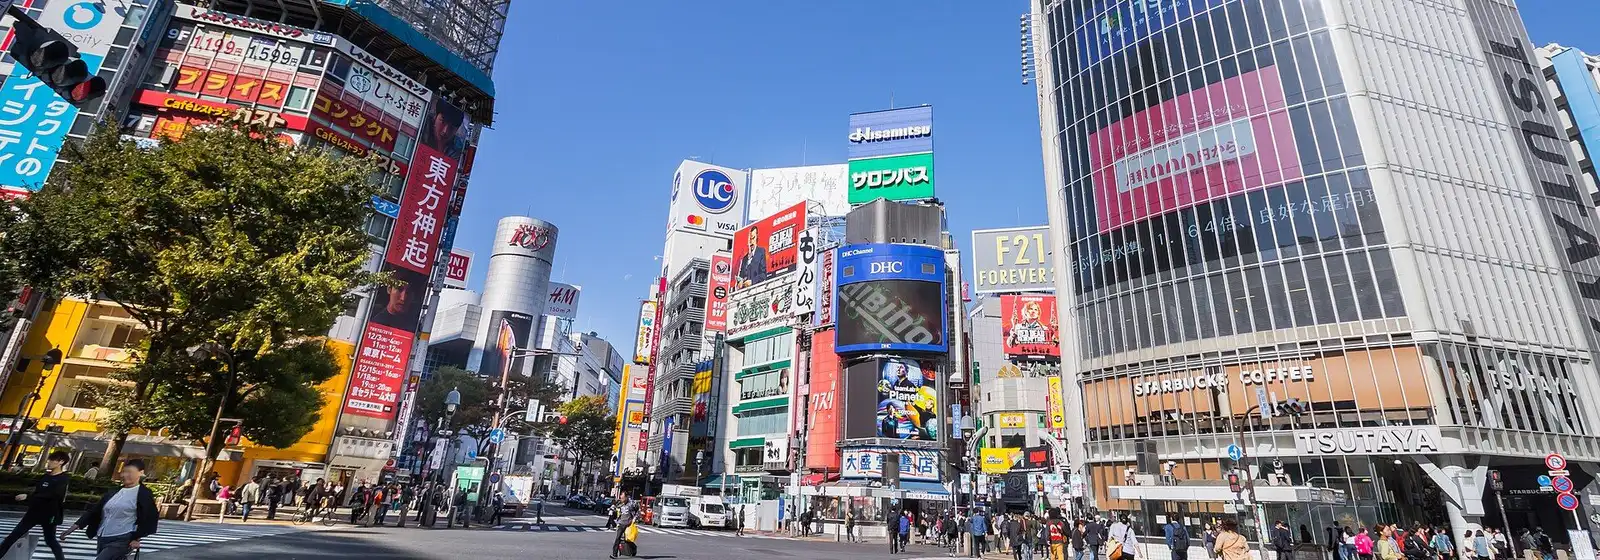
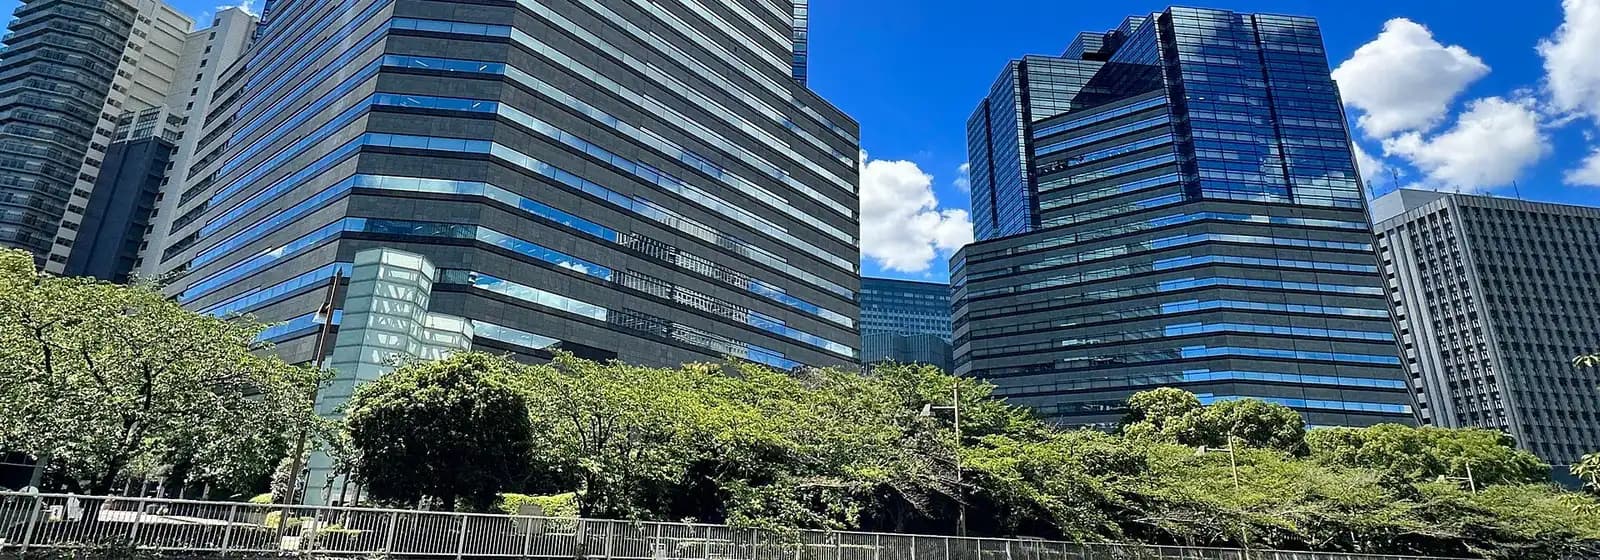
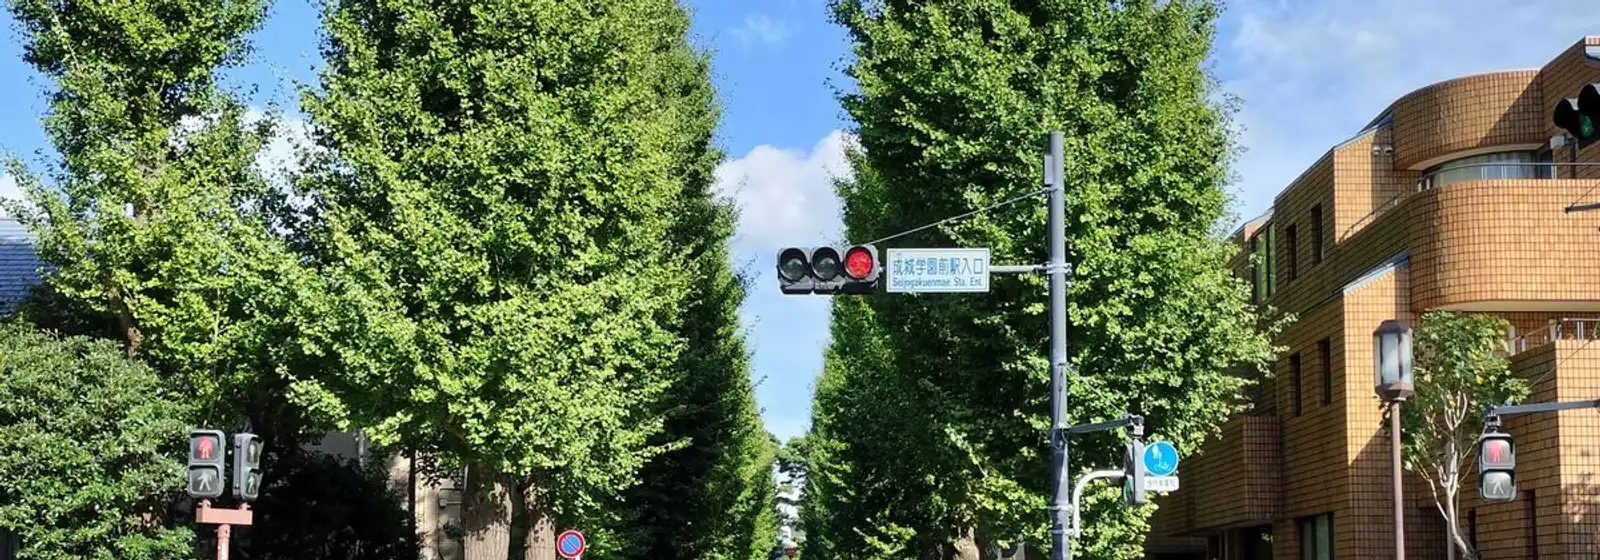

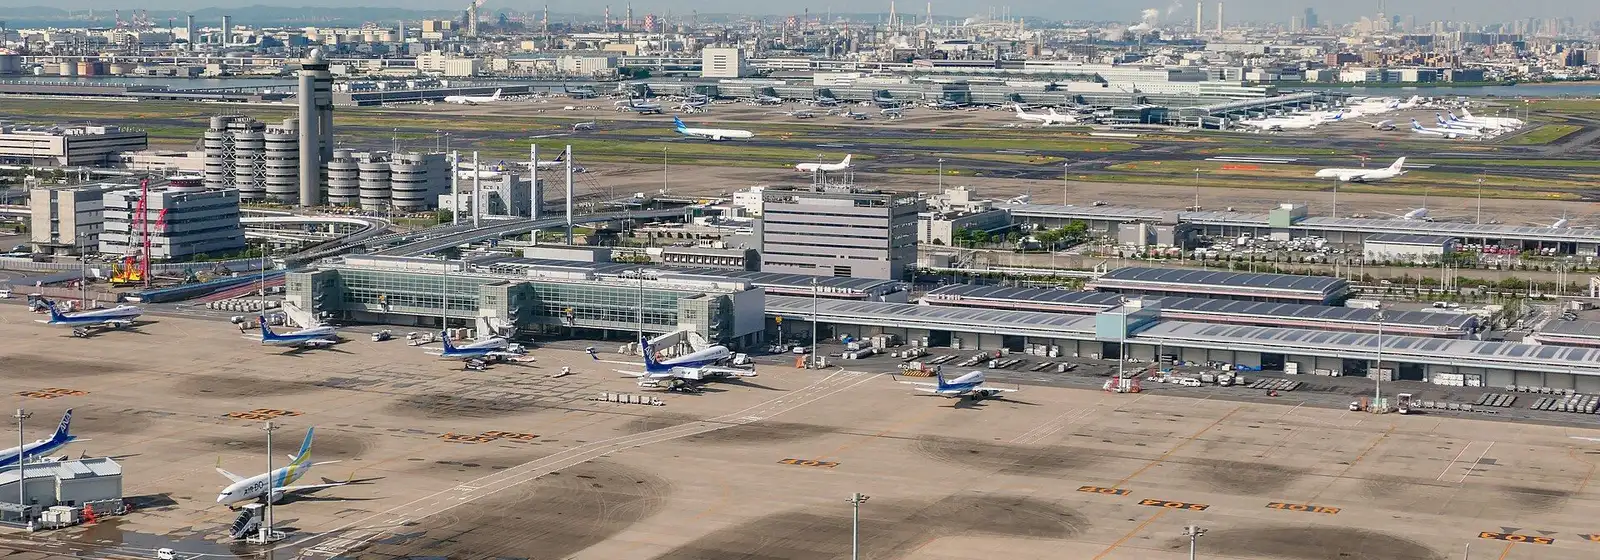
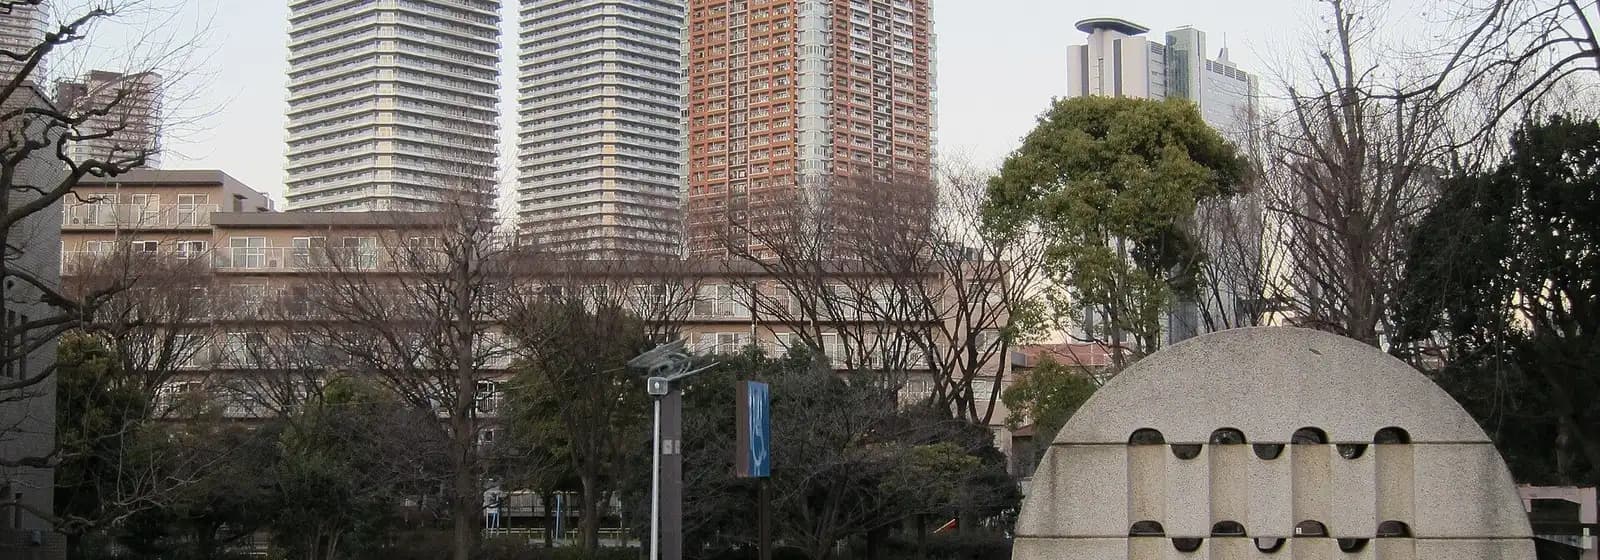
Area photographs from Wikimedia Commons (author and licence for each are given on that area’s own report page).
Articles on Meguro, Tokyo
Urbalytics analysis written about Meguro, Tokyo.

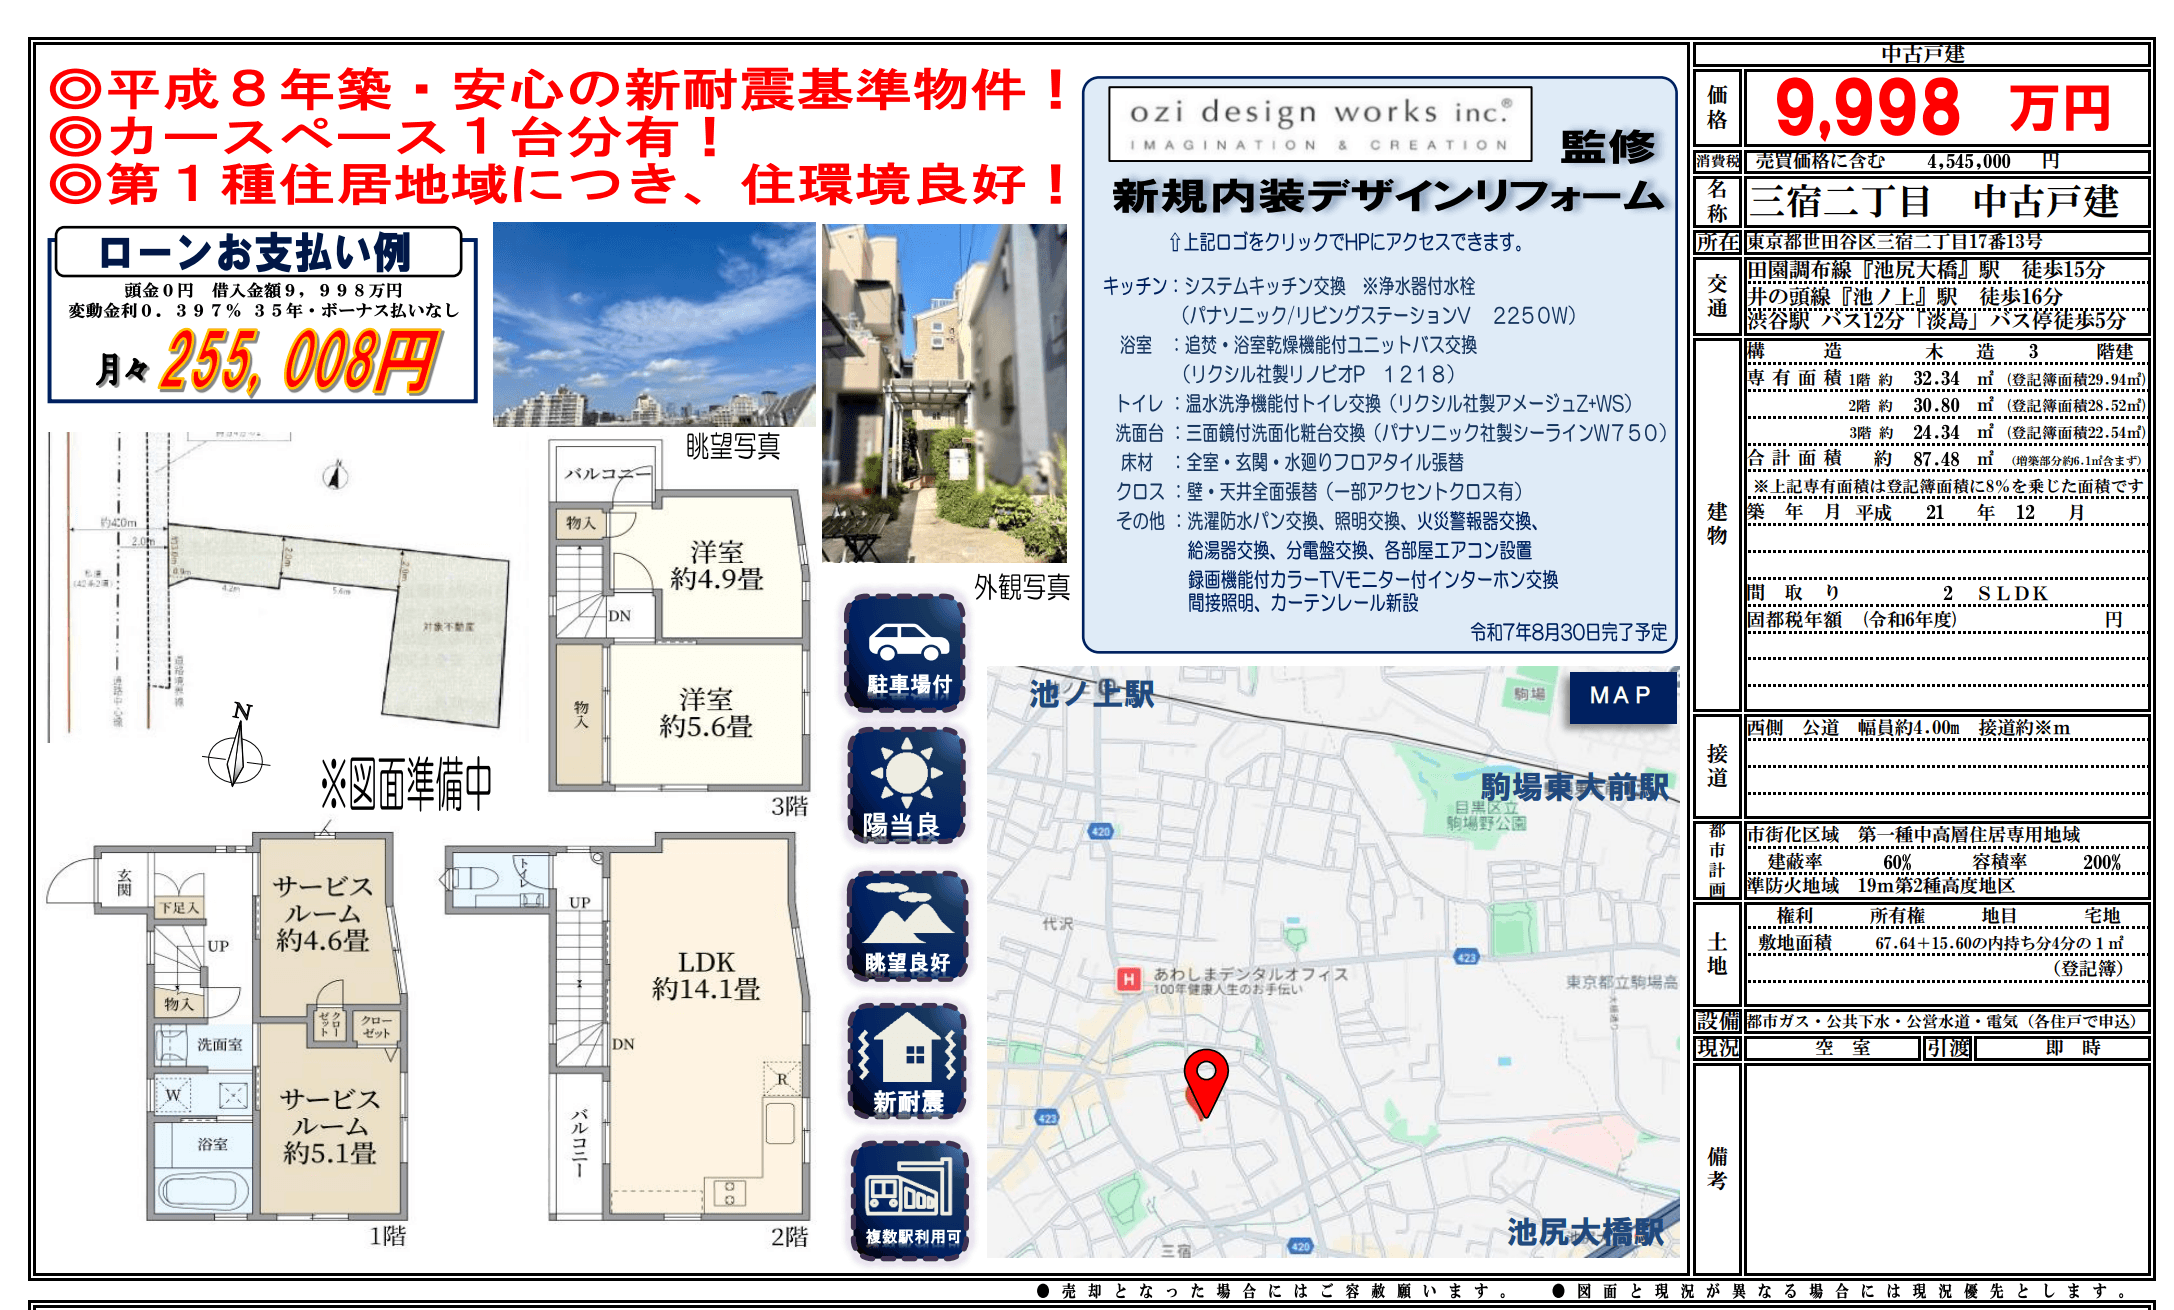
Find condominiums in Meguro, Tokyo
Individual listings, price-change history, closed transactions and AI valuations are available on a free account.