Words: 1371 | Estimated Reading Time: 7 minutes | Views: 29
Listings between 70 million and 200 million yen rose 50% to 100% in a year, while the pool of buyers who can afford them shrank
Tokyo Condo Market Watch (東京マンション相場ウォッチ) tracks Tokyo's resale condominium market at regular intervals using Urbalytics listing data.
As of October 25, 2026, 47.1% of resale condos on the market in Tokyo's 23 wards had cut their asking price in the previous three months, against 36.0% on the same date a year earlier. The first three articles looked at where cuts are happening and which kinds of units are cutting first. This one splits listings by asking price to see which price bands are cutting, and why.
The short answer: cuts are concentrated between 70 million and 200 million yen. Close to 60% of units priced 100 million to 200 million yen have cut, almost 20 points more than a year ago, while the share for units under 50 million yen rose only 2 to 3 points. In this band, listings have doubled while rising rates have pushed some buyers out.
The "price-cut share" is defined as before: the share of resale condos with a listing record in the last three months whose asking price fell below its previous record. It counts how many listings were cut, not how far market prices have fallen.
Cuts concentrate between 70 and 200 million yen; under 50 million, almost no change in a year
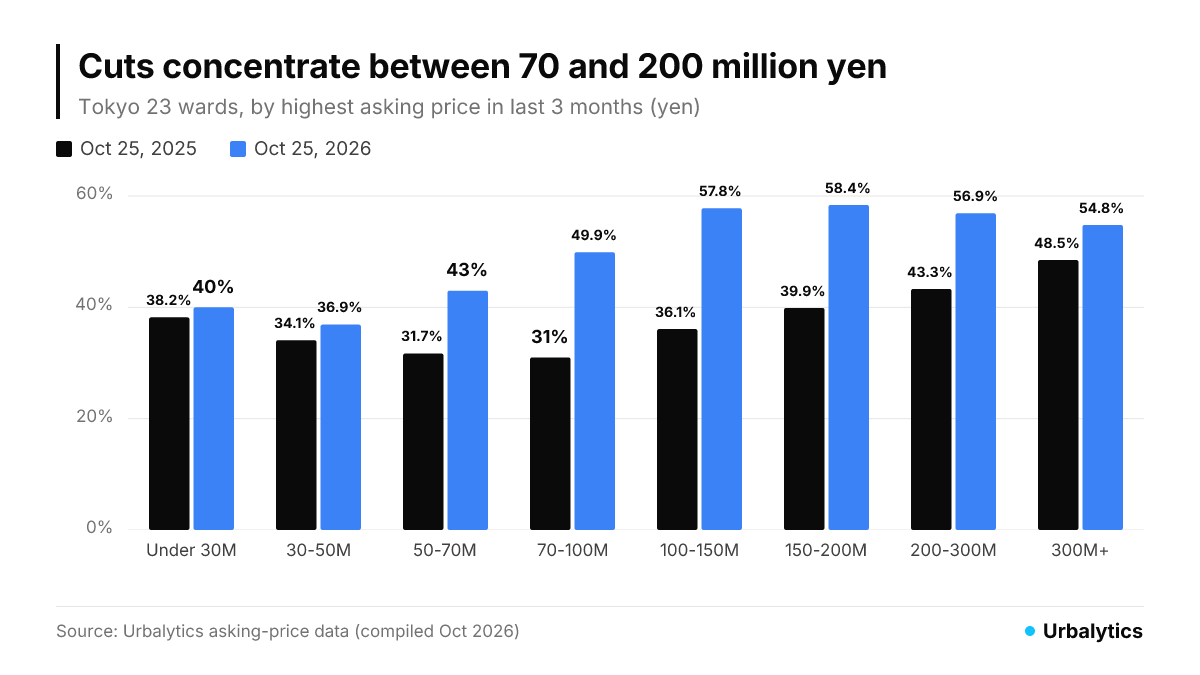
A year ago, every price band had a price-cut share between 30% and 50%, with little difference between them. Now, 70 to 100 million yen has risen from 31.0% to 49.9%, 100 to 150 million from 36.1% to 57.8%, and 150 to 200 million from 39.9% to 58.4%, each up nearly 20 points. The ends moved little: under 30 million rose from 38.2% to 40.0% and 30 to 50 million from 34.1% to 36.9%, only 2 to 3 points, while 300 million and above rose from 48.5% to 54.8%, about 6 points.
Reason 1: around 100 million yen is the ceiling for salaried households, and rising rates hit it first
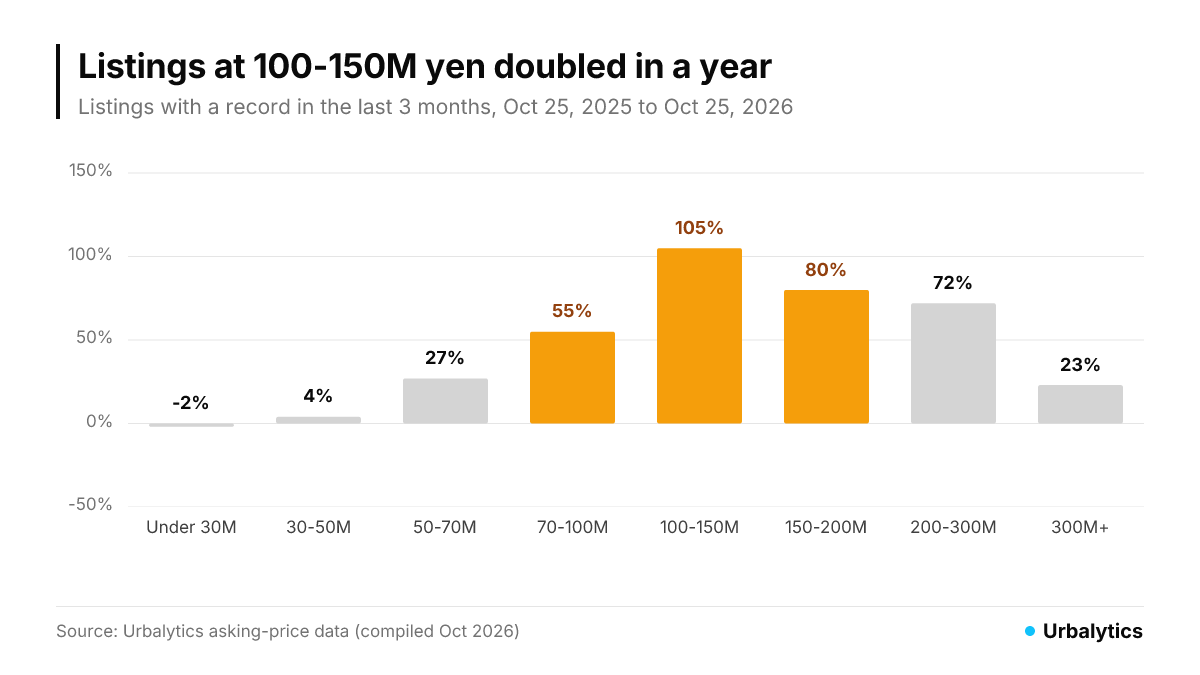
Start with sellers. Listings at 100 to 150 million yen doubled in a year, from 2,437 to 5,001. Listings at 150 to 200 million rose 80% and at 70 to 100 million rose 55%. Below 50 million there was almost no change: under 30 million fell 2% and 30 to 50 million rose 4%.
Now buyers. For most salaried workers, the most they can borrow on a mortgage is in the low 100 millions of yen. Units above 100 million yen generally require a household income of 20 million yen or more, or a large down payment. Buyers in this band are high-earning dual-income households already near their borrowing limit.
Rising rates hit them first. Assuming a 100-million-yen loan over 35 years with equal payments and annual repayments capped at 25% of income, the household income required is about 12.46 million yen at 0.5% and about 13.55 million yen at 1.0%. A rise of just 0.5 points adds about 1.09 million yen to the income needed for the same unit. The Bank of Japan's policy rate reached around 1% in early 2026, and major banks raised mortgage rates accordingly, right around this group's limit.
With twice as many sellers and fewer buyers who can afford them, it is natural that the price-cut share rose fastest here. Market analysis from the Mitsui Fudosan group also notes that resale inventory in Tokyo's three central wards has been rising since July 2024, mainly among units above 100 million yen.
Reason 2: owners who gained from rising prices are listing at the same time
What is being listed in this band? Among listings at 100 to 150 million yen, 31.7% are in towers and 31.5% are in buildings up to 10 years old; at 150 to 200 million yen the shares are 48.6% and 39.7%. These are the "towers and new builds that led the rise" from our previous article.
Many of these owners bought five to ten years ago for 60 to 80 million yen and are now listing at more than 100 million yen, sitting on paper gains of tens of millions of yen. A LIFULL HOME'S survey of Tokyo-area condo sellers in July 2026 found that 71.0% sold above their purchase price and 47.0% made a profit of 10 million yen or more, up sharply from 36.3% the year before. The top reason for considering a sale was "rising property prices" (33.5%).
When owners looking to lock in gains list at the same time, competition in the same building and area grows while buyers are shrinking, so asking prices have to come down. This is an inference from the data and public surveys.
Why the two ends are stable: many buyers under 50 million, no mortgage needed above 300 million
Units under 50 million yen fall into two groups. Under 30 million, the median floor area is just 23.5 square meters: studios for single occupants or rentals, bought mainly by investors who price on yield. At 30 to 50 million, the median is 43.4 square meters, the core of owner-occupier demand from singles and small households. Both are within most buyers' borrowing capacity, so small rate rises matter less, and listings barely grew in a year.
When units under 30 million yen do cut, though, the cut is the deepest of any band, a median of 5.7% against 4.0% at 70 to 100 million. Small investment units are priced off yield, so when the numbers stop working, sellers have to cut in one step.
Above 300 million yen is a different story. In this band, 72.2% of listings are in the three central wards, and buyers are mostly wealthy individuals paying with cash or assets, so mortgage rates matter less. The price-cut share was already 48.5% a year ago, since negotiation is routine for luxury units; it rose only 6 points this year, and listings grew 23%, the smallest change among the high-price bands.
What this means for buyers and sellers
Buyers: Those with a budget of 70 million to 200 million yen have the most room to negotiate right now. Half to 60% of listings in this range cut within three months, and there are roughly twice as many listings at the same price as a year ago, so you can look widely and compare before making an offer.
Sellers: If your asking price is around 100 million yen, you face twice the competition and fewer buyers. Pricing off cuts in the same band over the last three months is more realistic than relying on sale prices from two or three years ago. Units under 50 million yen face the least pressure to cut.
Log in to Urbalytics to see more condo price history and transaction records
Methodology
Resale condominiums in Tokyo's 23 wards with a listing record in the 90 days to October 25, 2026 and to the same date a year earlier, October 25, 2025 (31,746 units in 2026). Price bands use each listing's highest asking price in the 90 days. Price cut = any asking price in those 90 days below the previous record. Cut size = the median of each listing's largest cut within the 90 days. Tower = a building whose highest listed unit is on the 20th floor or above (estimated from listing data). Required income assumes 35 years, equal payments and a 25% repayment ratio. All figures are asking prices, not transaction prices. Data: Urbalytics asking-price data, compiled October 2026.
Tags: Tokyo condo prices, 100 million yen condos, price cuts, Tokyo 23 wards, mortgage rates, Japan interest rates, household income, power couples, tower condos, buying property in Japan, Japan real estate investment, Urbalytics
References
Mitsui Fudosan Residential (MEC), "What will new condo prices do in 2026?" https://www.mecsumai.com/sumai/knowledge/2603-1/
FinTech Journal, "Are power couples too optimistic? The worst-case scenario for condo buyers" https://www.sbbit.jp/article/fj/178984
Juen, "Power couples: income thresholds and how to buy a home" https://ju-yen.com/media/power-couple/
LIFULL HOME'S, "2026 survey of condo sellers" https://www.homes.co.jp/satei/media/entry/mansion_survey2026
Cover image: AI-generated illustration (Higgsfield)
Copyright: This article is original content by the author. Please do not reproduce, copy, or quote without permission. For usage requests, please contact the author or this site.