Words: 1802 | Estimated Reading Time: 10 minutes | Views: 45
The average price of a new detached home in Tokyo’s 23 wards returned to ¥133,580,000, but part of the jump reflected larger homes in that month’s sample. For investors, the more useful signals are year-on-year increases of about 10% in outer Tokyo and smaller detached homes—and rents that have not kept pace.
What happened in October: Tokyo passes ¥70,000,000 for the first time
Tokyo Kantei’s data for October 2026, released on November 9, put the average price of new detached homes in Greater Tokyo—wooden, freehold properties on plots of 100–300 m²—at ¥52,800,000, up 3.1% month on month and 10.0% year on year. Within Tokyo Metropolis, the average rose 6.2% month on month to ¥71,530,000, entering the ¥70,000,000 bracket for the first time since the series began in April 2014, and rising 24.2% year on year.
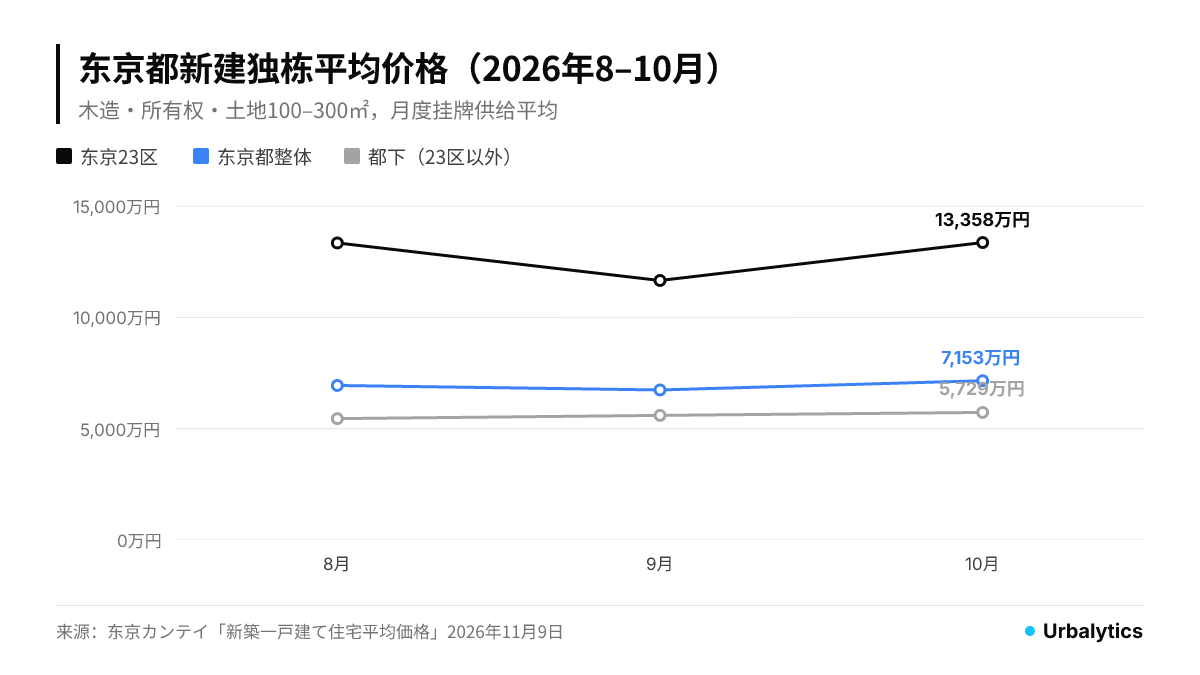
Within Tokyo, the average for the 23 wards was ¥133,580,000, a record high, up 14.6% month on month and 47.7% year on year. Outer Tokyo, outside the 23 wards, averaged ¥57,290,000, up 2.4% month on month and 9.4% year on year. Kanagawa averaged ¥54,670,000 and was the only market among Tokyo and its three neighboring prefectures to fall month on month. Chiba averaged ¥41,790,000 and Saitama ¥42,100,000.
Tokyo Kantei offered two explanations: high condominium prices have strengthened demand for detached homes, while Tokyo’s growing share of Greater Tokyo’s listed supply has pushed up the regional average. Fuji Television’s FNN report that day also cited the firm’s warning that rising interest rates would weaken purchasing power, a development that warrants continued monitoring.
How much of the 14.6% rise in the 23 wards reflects larger homes?
The 23-ward sample contains just 137 homes, so changes in the monthly mix can move the average sharply. In September, the 23 wards had recorded a 12.6% monthly decline to ¥116,540,000, compared with ¥133,410,000 in August. The “record high” in October was almost unchanged from August. It looks more like a rebound from the low in September than a market-wide increase of roughly fifteen percent in a single month.
Changes in average floor area support that reading. In the 23 wards, average floor area in October was 122.8 m², up 8.3% from 113.4 m² in September. Average plot size edged down from 117.9 m² to 117.0 m². Dividing Tokyo Kantei’s average price by its average floor area gives an increase from about ¥1,028,000 to ¥1,088,000 per m² of floor area, or roughly 6%—well below the 14.6% increase in total price.
The mix also affected Tokyo’s overall average. The number of homes rose from 663 to 734, increasing Tokyo’s share of Greater Tokyo’s supply from about 24.4% to 25.6%. Within that total, the 23 wards rose from 125 to 137 homes. A larger share of homes in expensive areas naturally lifts the average.
More consistent signals lie elsewhere. From August through October, outer Tokyo’s averages were ¥54,510,000, ¥55,960,000 and ¥57,290,000, rising gradually each month and gaining 9.4% year on year. For smaller new detached homes on plots under 100 m², Tokyo’s average was ¥82,920,000, up 2.0% month on month and 10.2% year on year, with average plot size virtually unchanged at 78.0 m². Both measures point to the same conclusion: an annual increase of about 10% in Tokyo’s new detached home prices is real, but the nearly 50% annual increase in the 23 wards should not be applied directly to valuations.
Existing detached homes offer a cautionary counterpoint. Tokyo’s average price, released the same day, was ¥70,220,000, down 13.0% month on month. Tokyo Kantei attributed this to a retreat after the previous month’s rebound and an older mix of properties. The opposite monthly movements in new and existing homes reinforce the need to read monthly averages alongside floor area and building age.
Have rents kept pace? Prices differ by about 2.3 times, rents by less than 1.8 times
If new detached home prices keep rising, investors buying houses to let need to know whether rents can keep pace. Using Urbalytics rental listings from the latest 24 months, we selected detached homes completed in 2015 or later, with floor areas of 80–140 m², within a 10 km radius of Shinjuku Station and, separately, Tachikawa Station.
Within 10 km of Shinjuku Station, 304 listings had a median monthly asking rent of ¥350,000, with median monthly asking rent per m² of about ¥3,630 and average floor area of 97.3 m². Within 10 km of Tachikawa Station, 180 listings had a median monthly asking rent of ¥199,500, or about ¥2,226 per m², with average floor area of 89.8 m².
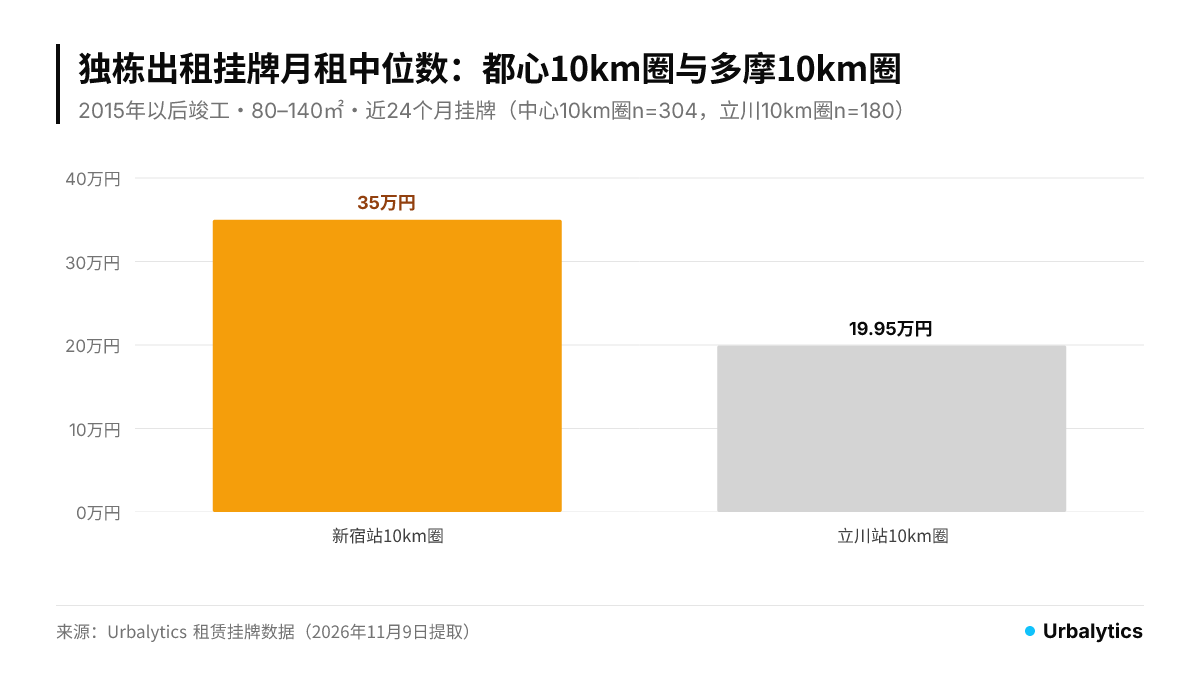
For comparison, Tokyo Kantei’s new detached home average for the 23 wards in October was about 2.3 times outer Tokyo’s average. The two rental samples above differed by about 1.75 times in median asking rent, or 1.6 times per m². Their geography and samples differ, so they cannot be combined to calculate a yield. Still, the direction is clear: closer to central Tokyo, the price premium for detached homes is much larger than the rent premium, leaving thinner rental returns.
Quarterly trends do not show rents catching up with prices either. From the first through the third quarter of 2026, average asking rents per tsubo—a Japanese floor-area unit—were ¥11,700, ¥12,700 and ¥12,500 within 10 km of Shinjuku, and ¥7,200, ¥7,600 and ¥7,400 within 10 km of Tachikawa. Both were broadly flat, with modest fluctuations. In the fourth quarter through November 9, the figures were ¥14,200 and ¥8,200, respectively. But with just 52 and 20 listings, it remains to be seen whether those levels hold at quarter-end.
Urbalytics Data Insight
Among detached rental homes completed in 2015 or later, monthly asking rent per m² in Tama’s 10 km catchment is about sixty percent of that in the central 10 km catchment. Yet new detached home prices are only a little over forty percent of those in the 23 wards. The price–rent gap is narrower on the Tama side—an important first comparison when choosing where to invest in detached rentals.
Detached-home and apartment developers compete for the same land
Tokyo Kantei’s new detached home survey covers plots of 100–300 m². In October, the average was 127.6 m² across Tokyo and 117.0 m² in the 23 wards. These are also common plot sizes for a wooden apartment building.
Urbalytics whole-building sales listings include 14 properties near Nerima Station completed in 2015 or later, with a median gross yield of 4.30% (lower to upper quartile: 4.08%–4.70%). Representative properties have plots of 147–269 m². Around Tachikawa Station, only 6 properties meet the same criteria, with a median gross yield of 5.13%—for reference only—and plots of 111–414 m². In both areas, apartment-building plots overlap substantially in size with the land detached-home developers seek.
One possible mechanism is that rising detached-home sale prices allow developers to bid more for 100–300 m² plots. Apartment developers would then have to pay more for the same land, limiting the scope for higher gross yields on new apartment-building listings. This remains an inference. Urbalytics data show only that new apartment-building gross yields in Nerima are just above 4%; they do not establish a causal link to land bidding.

How investors can use these findings
First, when valuing a detached home or a plot for one in Tokyo, use the annual increases of about 10% in outer Tokyo and smaller detached homes, alongside prices per m² of floor area, as benchmarks. Do not simply apply the monthly total-price increase in the 23 wards. Next month, watch first for a decline in the number of homes and average floor area in the 23 wards.
Second, new detached homes in central Tokyo carry a much larger price premium than rent premium. Before buying, work backward from realistically attainable rent to a supportable price for each property. Tama’s narrower price–rent gap makes the economics of detached rentals easier to balance.
Third, when selling apartment-building land or an older apartment building, detached-home developers are credible potential buyers who can support land values. Conversely, investors developing or buying a new apartment building in residential areas such as Nerima need to accept that gross yields just above 4% are unlikely to rise substantially in the near term. Tokyo Kantei is itself watching how rising interest rates affect purchasing power. If detached-home sale prices stop rising, competition for land will be the first to ease.
For whole-building yields and price trends by area, see the Urbalytics Tokyo Market Report, as well as the Nerima Ward Whole-Building Yields and Prices and Tachikawa City Whole-Building Yields and Prices pages. For how the same price adjustment is playing out in condominiums, see Central Tokyo Resale Condominium Price Adjustment Analysis; for the relationship between rental-building yields and prices in the 23 wards, see Investment Condominium and Rental-Building Prices in Tokyo’s 23 Wards.
Data notes
New detached home prices come from Tokyo Kantei’s “Average Prices of New Detached Homes.” They are average asking prices for homes offered that month, limited to wooden, freehold properties on plots of 100–300 m². The smaller-home series covers equivalent properties on plots under 100 m². This article calculates prices per m² of floor area and shares of listed supply from the published average prices, average areas and property counts. Rents come from detached-home rental listings collected by Urbalytics, including REINS and other sources. They are monthly asking rents excluding management fees, not achieved rents. Quarterly trends are averages of changing property mixes, not rent changes for the same homes. Whole-building yields are gross yields calculated using asking prices. Annual rental income is the listed figure, based on assumed full occupancy or in-place leases as specified in each listing; it is not income after expenses. The Tachikawa sample contains only 6 properties and is provided for reference.
Cover image: Snow-covered roofs of wooden homes around Oshiage and Kyojima, Tokyo; for illustration only (Photo: taro ohtani / Unsplash)
#TokyoNewDetachedHomes #Tokyo23Wards #OuterTokyo #Tama #DetachedRentals #NewDetachedHomePrices #TokyoKantei #Nerima #Tachikawa #ApartmentBuildings #GrossYield #LandCompetition #JapanRealEstateInvestment #Urbalytics
References
Tokyo Kantei, 2026, “October 2026: Greater Tokyo New Detached Home Average Price Up 3.1% to ¥52,800,000; Tokyo Reaches the ¥70,000,000 Bracket” https://www.kantei.ne.jp/report/single_family/9626/ (Detailed PDF: kodatesintiku202610.pdf)
Tokyo Kantei, 2026, “October 2026: Greater Tokyo Small New Detached Home Average Price Up 3.8% to ¥63,800,000; Tokyo Extends Its Rise” https://www.kantei.ne.jp/report/single_family/9631/
Tokyo Kantei, 2026, “October 2026: Greater Tokyo Existing Detached Home Average Price Down 6.5% to ¥41,870,000, the First Decline in 3 Months” https://www.kantei.ne.jp/report/single_family/9628/
FNN Prime Online (republished by Yahoo! News), 2026, “Tokyo’s Average New Detached Home Price Exceeds ¥70,000,000 for the First Time” https://news.yahoo.co.jp/articles/11db5c236df1fe69ebbc35bedc028134f20641e5
Copyright: This article is original content by the author. Please do not reproduce, copy, or quote without permission. For usage requests, please contact the author or this site.