Words: 1998 | Estimated Reading Time: 10 minutes | Views: 29
Rents on tenant turnover rose 22% in Tokyo’s 23 wards, while renewal rents rose 5.3%. Yet new borrowing rates are already more than triple those on repaid debt. For individual landlords, protecting the spread depends on NOI at purchase and the cost of tenant turnover.
What residential REIT results reveal: rents are rising in Tokyo’s 23 wards, but interest costs are rising faster
On November 8, Rakumachi News compared low-yield central-city properties with higher-yield regional properties using the latest results from 5 listed residential REITs: Advance Residence (ADR), Comforia, Nippon Accommodations Fund, Samty Residential and Starts Proceed. Its conclusion: rents are rising, but financing costs are rising faster, and REITs are also realizing unrealized gains through property sales to sustain distributions.
Many figures in the media report were calculated by its author. We therefore checked the key figures against ADR’s results presentation for the period ended July 2026 (February–July 2026), released on September 17. ADR reports rent changes across three regions: Tokyo’s 23 wards, the metropolitan area outside the 23 wards, and designated cities and other areas. Designated cities are a Japanese municipal classification. ADR also acquired several apartment buildings in Tokyo and its three neighboring prefectures during the period, making its portfolio a useful comparison for buildings owned by individual investors.
Rents rise 22% on tenant turnover and 5.3% at renewal: gains concentrated in the 23 wards
Tenant turnover means signing a lease with a new tenant after the previous tenant leaves. Across ADR’s portfolio, rents on tenant turnover changed by +18.7%: +22.0% in Tokyo’s 23 wards, +18.4% in the metropolitan area outside the 23 wards and +8.3% in designated cities and other areas. The figures for the 23 wards over the past three reporting periods were +20.0%, +18.0% and +22.0%, so this was not an isolated result.
Rent increases at renewal were much smaller: +4.4% across the portfolio, +5.3% in the 23 wards, +4.2% in the metropolitan area and +1.7% in designated cities and other areas. A total of 3,635 leases came up for renewal during the period. ADR proposed rent increases on 80.6% of them, with an acceptance rate of 74.3%.
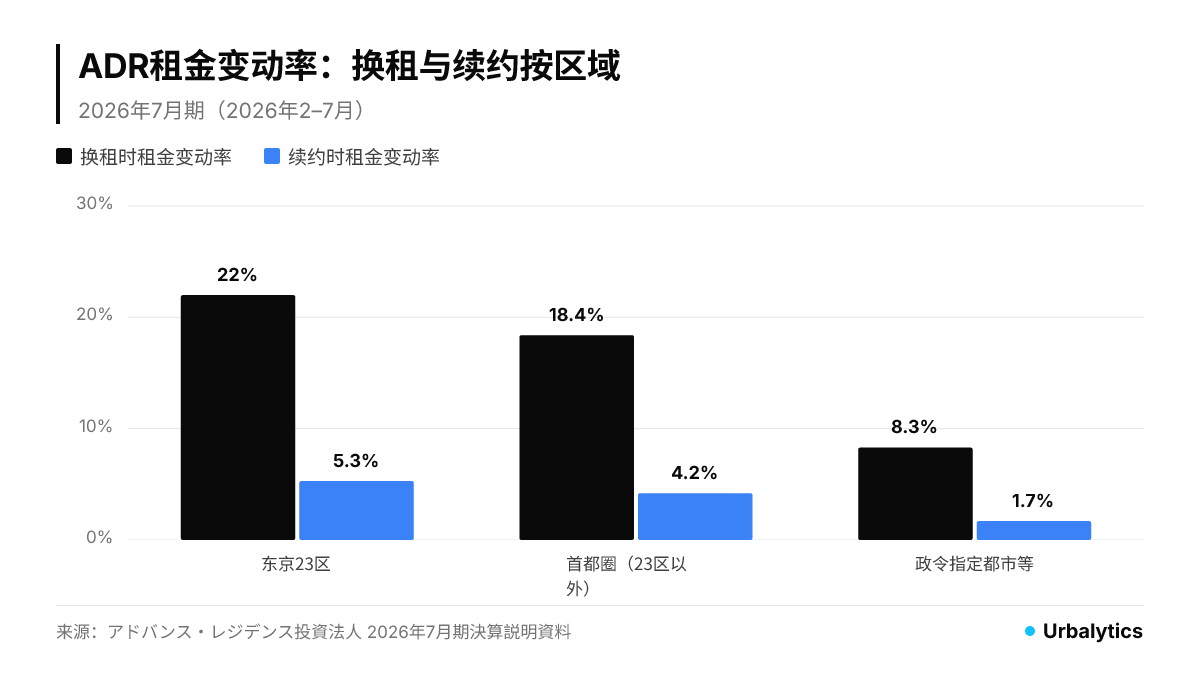
Together, these figures indicate a substantial gap between rents under in-place leases and market rents in the 23 wards: new tenants are willing to pay roughly twenty percent more for the same apartment. That gap can be captured at only two points—largely when a tenant leaves, and to a smaller extent at renewal.
The constraint is that relatively few apartments change tenants. According to the Rakumachi article, roughly one in ten did so over the half-year, meaning average rents across all units, including occupied apartments, rise only gradually. A 22% increase on tenant turnover does not mean a 22% increase in the building’s total income.
New borrowing costs 2.12%—more than triple the rate on repaid loans
During the same period, ADR borrowed ¥24.8 billion at an average interest rate of 2.12% and an average term of 6.5 years. The ¥17.6 billion of debt it repaid carried an average rate of just 0.64%. The average rate on all outstanding borrowing at period-end was still 0.94%, because debt taken out during the low-rate era had not yet been fully repaid. Its average remaining term was 4.3 years. Each refinancing over the coming years will bring borrowing rates closer to levels above 2%.
Rakumachi’s review of the five REITs found that interest and financing fees rose by ten to thirty percent over the half-year, while NOI barely grew. Nippon Accommodations Fund’s earnings forecast assumes the Bank of Japan’s policy rate reaches 2.0% by summer 2027. These are REITs with credit ratings and access to multiple lenders. Individual investment-property loans generally come with tougher terms, so the same rise in rates leaves private landlords with an even thinner spread.

Can individual buyers get better value than REITs near the same station?
ADR’s acquisitions during the period offer a rare comparison. The apartment buildings at Shoin-jinja-mae, Tokiwadai, Musashi-Koyama and Yokohama Tobe had NOI yields based on acquisition price of, respectively, 3.7%, 3.9%, 3.8% and 4.1%, averaging 3.9%. These are the returns the REIT was willing to accept with new borrowing rates just above 2%.
We used Urbalytics to review whole-building rental property listings around these four stations over the past year. Musashi-Koyama had 25 buildings, with a median listed gross yield of 4.32%; Tokiwadai had 32, with a median of 5.33%; and Tobe had 21, with a median of 6.89%. Shoin-jinja-mae had only 5 buildings, with a median of 4.39%, so that figure is indicative only.
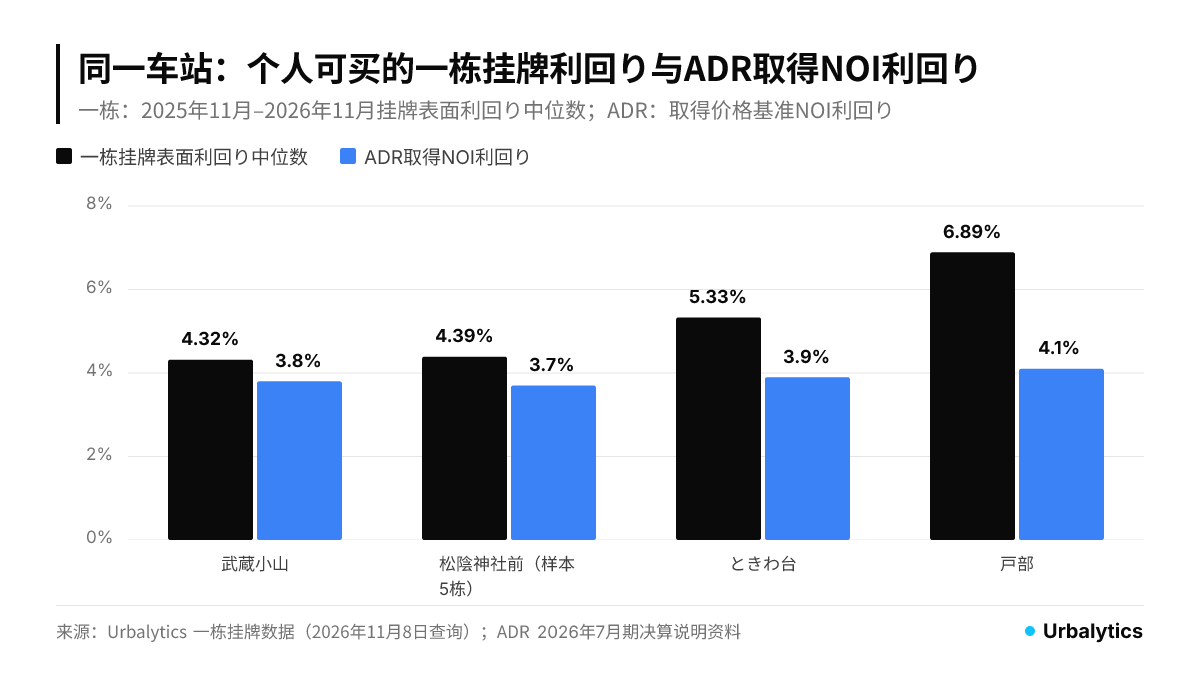
Gross yield is annual rental income divided by the asking price, before management fees, repairs, fixed-asset tax and vacancy losses. NOI deducts these costs, so the measures are not directly comparable. For a rough conversion, assume expenses and vacancy total 20% of rental income. Musashi-Koyama’s 4.32% gross yield would then imply an NOI yield of about 3.5%, below the 3.8% ADR accepted near the same station.
In other words, at stations within the 23 wards such as Musashi-Koyama, an individual buying at the median asking price would receive no higher an NOI yield than the REIT, while paying more for financing. Under the same assumption, Tokiwadai’s 5.33% converts to roughly 4.3%, leaving a little more room than ADR’s 3.9%. Tobe appears to have the highest median yield, but the median asking price for its 21 buildings was only ¥59 million. The lower quartile (P25) was 5.01%, and the upper quartile (P75) was 10.0%. These were mainly small, older buildings—not the same asset type as ADR’s apartment-block acquisitions.
Urbalytics data insights
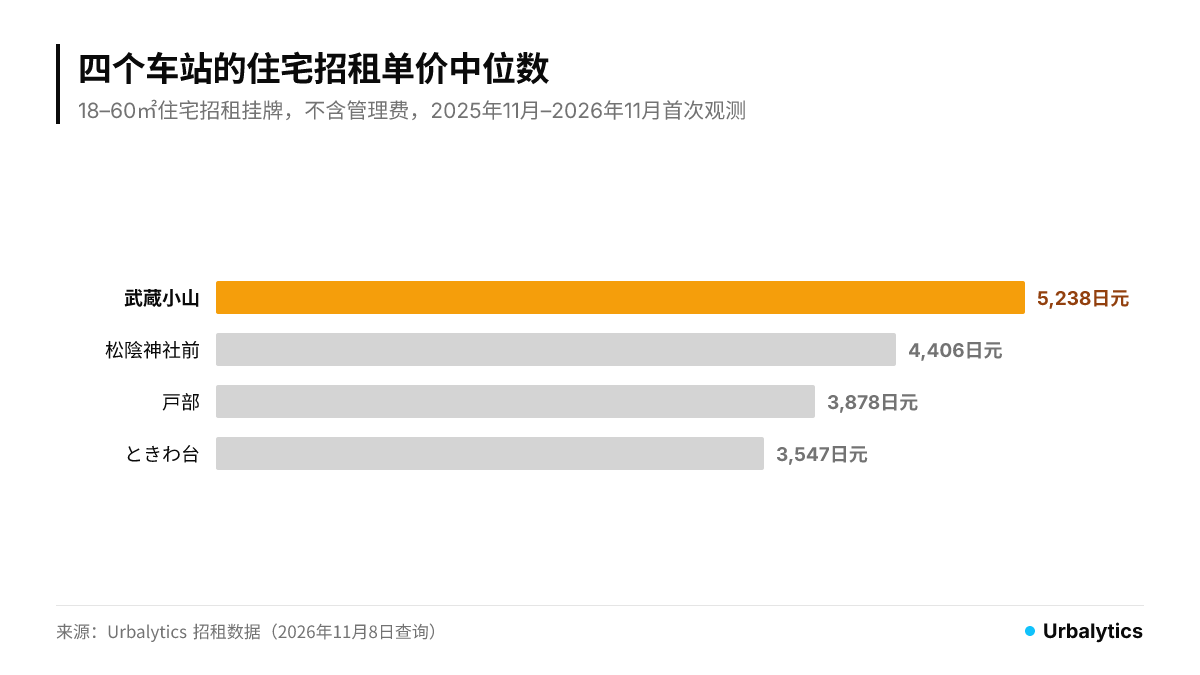
Urbalytics rental listings over the past year show the following median monthly asking rents per square meter for homes of 18–60 m², excluding management fees: Musashi-Koyama, ¥5,238 (686 listings; median monthly asking rent ¥159,000); Shoin-jinja-mae, ¥4,406 (133 listings); Tobe, ¥3,878 (222 listings); and Tokiwadai, ¥3,547 (385 listings).
Musashi-Koyama has the highest asking rent per square meter but the lowest listed whole-building gross yield: high local rents are already reflected in sale asking prices. Tokiwadai has the lowest asking rent per square meter, but offers more yield headroom.
For monthly changes in whole-building investment-property yields and prices by ward, see the Shinagawa Ward Whole-Building Investment Market Report and Itabashi Ward Whole-Building Investment Market Report. For the Tokyo-wide market, see the Tokyo Market Report.
What does tenant turnover cost, and how long does higher rent take to repay it?
A rent increase of roughly twenty percent on tenant turnover is not free. ADR’s letting costs during the period were equivalent to 1.50 months of rent. After deducting 0.54 months of key money received—a non-refundable payment from tenants—the net cost was 0.97 months. Average vacancy lasted 81.1 days, slightly longer than the 78.3 days a year earlier. This included vacancy caused by renovation work.
A simple calculation puts net letting costs at 0.97 months of rent, plus 81.1 days of vacancy, equivalent to roughly 2.7 months of rent. Total turnover costs therefore amount to about 3.6 months of the old rent. In the 23 wards, new rents are 22.0% higher, adding 0.22 times the old monthly rent each month. The payback period is roughly 16.5 months. In designated cities and other areas, where rents rose 8.3%, it takes about 44 months.
Standard residential leases in Japan generally run for two years. In the 23 wards, turnover costs can be recovered within one lease term, making a departure an opportunity to reset the rent to market levels. In designated cities, payback takes almost four years; if the tenant leaves after two, the turnover itself produces a loss. According to Rakumachi, ADR sold properties in Nagoya and Osaka, Comforia sold properties in Kansai, and Nippon Accommodations Fund sold properties in Fukuoka. The proceeds were used mainly to buy properties in Tokyo’s 23 wards.

What this means for rental-building owners and buyers in the 23 wards
For landlords who already own rental buildings in the 23 wards, the most direct step is to propose increases individually as leases renew. ADR’s experience shows average renewal increases of 5.3% in the 23 wards, accepted by most tenants and with almost no letting costs. Before making a proposal, compare your own rents with nearby asking rents per square meter. The larger the gap, the stronger the basis for an increase.
When a tenant leaves, do not relist at the old rent. In the 23 wards, new rents roughly twenty percent above previous rents are commonplace. Repricing to market levels can recover turnover costs in about a year and a half.
Selling is another route for REITs. ADR’s portfolio-wide unrealized gain ratio was 64.6%. It sold two properties during the period, realizing gains of approximately ¥1.01 billion. A substantial portion of returns on central-city properties comes from capital gains on sale, not just annual cash flow. We also found thin yields in our earlier articles, Average Investment Condo Prices and Whole-Building Rental Pricing in Tokyo’s 23 Wards and Rents and Yields Around Tokyo Midtown Nihonbashi.
Investors planning to buy an entire building in the 23 wards should first convert the listed gross yield to an NOI yield, then compare it with their own borrowing rate. In Musashi-Koyama, buying at the median asking price implies an NOI yield of about 3.5%. If financing costs exceed 2%, the spread is less than 1.5 percentage points—even narrower than ADR’s margin on its acquisition near the same station. At these prices, rent increases cannot make up for interest costs. Buyers must either negotiate a price that leaves sufficient room between the NOI yield and borrowing rate, or recognize that they are betting on capital gains at a future sale.
Data notes
ADR figures come from its results presentation and earnings release for the period ended July 2026, using ADR’s regional definitions. Some figures in the Rakumachi article on the five REITs’ financing costs, NOI and property sales were calculated by its author from company disclosures. Reporting definitions differ across companies, so these comparisons are indicative only.
Urbalytics whole-building data covers rental buildings with a listing or asking-price change recorded between November 8, 2025 and November 8, 2026, with duplicate listings across websites consolidated. Gross yield equals listed annual rental income divided by the asking price. Annual income may assume full occupancy; prices are asking prices, not transaction prices. Tokiwadai is limited to locations within Tokyo. Rental data covers residential listings of 18–60 m² first observed during the same period. Rents exclude management fees and are asking rents, not rents agreed in signed leases.
The 20% allowance for expenses and vacancy used to estimate NOI is an assumption in this article. Actual costs vary considerably by construction type, building age and management arrangements. Turnover payback calculations use ADR’s portfolio-wide average letting costs and vacancy duration. Actual vacancy periods in the 23 wards may be shorter. Renovation costs and taxes are excluded.
#ResidentialREITs #AdvanceResidence #Tokyo23Wards #RentalBuildings #GrossYield #NOI #RentGrowth #RenewalRentIncreases #BOJRateHikes #BorrowingRates #MusashiKoyama #Tokiwadai #JapanRealEstateInvestment #Urbalytics
References
Rakumachi News, 2026, Which Wins as Interest Rates Rise: Low-Yield Central-City Properties or High-Yield Regional Properties? Clues from Residential REIT Results
Advance Residence Investment Corporation, 2026, Results Presentation for the Period Ended July 2026
Advance Residence Investment Corporation, 2026, Earnings Release (REIT) for the Period Ended July 2026
Urbalytics, 2026, Shinagawa Ward Whole-Building Investment Market Report, Itabashi Ward Whole-Building Investment Market Report, Setagaya Ward Whole-Building Investment Market Report
Cover image: illustrative image (Photo: taro ohtani / Unsplash)
Copyright: This article is original content by the author. Please do not reproduce, copy, or quote without permission. For usage requests, please contact the author or this site.