Words: 1928 | Estimated Reading Time: 10 minutes | Views: 38
At a glance: Resale condos are taking longer to sell near Keio Line stations skipped by limited-express trains. Yet Urbalytics listing data show no across-the-board discount in asking rents. Purchase prices make the real difference: whole-building gross yields in Sakurajosui and Kokuryo exceed those at nearby limited-express stops, while the Roka-koen area offers no such discount.
On November 11, Money Post WEB published the Keio Railway edition of its “at-risk stations” ranking. Produced with real-estate data company Estate Technologies, the ranking measures median days on market for resale condos around stations across Greater Tokyo, using listings presumed sold or withdrawn. Stations are ranked by the year-on-year increase in selling time. The expanded list of the worst 200 included 12 Keio Railway stations in Tokyo.
Housing commentator Yukio Sakurai offered this explanation in the report: resale condo sales tend to be slowing at stations on the Keio, Takao and Sagamihara lines that limited-express trains skip. These are typically quiet residential areas with less convenient transport than limited-express stops and few large retail facilities around the station. With plenty of listings to choose from, properties passed over by buyers take longer to sell. He also cautioned that limited-express stops are not immune: one ranked second from the bottom across Greater Tokyo.
The report addresses an owner-occupier's concern: how easily a home can be sold. Investors who own or plan to buy rental property face a different question: are rents also weaker around stations where sales take longer? If rents hold up while slower sales prompt price concessions, yields could become more attractive. We compare Urbalytics rental and whole-building sale listings across three groups, each pairing a Keio Line limited-express stop with nearby local stops.
What the report does—and does not—tell us
First, the metric needs clarification. “Days on market” measures the time from listing to delisting, which may reflect either a sale or a withdrawal. It therefore indicates liquidity, not necessarily falling prices. The report itself notes that longer selling periods do not necessarily mean price cuts. Individual station rankings and rates of deterioration are behind a paywall and are not cited here. The publicly available headline names Sakurajosui, Hamadayama and Hatsudai; the article also names the popular limited-express stops Meidaimae, Chitose-karasuyama and Chofu.
The wider backdrop is a price adjustment that is not moving uniformly. According to Tokyo Kantei data reported by Kyodo News, the average resale condo price in Tokyo's 23 wards in September 2026, standardized to 70 m², was JPY 126.29 million, down 0.4% month on month, the fourth consecutive monthly decline.
Greater Tokyo as a whole, however, averaged JPY 77.73 million that month, up 2.2% month on month. Tokyo Kantei expects a divergence between “declines within the 23 wards and increases outside the 23 wards.” The Keio Line crosses that boundary: Meidaimae, Sakurajosui and Roka-koen lie on the Setagaya or Suginami side, while Chofu and Kokuryo are in the Tama area.
Asking rents: no uniform discount at local stops
We selected three neighboring-station groups: Meidaimae, a limited-express stop closer to Shinjuku, versus Sakurajosui and Shimo-takaido; Chitose-karasuyama, a limited-express stop farther along the line, versus Roka-koen, Hachimanyama and Kami-kitazawa; and Chofu, a limited-express stop in Tama, versus Fuda, Kokuryo and Nishi-chofu. The filters were consistent: residential apartments of 20–80 m² within a 10-minute walk, using asking rents first listed over the past 12 months and comparing median rent per m².
The results fall into three patterns. The group closest to central Tokyo best fits the intuitive “limited-express premium”: Meidaimae recorded JPY 4,102/m² (313 listings), versus JPY 3,766/m² at Sakurajosui and Shimo-takaido (472 listings). Asking rents at the local stops were about 8% lower, with median monthly asking rents of JPY 129,000 and JPY 117,000, respectively.
The middle group shows the reverse. Chitose-karasuyama recorded JPY 3,423/m² (279 listings), while Roka-koen, Hachimanyama and Kami-kitazawa, which are closer to central Tokyo, recorded JPY 3,834/m² (604 listings), making the local stops about 12% more expensive. Average floor area was around 35 m² on both sides, so apartment size does not explain the gap.
In Tama, there was almost no difference: Chofu recorded JPY 2,913/m² (219 listings), versus JPY 2,900/m² at Fuda, Kokuryo and Nishi-chofu (205 listings). Chofu's concentration of shops around the station did not translate into a clear asking-rent premium per m².
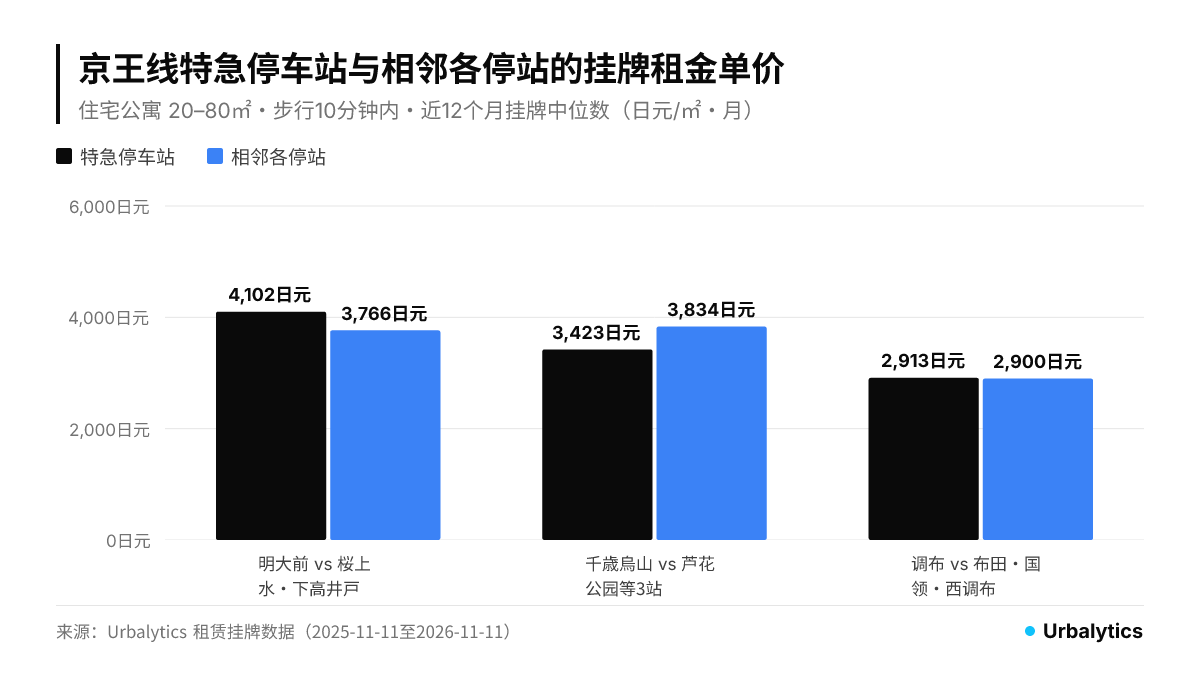
Taken together, asking rents per m² track distance from Shinjuku more closely than limited-express service. One possible explanation is that tenants pay monthly and can move away, so they focus on current commuting times and apartment condition. Owner-occupiers, by contrast, commit to a purchase costing tens of millions of yen and factor in a station's perceived resale appeal. At least in these three groups, slower sales have not translated into the same weakness in the rental market.
Purchase prices: whole-building gross yields reveal the gap
If asking rents differ little, how much do purchase prices differ? Gross yields on whole-building investment properties help answer that question by relating advertised annual rent to asking price. Median listed yields over the past 12 months were as follows: Meidaimae 4.30% (17 buildings), Sakurajosui 5.88% (13 buildings); Chitose-karasuyama 5.30% (25 buildings), Roka-koen 5.32% (10 buildings); Chofu 5.22% (13 buildings), Kokuryo 5.77% (14 buildings).
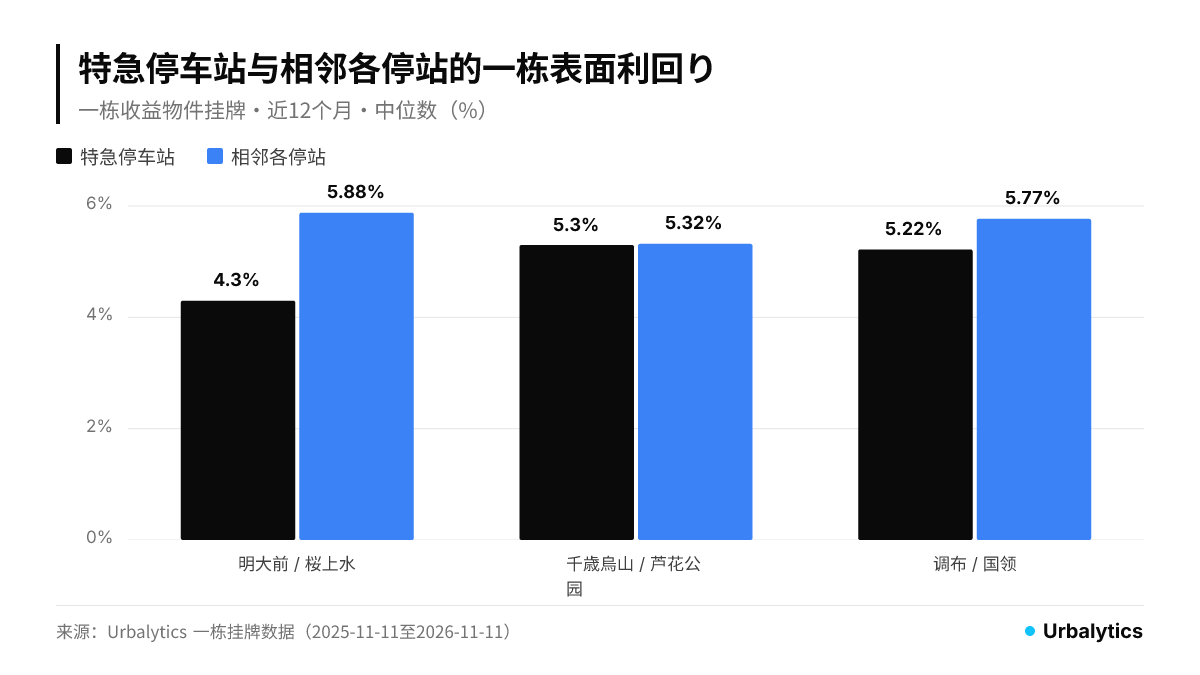
Reading these figures alongside asking rents clarifies the differences. In the inner group, Sakurajosui's asking rent per m² is only about 8% below Meidaimae's, but its whole-building gross yield is roughly 1.6 percentage points higher. That suggests a substantially larger discount in purchase prices than in rents. However, Sakurajosui's sample is widely dispersed: the middle half of properties falls between 4.98% and 9.00%, so the median is only a directional guide.
In the middle group, Roka-koen has higher asking rents than Chitose-karasuyama but almost the same gross yield. Buyers receive no discount simply because limited-express trains do not stop there. In Tama, Kokuryo and Chofu have the same asking rents, but Kokuryo's gross yield is about 0.55 percentage points higher. Its median asking price of JPY 88.95 million is also below Chofu's JPY 106.6 million.
Importantly, whole-building yields and resale condo selling times describe different markets. Buyers in the former are almost all investors; the latter is dominated by owner-occupiers. We use whole-building data as a benchmark for prices relative to rents within the same station catchment, not as evidence of transaction yields for individually owned condo units.
Why sales are slowing: prices had already risen sharply
Selling times have lengthened not after a price slump, but after a rapid rise. Urbalytics market reports show that the median asking price per m² of floor area for individually owned condos in Setagaya was, in October 2026, JPY 1,176,000/m², versus JPY 1,003,000/m² a year earlier. In Chofu, it rose from JPY 629,000 to JPY 795,000/m². During the same broader period, in August 2026, 383 individually owned condos in Setagaya had asking-price cuts, with a median reduction of 3.7%. In Chofu, 62 units had cuts, with a median reduction of 3.6%.
In other words, asking prices per m² rose about 17% in Setagaya and 26% in Chofu over the year. Citing a Tokyo Kantei survey, Money Post WEB reported that, among 285 Greater Tokyo stations with new condo supply in 2025, 61.4% required a “benchmark annual household income” of at least JPY 10,000,000 to buy. At these price levels, owner-occupiers are more inclined to view more properties and negotiate, leaving listings on the market longer. For landlords, this means greater scope to negotiate on entry, but potentially a longer exit period when selling to an owner-occupier.
How to assess each station group
Sakurajosui and Shimo-takaido: asking rents are only slightly below Meidaimae's, while whole-building gross yields are substantially higher. This is the clearest example of purchase-price discounts exceeding rent discounts among the three groups. If your planned exit is a sale to another investor, the gap is worth considering. If you plan to sell to an owner-occupier, allow for a longer selling period in your exit assumptions. Check each building's yield calculation individually, as listed yields around this station vary widely.
Roka-koen, Hachimanyama and Kami-kitazawa: asking rents per m² exceed Chitose-karasuyama's, and purchase prices offer no discount either. Do not expect a bargain simply because limited-express trains skip these stops. The decision should instead rest on whether the individual property's rent is sustainable.
Fuda, Kokuryo and Nishi-chofu: asking rents are on a par with Chofu's, while Kokuryo offers higher whole-building gross yields and lower purchase prices. This is the most favorable group for income-focused buyers. The trade-off is a thinner pool of owner-occupier buyers, making an investor exit more likely, with bids determined by yield requirements.
In practice, when assessing a property near a Keio Line local stop, start with comparable properties around the neighboring limited-express stop. How large is the asking-rent gap per m², and how large is the price or yield gap? If the price discount exceeds the rent discount, the seller has already conceded something for the slower resale prospects. If the gaps are similar, slower sales are simply an uncompensated exit risk. Monthly rent and yield distributions for each station catchment can be tracked in the Setagaya Whole-Building Investment Property Market and Chofu Whole-Building Investment Property Market reports.
For a comparison of how local stops are being repriced, see our earlier article on the revaluation of Setagaya-Daita, a local-train stop; for price adjustments in central Tokyo's resale condo market, see our analysis of central Tokyo resale condo price adjustments.
Data notes
Rental data are asking rents collected by Urbalytics, excluding management fees, not rents agreed in signed leases. The sample covers residential apartments of 20–80 m² within a 10-minute walk, first observed between November 11, 2025 and November 11, 2026. No construction-year filter was applied. Differences in the mix of building ages and layouts around each station can affect asking rents per m².
Whole-building gross yields relate advertised annual rental income to asking prices. Annual income may assume full occupancy or reflect in-place leases; vacancy and operating expenses are not deducted. Samples are small in Roka-koen (10 buildings), Sakurajosui (13), Chofu (13) and Kokuryo (14), so results are indicative only. Days-on-market and ranking data come from Money Post WEB and Estate Technologies. This article does not use their paywalled content.
#KeioLine #KeioRailway #LimitedExpressStops #LocalStops #Sakurajosui #RokaKoen #Kokuryo #Chofu #Meidaimae #ChitoseKarasuyama #ResaleCondos #AskingRents #WholeBuildingGrossYields #Setagaya #Urbalytics
Sources
Money Post WEB, republished by Yahoo! News, 2026, “The Divide Across Keio Railway Lines: Inokashira Line Stations Remain Popular, While Resale Condos Take Longer to Sell at Stops Skipped by Limited-Express Trains on the Keio, Takao and Sagamihara Lines”: https://news.yahoo.co.jp/articles/4f33611fae35255e1b783350ba5efdc2b0f6e437
Money Post WEB, 2026, “Greater Tokyo's At-Risk Property Stations: 12 Keio Railway Stations Among the Worst 200 for Slowing Resale Condo Sales” (publicly available section): https://www.moneypost.jp/1462007
Kumamoto Nichinichi Shimbun (Kyodo News), 2026, “Resale Condo Prices in Tokyo's 23 Wards Fall for 4 Consecutive Months in September” (Tokyo Kantei data): https://kumanichi.com/articles/2049317
Urbalytics, 2026, Setagaya Individually Owned Condo Market Report: https://www.urbalytics.jp/market/area/tokyo/setagaya-ku/mansion
Urbalytics, 2026, Chofu Individually Owned Condo Market Report: https://www.urbalytics.jp/market/area/tokyo/chofu-shi/mansion
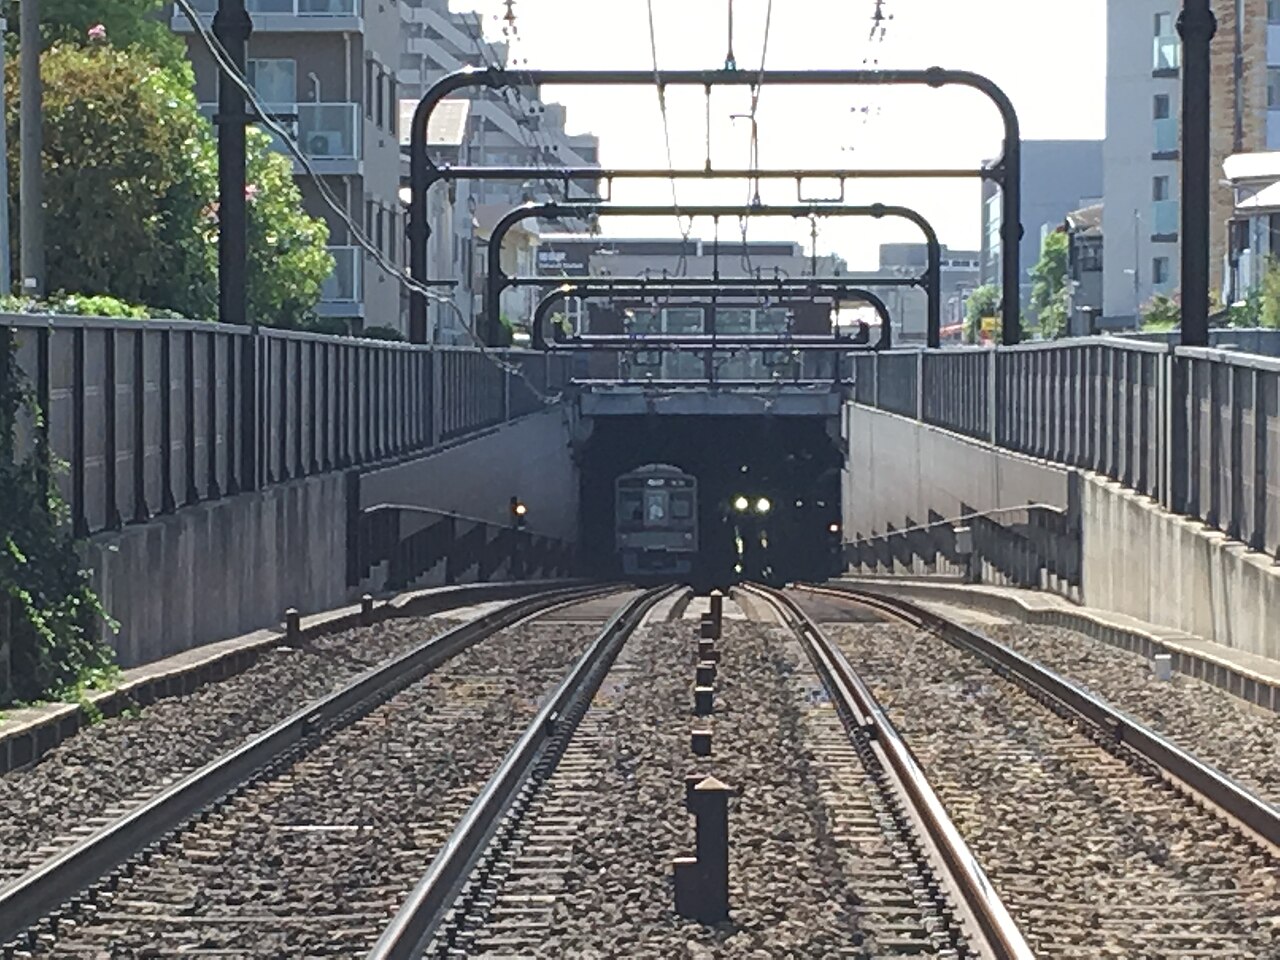
Cover image: the Keio Line near Kokuryo Station (Photo: 国立寺 / CC BY-SA 4.0, Wikimedia Commons)
Copyright: This article is original content by the author. Please do not reproduce, copy, or quote without permission. For usage requests, please contact the author or this site.