Words: 1467 | Estimated Reading Time: 8 minutes | Views: 54
October data released by the Real Estate Economic Institute on November 19 showed average new-condominium prices in Tokyo’s 23 wards falling 15.5% year on year. But investors should pay closer attention to another figure: the first-month contract rate across the 23 wards was just 32.9%, and the hardest homes to sell were not at the very top of the luxury market, but in the ¥100–200 million bracket.
October: launches fell, but contract rates fell faster
According to the Real Estate Economic Institute’s monthly survey, new condominiums launched for sale in Greater Tokyo—Tokyo and the three surrounding prefectures—in October 2026 totaled 998 units, down 24.2% year on year, marking a third consecutive month of double-digit declines. The average price was ¥93.08 million, down 5.9% year on year, while the price per square meter was ¥1,377,000, down 10.5%. Both measures fell for a third consecutive month.
The first-month contract rate was 48.3%, down 14.7 percentage points year on year and a further 2.1 percentage points from September. Inventory available for sale at month-end stood at 6,875 units, compared with 5,495 units at the end of October last year, and had risen every month since June. The institute expected approximately 1,500 units to launch in November, compared with 1,910 in November last year.
The sharpest changes were in Tokyo’s 23 wards. In October, 377 units launched across the 23 wards, at an average price of ¥129.37 million, down 15.5% year on year. The price per square meter was ¥1,944,000, down 23.0%. The first-month contract rate was 32.9%, down 37.9 percentage points year on year. In September, the 23 wards had recorded a contract rate of 46.0% and an average price of ¥139.4 million.
A lower average mainly reflects the mix of homes launched, not developer price cuts
To understand the fall in average prices across the 23 wards, start with what was offered for sale. In the central 6 wards—Chiyoda, Chuo, Minato, Shinjuku, Bunkyo and Shibuya—just 113 units launched in October, versus 248 a year earlier. Their average price was ¥183.94 million, compared with ¥226.26 million a year earlier, while the price per square meter was ¥2,766,000, versus ¥3,618,000.
Launches in the central wards, where prices per square meter are highest, fell by more than half, naturally pulling down the average across the 23 wards. Kyodo News likewise attributed the decline to high-priced properties not being launched. The monthly average measures projects launched that month; it does not track prices within the same project. These data therefore cannot establish that developers cut prices on individual projects. Reading the 15.5% decline as evidence that “new homes have become cheaper” overstates the actual change.
The more telling signal: ¥100–200 million homes are hardest to sell
Price-bracket data reveal more about where demand is weakening than the overall average does. Of the 377 units launched in the 23 wards in October, 234 were priced at ¥100 million or above, accounting for more than 60% of the total. Yet contract rates varied widely within this group.
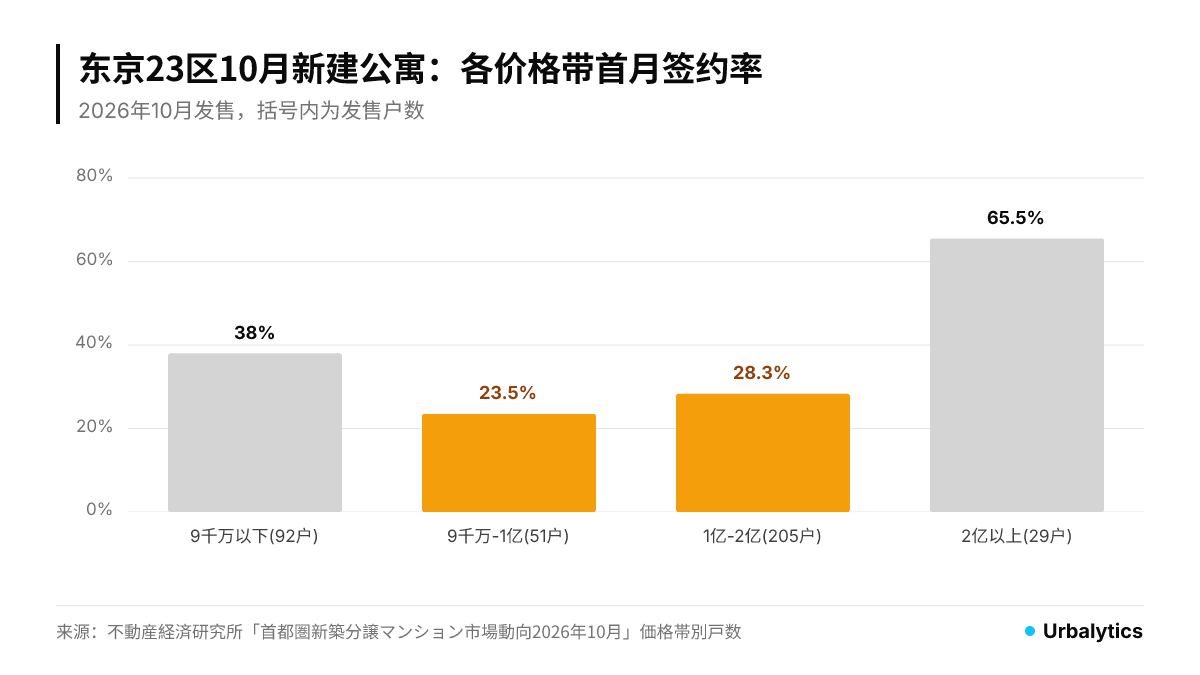
Of 29 units priced at ¥200 million or above, 19 went under contract, a contract rate of 65.5%; of 205 units priced at ¥100–200 million, only 58 went under contract, a rate of 28.3%; in the bracket above ¥90 million and below ¥100 million, 12 of 51 units went under contract, or 23.5%; at ¥90 million or below, 35 of 92 units went under contract, or 38.0%.
Top-end homes are still selling; the difficulty lies in the expensive-but-not-top-tier middle bracket. Buyers in this segment generally rely more on mortgages than those at the very top. Jiji Press and other media attributed the slowdown in demand to rising interest rates. That is a plausible explanation, but the monthly data do not include buyers’ financing arrangements. Subsequent mortgage-approval and contract data are needed to confirm it.
For investors, this divergence is more useful than the average price. If interest rates are the main cause, pressure would concentrate in mortgage-dependent price brackets, with less impact on the cash-heavy top end. Identifying the buyer pool for your property matters more than tracking the average across all 23 wards.
Resale market: asking prices per square meter are still rising, but more slowly
Has the slowdown in new-home contracts reached the resale market? Urbalytics’ Tokyo Market Report compiles asking prices per square meter for individually owned resale condominium units by ward. Weighting each ward’s median by its sample size across the 23 wards gives ¥1,245,000 per square meter in November 2025, rising to ¥1,431,000 per square meter.
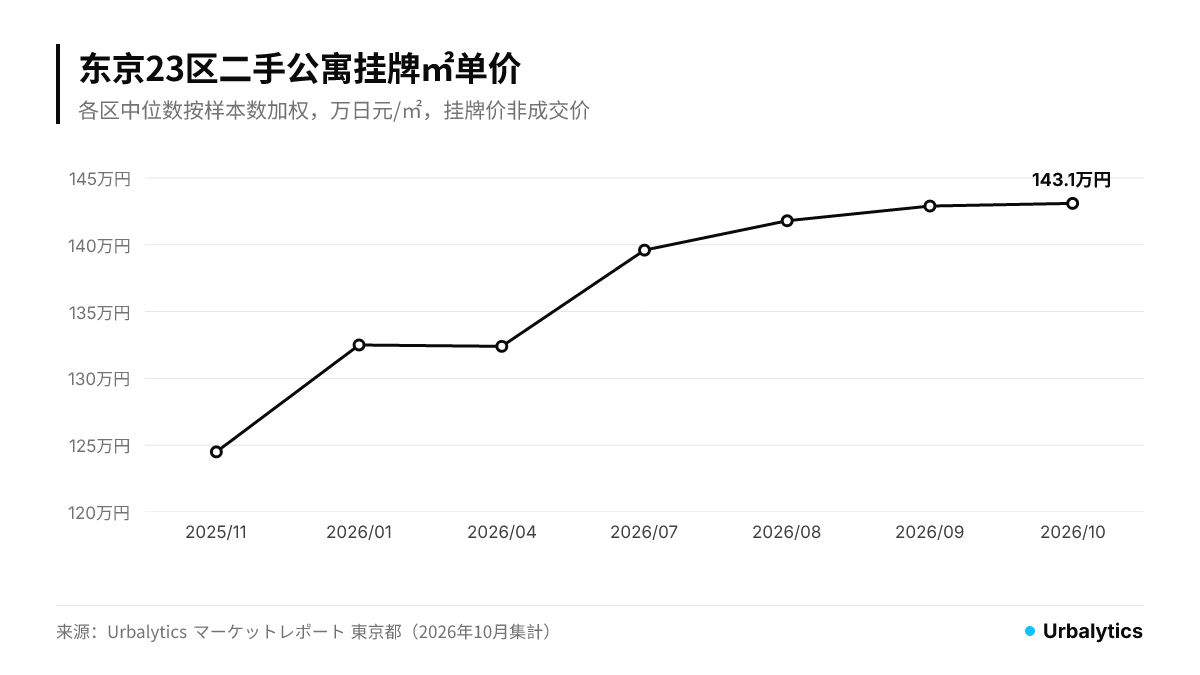
Recent monthly gains have become noticeably smaller: ¥1,396,000 in July, ¥1,418,000 in August, ¥1,429,000 in September and ¥1,431,000 in October. Asking prices reflect sellers’ expectations and often adjust later than transaction prices when demand weakens. Unchanged asking prices therefore do not mean the market is unchanged.
Price-reduction data offer another perspective. Urbalytics’ price-cut tracker shows that, across Tokyo in August 2026, asking prices were reduced on 6,778 resale condominiums, with a median reduction of 3.9%. Sellers are maintaining high initial asking prices while making gradual adjustments after listing—a pattern consistent with the decline in new-home contract rates.
The gap between new and resale homes remains substantial. In October, new condominiums in the 23 wards averaged ¥1,944,000 per square meter, versus a resale asking price of ¥1,431,000. The measures differ: new-home figures average projects launched that month, while resale figures are a weighted average of ward-level median asking prices. They indicate only a broad gap and should not be divided directly to calculate a discount.
How investors can use these data
Investors considering a ¥100–200 million condominium in the 23 wards may have more negotiating room than the headline average suggests. At new developments with low contract rates and inventory rising month after month, developers may be more willing to offer non-price concessions, such as parking, fit-out options or payment arrangements. For resale properties, use transaction prices for comparable properties as the benchmark, rather than nearby asking prices.
Owners in the same price bracket who plan to sell within a year or two should recognize that their buyer pool overlaps substantially with that of mid-tier new developments. With new-home inventory rising and resale asking-price growth slowing, pricing against listings from six months earlier may extend the time needed to sell. Test your asking price against recent transactions and price-reduction records before deciding when to sell.
Three developments warrant attention next: whether launches in November reach the institute’s forecast of approximately 1,500 units and whether the contract rate recovers above half; whether inventory continues to rise; and whether the fiscal 2027 tax reform outline announced in December includes higher taxes on short-term resales of new condominiums. This would directly affect demand from some investment buyers. For policy context, see the Analysis of the proposal to raise taxes on new condominiums resold within a year.
In the resale market, price adjustments for resale condominiums in Tokyo’s three central wards have already emerged; read that analysis alongside this article. Monthly asking prices per square meter and gross yields by ward are available in the Tokyo Market Report.
Data notes
New-home data come from the Real Estate Economic Institute’s monthly survey; contract rates refer to the first month of sales. Rates by price bracket are calculated from units launched and units contracted in the 23 wards in its “Unit Counts by Price Bracket” table. Resale data come from the Urbalytics Tokyo Market Report and represent a sample-size-weighted average of ward-level median asking prices per square meter, with outliers removed using the interquartile-range method. This is neither the overall median for the 23 wards nor a transaction-price measure. Price-reduction data cover all of Tokyo, not just the 23 wards.
#Tokyo23Wards #NewCondominiums #ContractRate #RealEstateEconomicInstitute #GreaterTokyoCondoMarket #Central6Wards #ResaleCondominiums #AskingPrices #CondoInventory #RisingInterestRates #JapanRealEstateInvestment #MarketData #Urbalytics
Sources
Real Estate Economic Institute, 2026, “Greater Tokyo New Condominium Market Trends, October 2026,” https://www.fudousankeizai.co.jp/share/mansion/693/g8GauCn1.pdf
Real Estate Economic Institute, 2026, “Greater Tokyo New Condominium Market Trends, September 2026,” https://www.fudousankeizai.co.jp/share/mansion/691/RtE7hi21.pdf
Jiji Press (Yahoo! News), 2026, “Central Tokyo New-Condo Prices Fall for the First Time in 4 Months in October; Fewer Launches and Rising Interest Rates Weigh,” https://news.yahoo.co.jp/articles/dfe1a79062bc1d8b9bd58be5e1211cdc27f4b710
Kyodo News (Yahoo! News), 2026, “Condo Prices in Tokyo’s 23 Wards Fall for the First Time in 4 Months; High-Priced Homes Not Launched in October,” https://news.yahoo.co.jp/articles/72a10177d82e3e8a75b479278ae7417993f81ece
Urbalytics, 2026, Tokyo Market Report (compiled in October 2026), https://www.urbalytics.jp/market/area/tokyo
Copyright: This article is original content by the author. Please do not reproduce, copy, or quote without permission. For usage requests, please contact the author or this site.