Words: 1381 | Estimated Reading Time: 7 minutes | Views: 21
In-migration data for Kiyose and Nagareyama helps rental owners sharpen leasing strategy: first identify movers already within the local living area, then test whether units match their budgets.
Author: Li | Data verified as of Oct 14, 2026
Where newcomers come from determines which homes your units compete with
Kiyose and Nagareyama feature in Greater Tokyo growth discussions, but investors must ask: which product type will these newcomers occupy, and can existing rental stock capture them.
On Oct 14, Rakumachi published an analysis reformatting 2025 inter-municipal migration by origins and destinations. It highlighted notable near-neighbor flows: Kiyose with Nerima Ward, and Nagareyama with Kashiwa City. The focus shifts from “how many came” to “where they came from.”
This matters directly for leasing. People already living nearby may be upsizing or relocating closer to family or work; when they compare options, their current home is the reference point. To make the shortlist, your building must articulate its convenience and price clearly for this segment.
The article uses domestic inter-municipal moves only; intra-municipal moves and overseas in-migration are excluded. It guides where to investigate but does not show how many choose to rent. Owner-occupiers, renters, and dependents moving with family create different demand profiles for rentals.
Accordingly, we use in-migration as a lens to define target renter segments, then test rents against station-area listing data. City-level population curves do not directly feed a rent-uplift thesis for a specific building.
Single-person households stand out in Nagareyama’s in-mover survey as well
Nagareyama attracts families with childcare and living environment, but treating all newcomers as family renters overlooks other demand.
The city’s in-mover questionnaire collected 821 responses between Feb 1 and May 31, 2025. By household status: single-person 500, families 275, 46 no answer. At least in this wave, single in-migration was notably active.
The survey covers a move-heavy season, and respondents are not the full-year cohort; it also lacks an own-versus-rent split. Owners can use it to test fit for single-occupancy units, but should not read response shares as citywide renter shares.
An origin-detail tabulation has 814 responses: 53 from Kashiwa, 51 from Matsudo. Neighboring inflows are visible, alongside farther origins. For existing rentals, it is more useful to have nearby brokers log where inquiries come from, what pain points exist in current housing, and what budget tenants hope to trade into for their next home.
Kiyose offers an age cue as well. In its 2026 revised comprehensive strategy, the city notes that the 25–29 population grew by roughly 15% over FY2020–FY2025. This supports ongoing monitoring of young renters’ needs; the city acknowledges multiple drivers and does not attribute all change to any single policy.
Both places require segmenting “young households.” First-time independents and households adding a bedroom have different size and total-rent requirements. If your building already has varied unit types, evaluate who each serves; there is no need to retrofit everything to match a city brand.
Both need new tenants, but the two stations imply different rent budgets
To judge whether a unit makes the shortlist, assess size and total rent against the active market. We queried Urbalytics for residential listings around Kiyose and Nagareyama-Otakanomori station catchments, using the same size and walk constraints to reduce obvious scope differences.
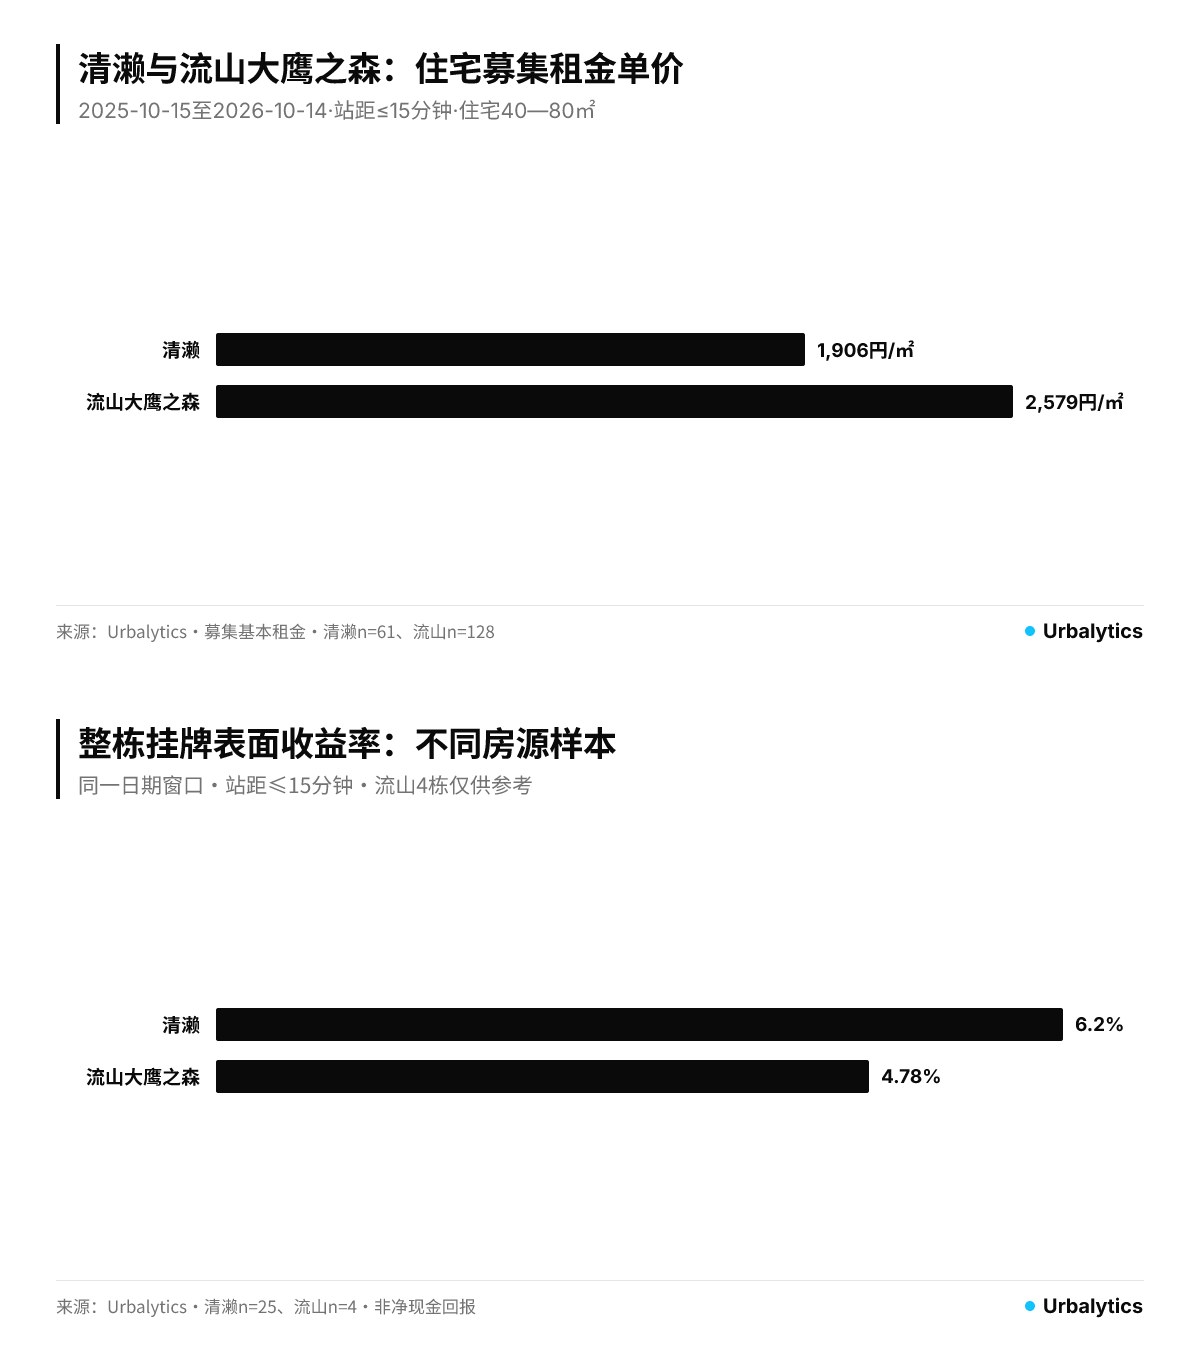
Median total asking rent in Kiyose is ¥106,000, and in Nagareyama-Otakanomori ¥141,000. Median base asking rent per square meter is about ¥1,906 and ¥2,579/month, respectively. Use unit price for like-for-like size comparisons; total rent better reflects monthly budgets. These medians are computed separately—do not divide one by the other to fabricate a “typical household.”
This cross-sectional reference does not standardize building age or amenities. It shows that the listed stock around the two stations is marketed under different conditions; it does not resolve whether gaps reflect city appeal versus asset mix, nor quantify any rent lift from the latest in-migration.
Whole-building listings add another lens via gross yield. In Kiyose, the median across 25 assets is 6.20%; around Nagareyama-Otakanomori there are only 4 assets, with a median of 4.78% (indicative only). Such a small sample in Nagareyama swings with individual assets and is not suitable for ranking the two locations.
Data readout: Kiyose — 61 residential listings; median total rent ¥106,000; median unit price ¥1,906/sqm/month. Whole-building listings 25; median gross yield 6.20%. Nagareyama-Otakanomori — 128 residential listings; median total rent ¥141,000; median unit price ¥2,579/sqm/month. Whole-building listings 4; median gross yield 4.78% (indicative only).
Method notes: first observed date window is 2025-10-15 to 2026-10-14 (UTC). Residential sample: MANSION category, LISTED status, 40–80 sqm, within 15 minutes’ walk; base rent excludes management fees and utilities. Statistics use the amounts currently saved for listings whose first-observed date falls in the window; not the then-prevailing price nor verified contracted rents.
Whole-building sample comprises independent assets with a listing or price-change record within the same window; same walk-time condition; no unit-size constraint; excludes closed deals and undisclosed appraisals. Station catchments may cross municipal borders; the Nagareyama sample includes Kashiwa addresses. Gross yield equals listed annual income divided by list price, before vacancy and operating expenses.
Ahead of the next leasing round, validate which mover segment your units can capture
Kiyose rentals should first check with nearby brokers on actual inquiries from younger tenants and near-neighbor movers. If you aim to capture more budget-sensitive tenants, benchmark total monthly rent against similar size and age stock, and include management fees to reflect the true burden. Active-market references inform pricing but cannot replace your own viewing feedback and signed leases.
At Nagareyama-Otakanomori, evaluate single and family unit types separately. For families, test commute and drop-off/pick-up routes; for singles, space usability and the daily path to the station may drive choice. Let existing-tenant input and leasing feedback guide which upgrades matter—do not infer from city branding alone.
For whole-building acquisitions, underwriting should still build up from each unit’s current lease, vacant unit mix, and capex plan. Residential unit pricing and whole-building gross yields come from different samples; combining them to back into a price produces numbers with no real asset behind them. The four Nagareyama observations are especially unfit as a citywide capitalization rate.
Going forward, track regional supply via the Tokyo Open Market Report; treat this article’s custom station-catchment samples separately from monthly citywide stats. Prior Kiyose area coverage and population and rent analysis along the TX (Tsukuba Express) corridor provide context; this note adds the link between in-migration sources and current listings, without chaining earlier figures into a trend line.
At the next Kiyose or Nagareyama vacancy, ask brokers to log each inquiry’s move purpose, desired size, and acceptable total rent, then compare with final lease terms. If “more space” and “similar budget” recur, prioritize which units in your building meet that pair; if inquiries skew to singles, align unit mix and marketing copy to those needs.
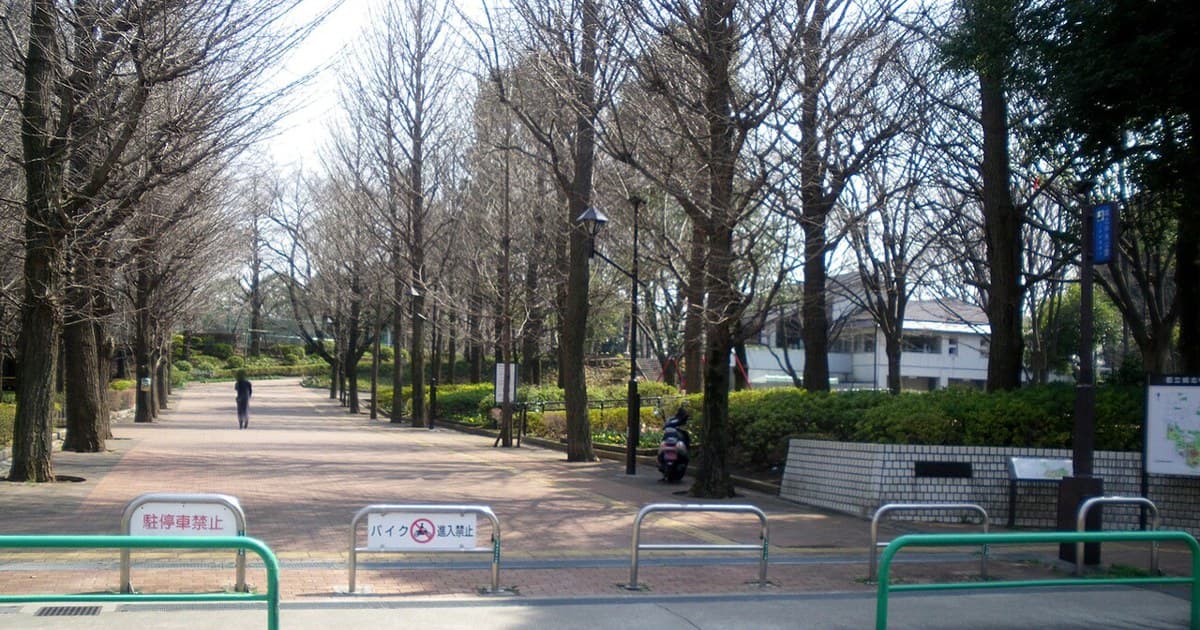
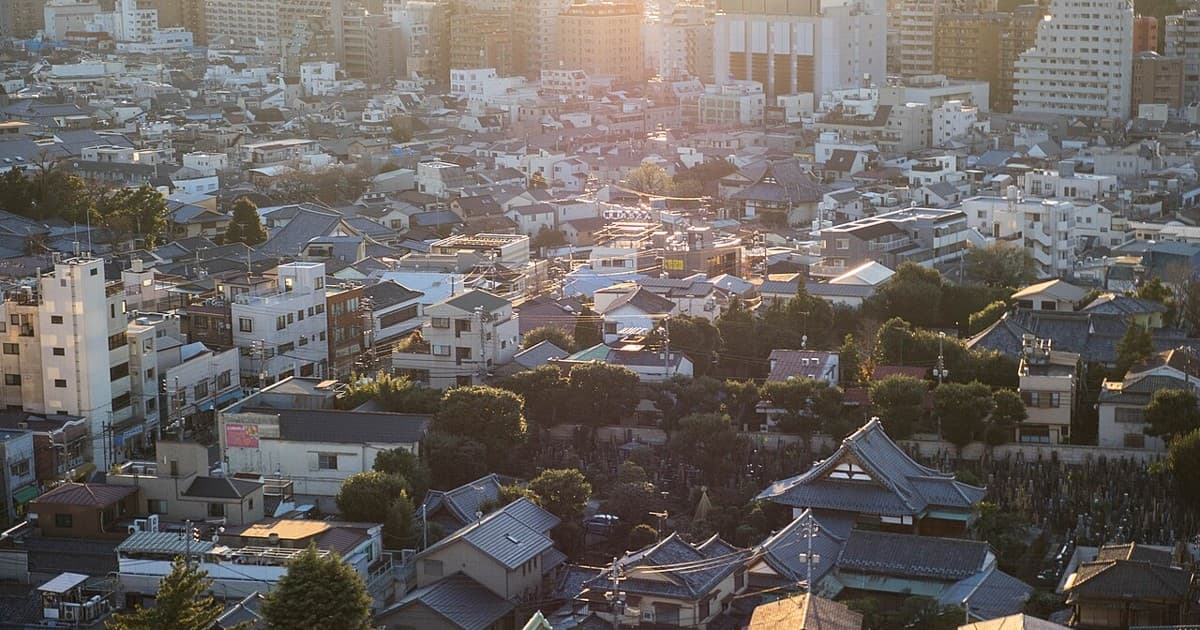
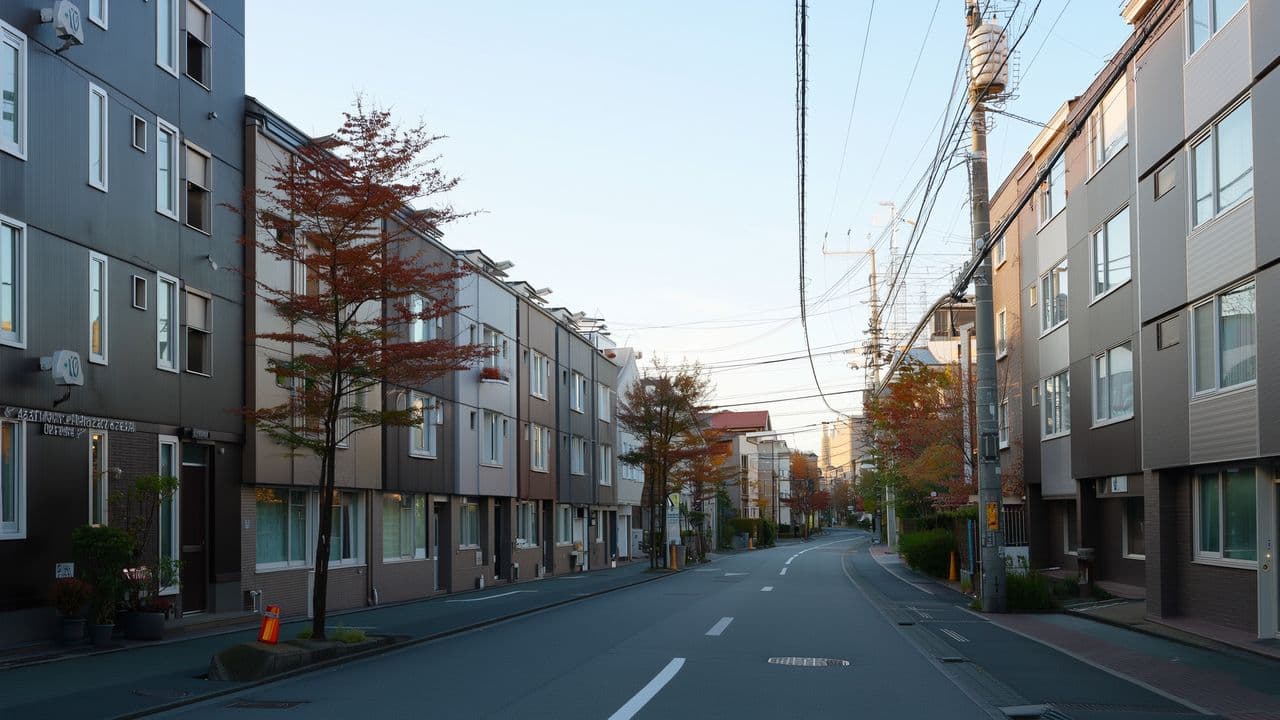
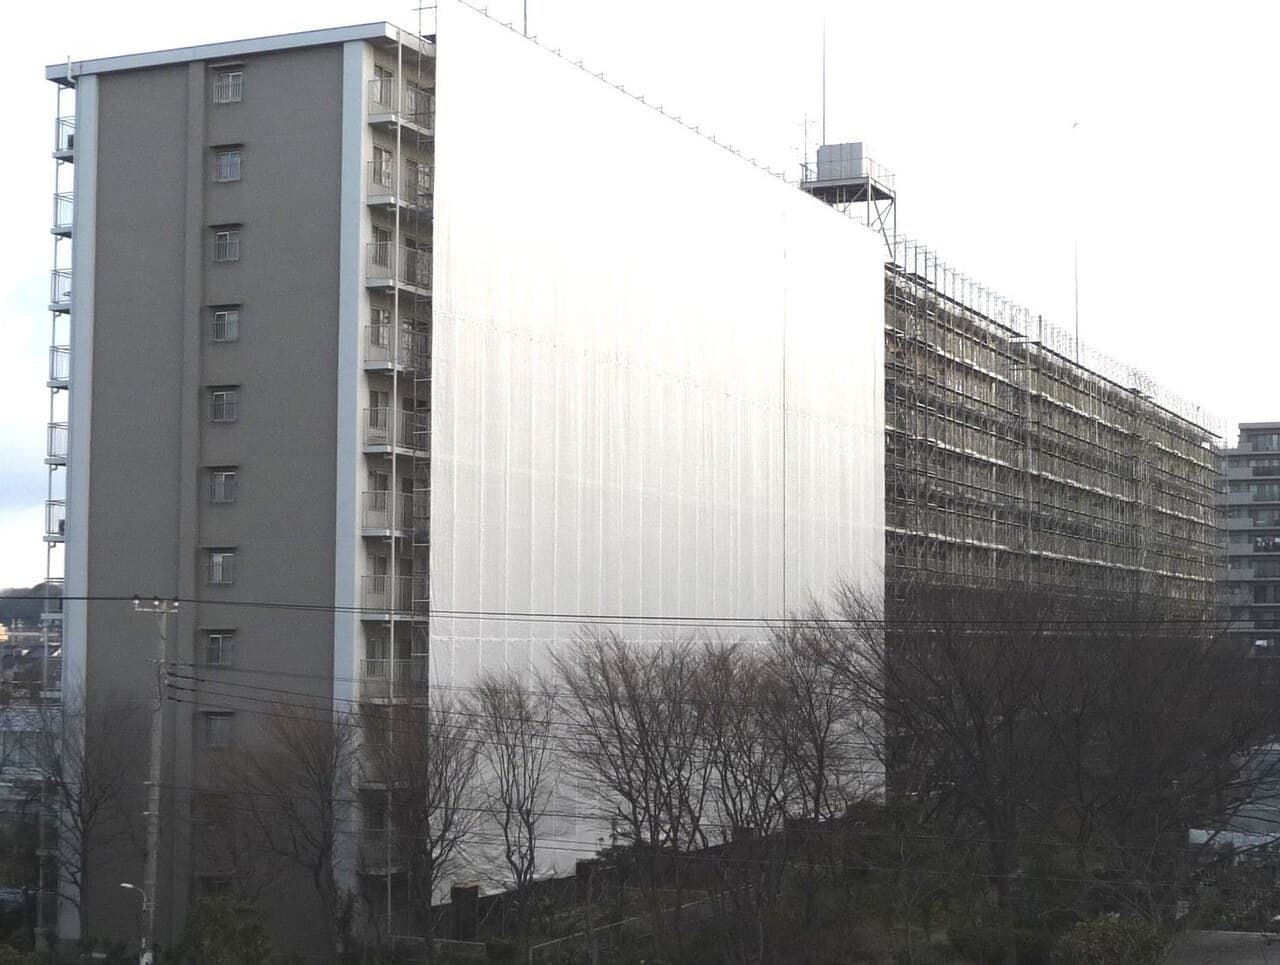
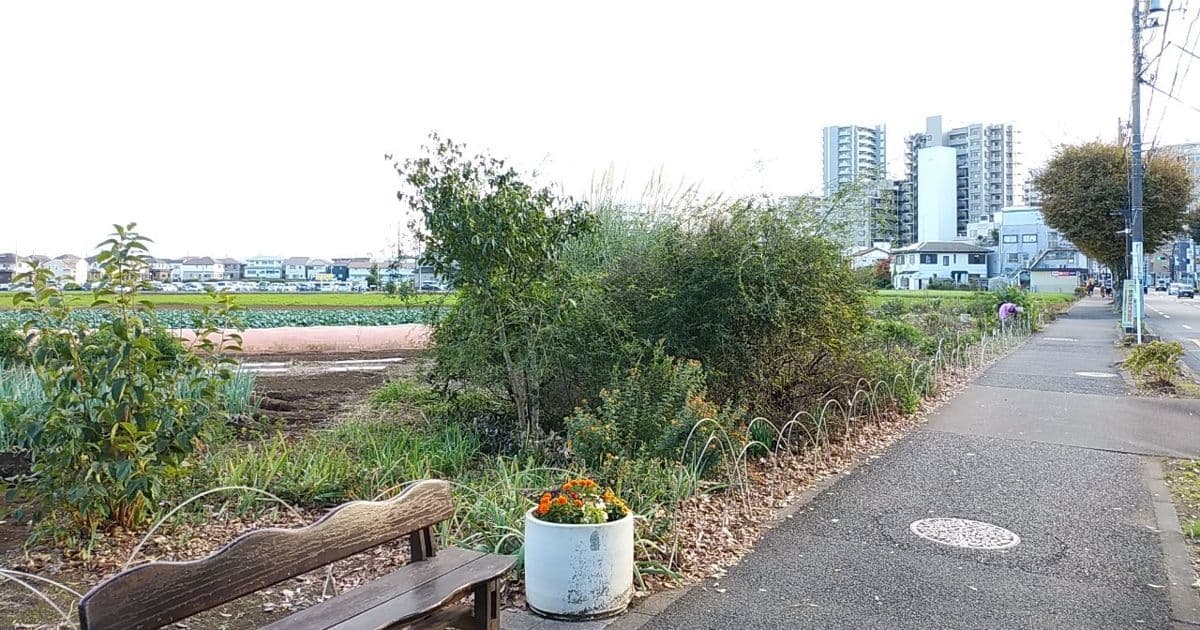
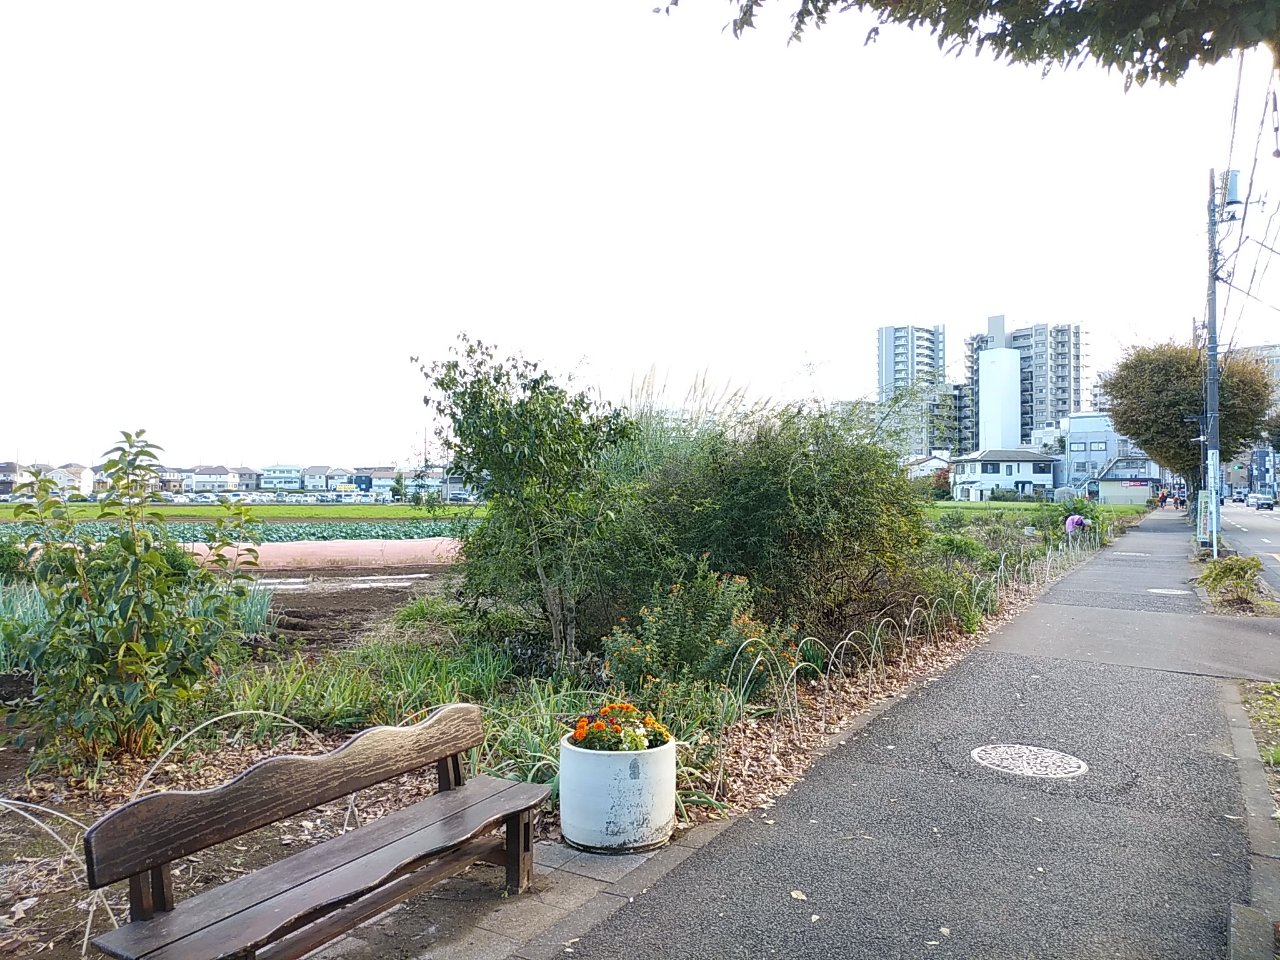
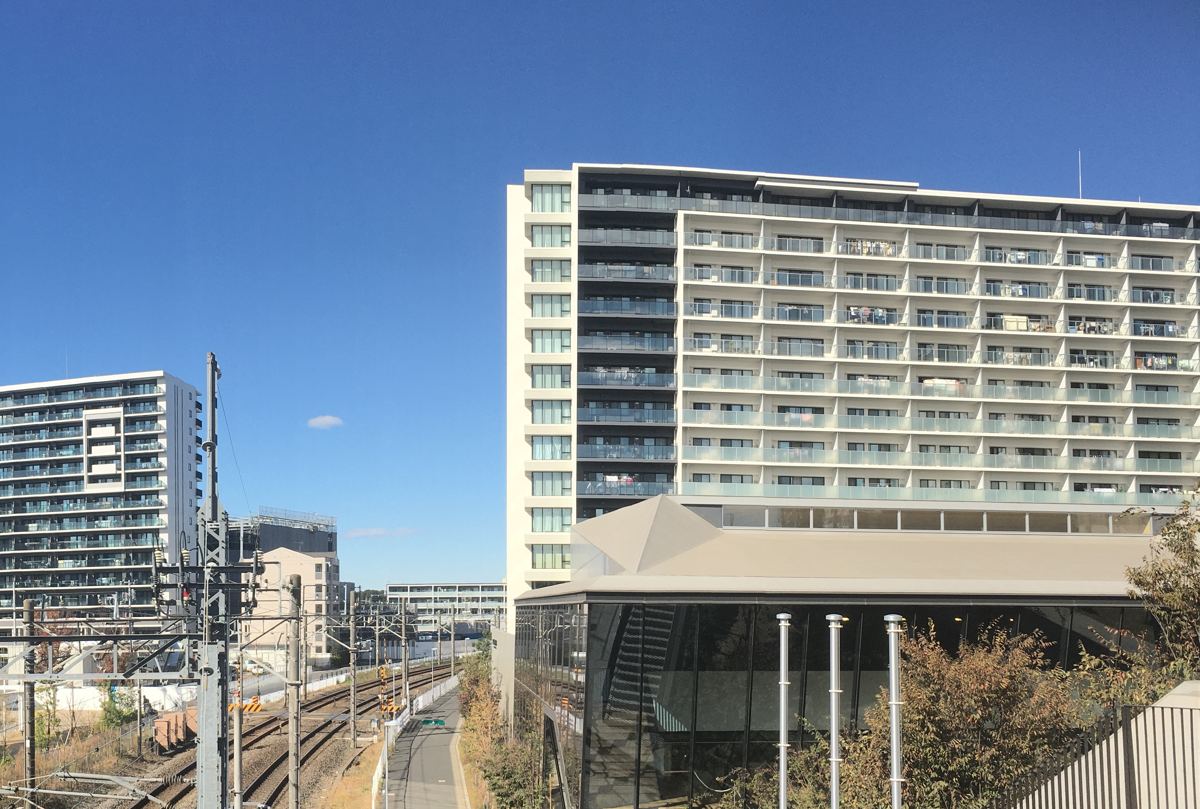
Cover and Kiyose streetscape: Mikagekawase, Nov 2024, Wikimedia Commons original, CC BY 4.0; cover cropped. Nagareyama housing photo: Nesnad, Nov 2020, Wikimedia Commons original, CC BY 4.0, cropped.
Tags
#Kiyose #Nagareyama City #Nagareyama-Otakanomori #Nerima Ward #Kashiwa City #Matsudo City #In-migration #Mover demand #Asking rents #Unit mix #Rental operations #Gross yield #Greater Tokyo suburbs #Urbalytics
References
Rakumachi, 2026-10-14, Analysis of in-migration sources for Kiyose and Nagareyama
Kiyose City, 2026-04-02, Comprehensive Strategy Reiwa 8 revised edition overview
Nagareyama City, 2025-02-01 to 05-31 in-mover questionnaire summary (official PDF)
Nagareyama City, origin details for the same questionnaire period (official PDF)
Copyright: This article is original content by the author. Please do not reproduce, copy, or quote without permission. For usage requests, please contact the author or this site.