Words: 925 | Estimated Reading Time: 5 minutes | Views: 25
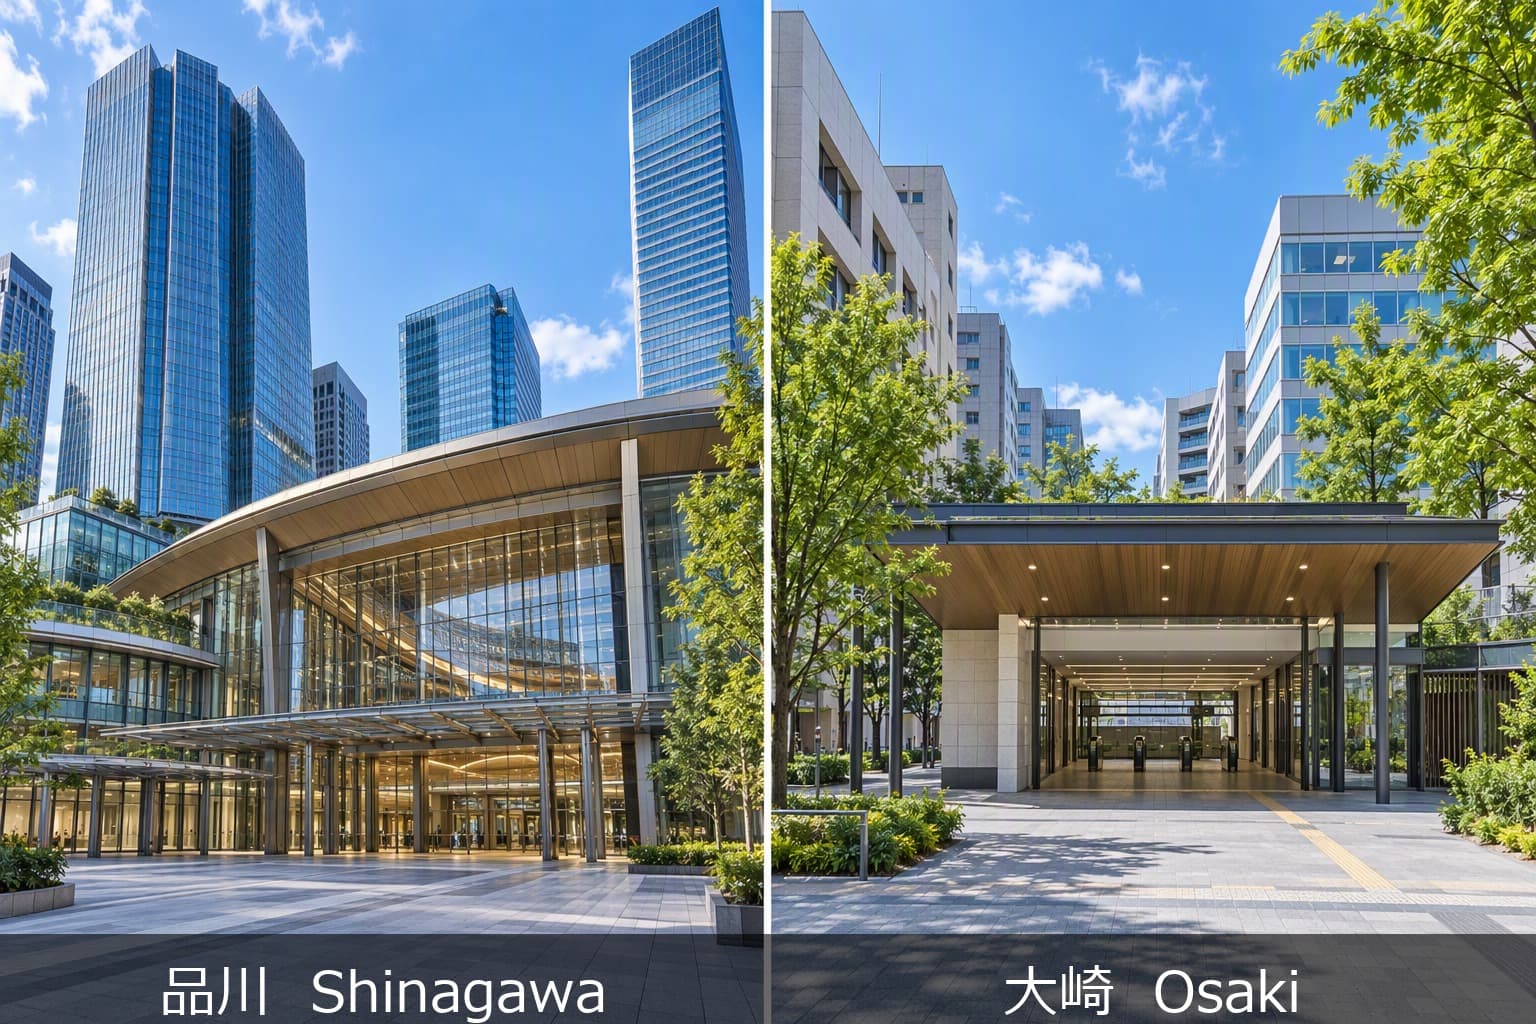
Shinagawa is Tokyo's southern gateway. Shinkansen, Keikyu Line, and Yamanote Line all converge here, funneling hundreds of thousands of commuters every day. The maglev Chuo Shinkansen is planned to terminate here, and redevelopment crews are tearing down old blocks around the station one by one. For many investors, Shinagawa equals "the next place in Tokyo that will go up."
Osaki is the next stop south on the Yamanote Line, two minutes from Shinagawa. Many people have only a vague impression of it: they know it's near Shinagawa, but can't name what's there. The think park office complex sits in front of the station, and Sega Sammy Holdings has its headquarters nearby, but Osaki rarely makes headlines. It sits quietly in Shinagawa's shadow, like a forgotten neighbor.
But open the urbalytics income property data, and the picture between these two stations suddenly gets interesting. The average price of income buildings listed at Shinagawa is about 506 million yen. At Osaki, it's about 216 million. One stop apart, a 2.3x price gap. The yield gap is even wider: Shinagawa averages 2.58%, Osaki 4.81%, nearly double.
The 2.3x Price Gap and Near-Double Yield Difference
Here is the core data comparison:
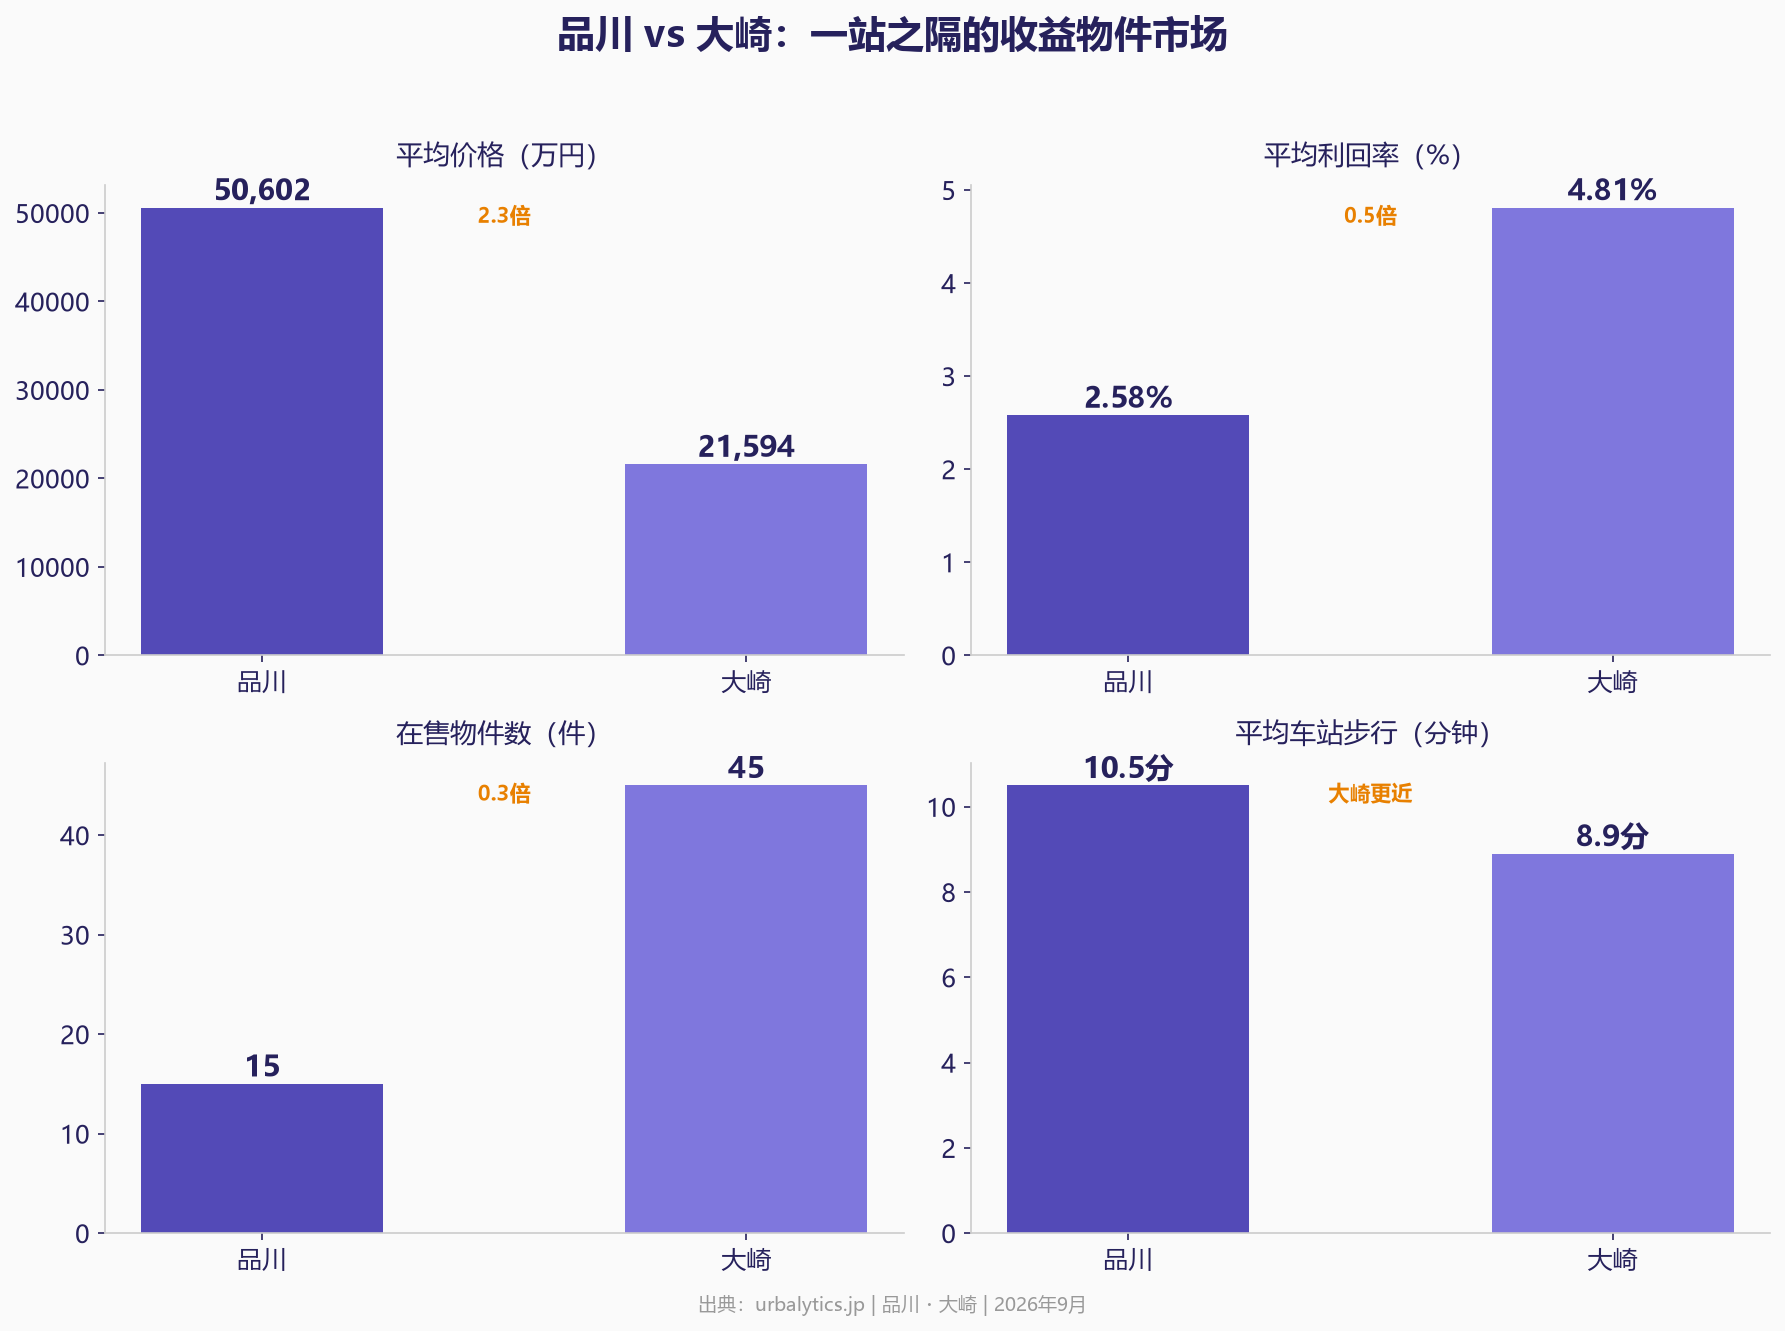
Across four dimensions, Shinagawa is consistently "more expensive, lower yield." But on one metric, Osaki actually wins: average walking distance to the station. Properties listed at Shinagawa average 10.5 minutes on foot; at Osaki, just 8.9 minutes. In other words, Osaki's buildings are closer to the station but cost less than half as much.
The yield spread is equally striking. Among Shinagawa properties with income data, the best yield is 3.40%, the worst 1.46%. At Osaki, the range runs from 7.57% down to 2.80%. Shinagawa's best result doesn't even match Osaki's average.
Price Distribution: Shinagawa in the Mid-to-High Range, Osaki Under 100 Million
Break down the listings by price band and the contrast sharpens:
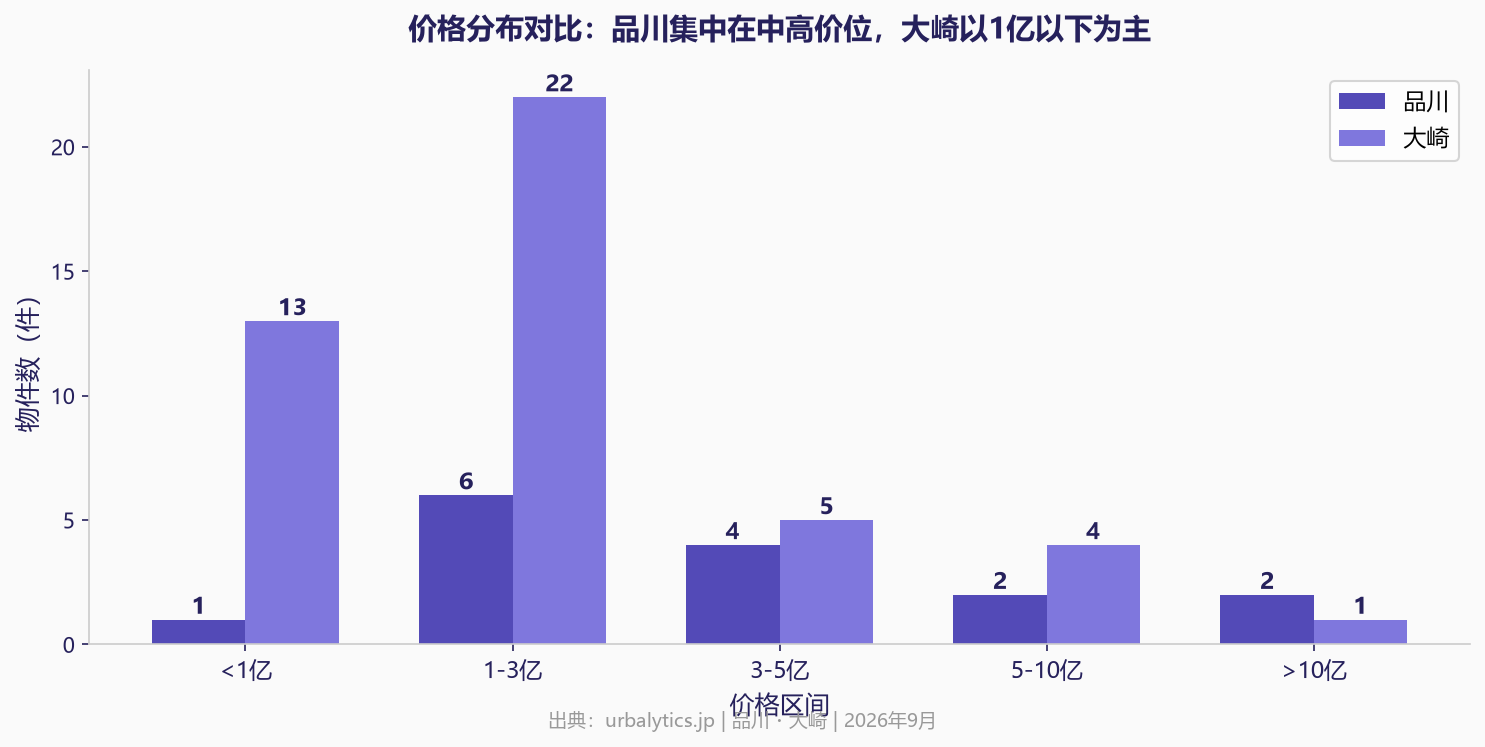
Of Shinagawa's 15 listed buildings, only one sits below 100 million yen. Most cluster in the 100-to-500 million range, with two exceeding 1 billion. At Osaki, 13 of 45 listings fall under 100 million, and 22 sit in the 100-to-300 million band. The core price tiers of these two markets don't overlap.
Supply itself tells a story. Shinagawa has 15 listings; Osaki has 45, three times as many. Scarcity pushes Shinagawa's prices up, but it also means investors there have a very narrow field to choose from.
Rents Are Almost the Same
If prices differ by 2.3x, are rents also 2.3x higher at Shinagawa? The answer is no.
According to urbalytics rent data, the average unit rent for apartments near Shinagawa Station is about 5,534 yen per square meter per month. At Osaki, it's about 5,384 yen. The gap is just 3%.
This is what makes the comparison fascinating. Rental demand intensity at the two stations is nearly identical, yet sale prices differ by 2.3x. The price gap doesn't come from the rental market. It comes from capital value premium. Put differently, buyers at Shinagawa aren't paying for higher rental returns. They're paying for the story of future appreciation.
Where Shinagawa's Premium Comes From
Shinagawa Station is undergoing one of Tokyo's largest redevelopment projects. The Yamanote Line's new station Takanawa Gateway opened in 2020 right next door. The maglev Chuo Shinkansen is planned to terminate here, with direct service to Nagoya expected in the 2030s. Old blocks around the station are being replaced with large office buildings and commercial complexes.
These narratives have pushed up land value expectations. Investors accept 2.58% yields because they're betting on capital appreciation. But there's a catch worth flagging: only 4 properties at Shinagawa have income data, a small sample. The average price is pulled up to about 1.1 billion yen by high-priced outliers. This "average" has limited representativeness.
Osaki's Quiet Value
Osaki is changing too. The think park complex in front of the station houses major offices, and Sega Sammy Holdings has its headquarters nearby. New office projects have been completed, and some listings sit just 3 minutes from the station. But Osaki lacks a "maglev terminal" caliber story, and media coverage is far thinner.
On paper, Osaki's value proposition is "same rent level, half the entry price." The 4.81% average yield is high for the Yamanote Line. And 45 listings give investors far more room to choose, ranging from a compact 40.15 million yen building up to 1 billion yen properties.
But Osaki carries risks too. Market data shows significant tsubo-price volatility, with notable swings between October 2025 and August 2026. The sample is larger than Shinagawa's (24 properties with income data), but liquidity remains limited.
What Investors Should Look At
The Shinagawa versus Osaki comparison boils down to a choice between buying a story or buying numbers.
Choosing Shinagawa means accepting minimal cash flow returns and betting on land appreciation driven by redevelopment. This path suits investors with ample capital, long holding periods, and deep research into area development plans. Keep in mind: few listings, high prices, low yields, and substantial barriers to entry.
Choosing Osaki means getting nearly double the yield at half the price while tapping into rental demand comparable to Shinagawa's. Shorter walking distances, more supply, but no powerful appreciation narrative. This path suits investors who prioritize cash flow and higher immediate returns.
Either way, use the property search tool to compare actual listings. Averages sketch the trend, but every investment comes down to evaluating a specific building.
For deeper data on these stations, check the Shinagawa station market page and Osaki station market page for granular price trends and listing details.
Copyright: This article is original content by the author. Please do not reproduce, copy, or quote without permission. For usage requests, please contact the author or this site.