

ラ・トゥール
住友不動産's rental apartment brand. Asking rent and unit size aggregated from the 35 buildings and 717 rental listings we track.
La Tour
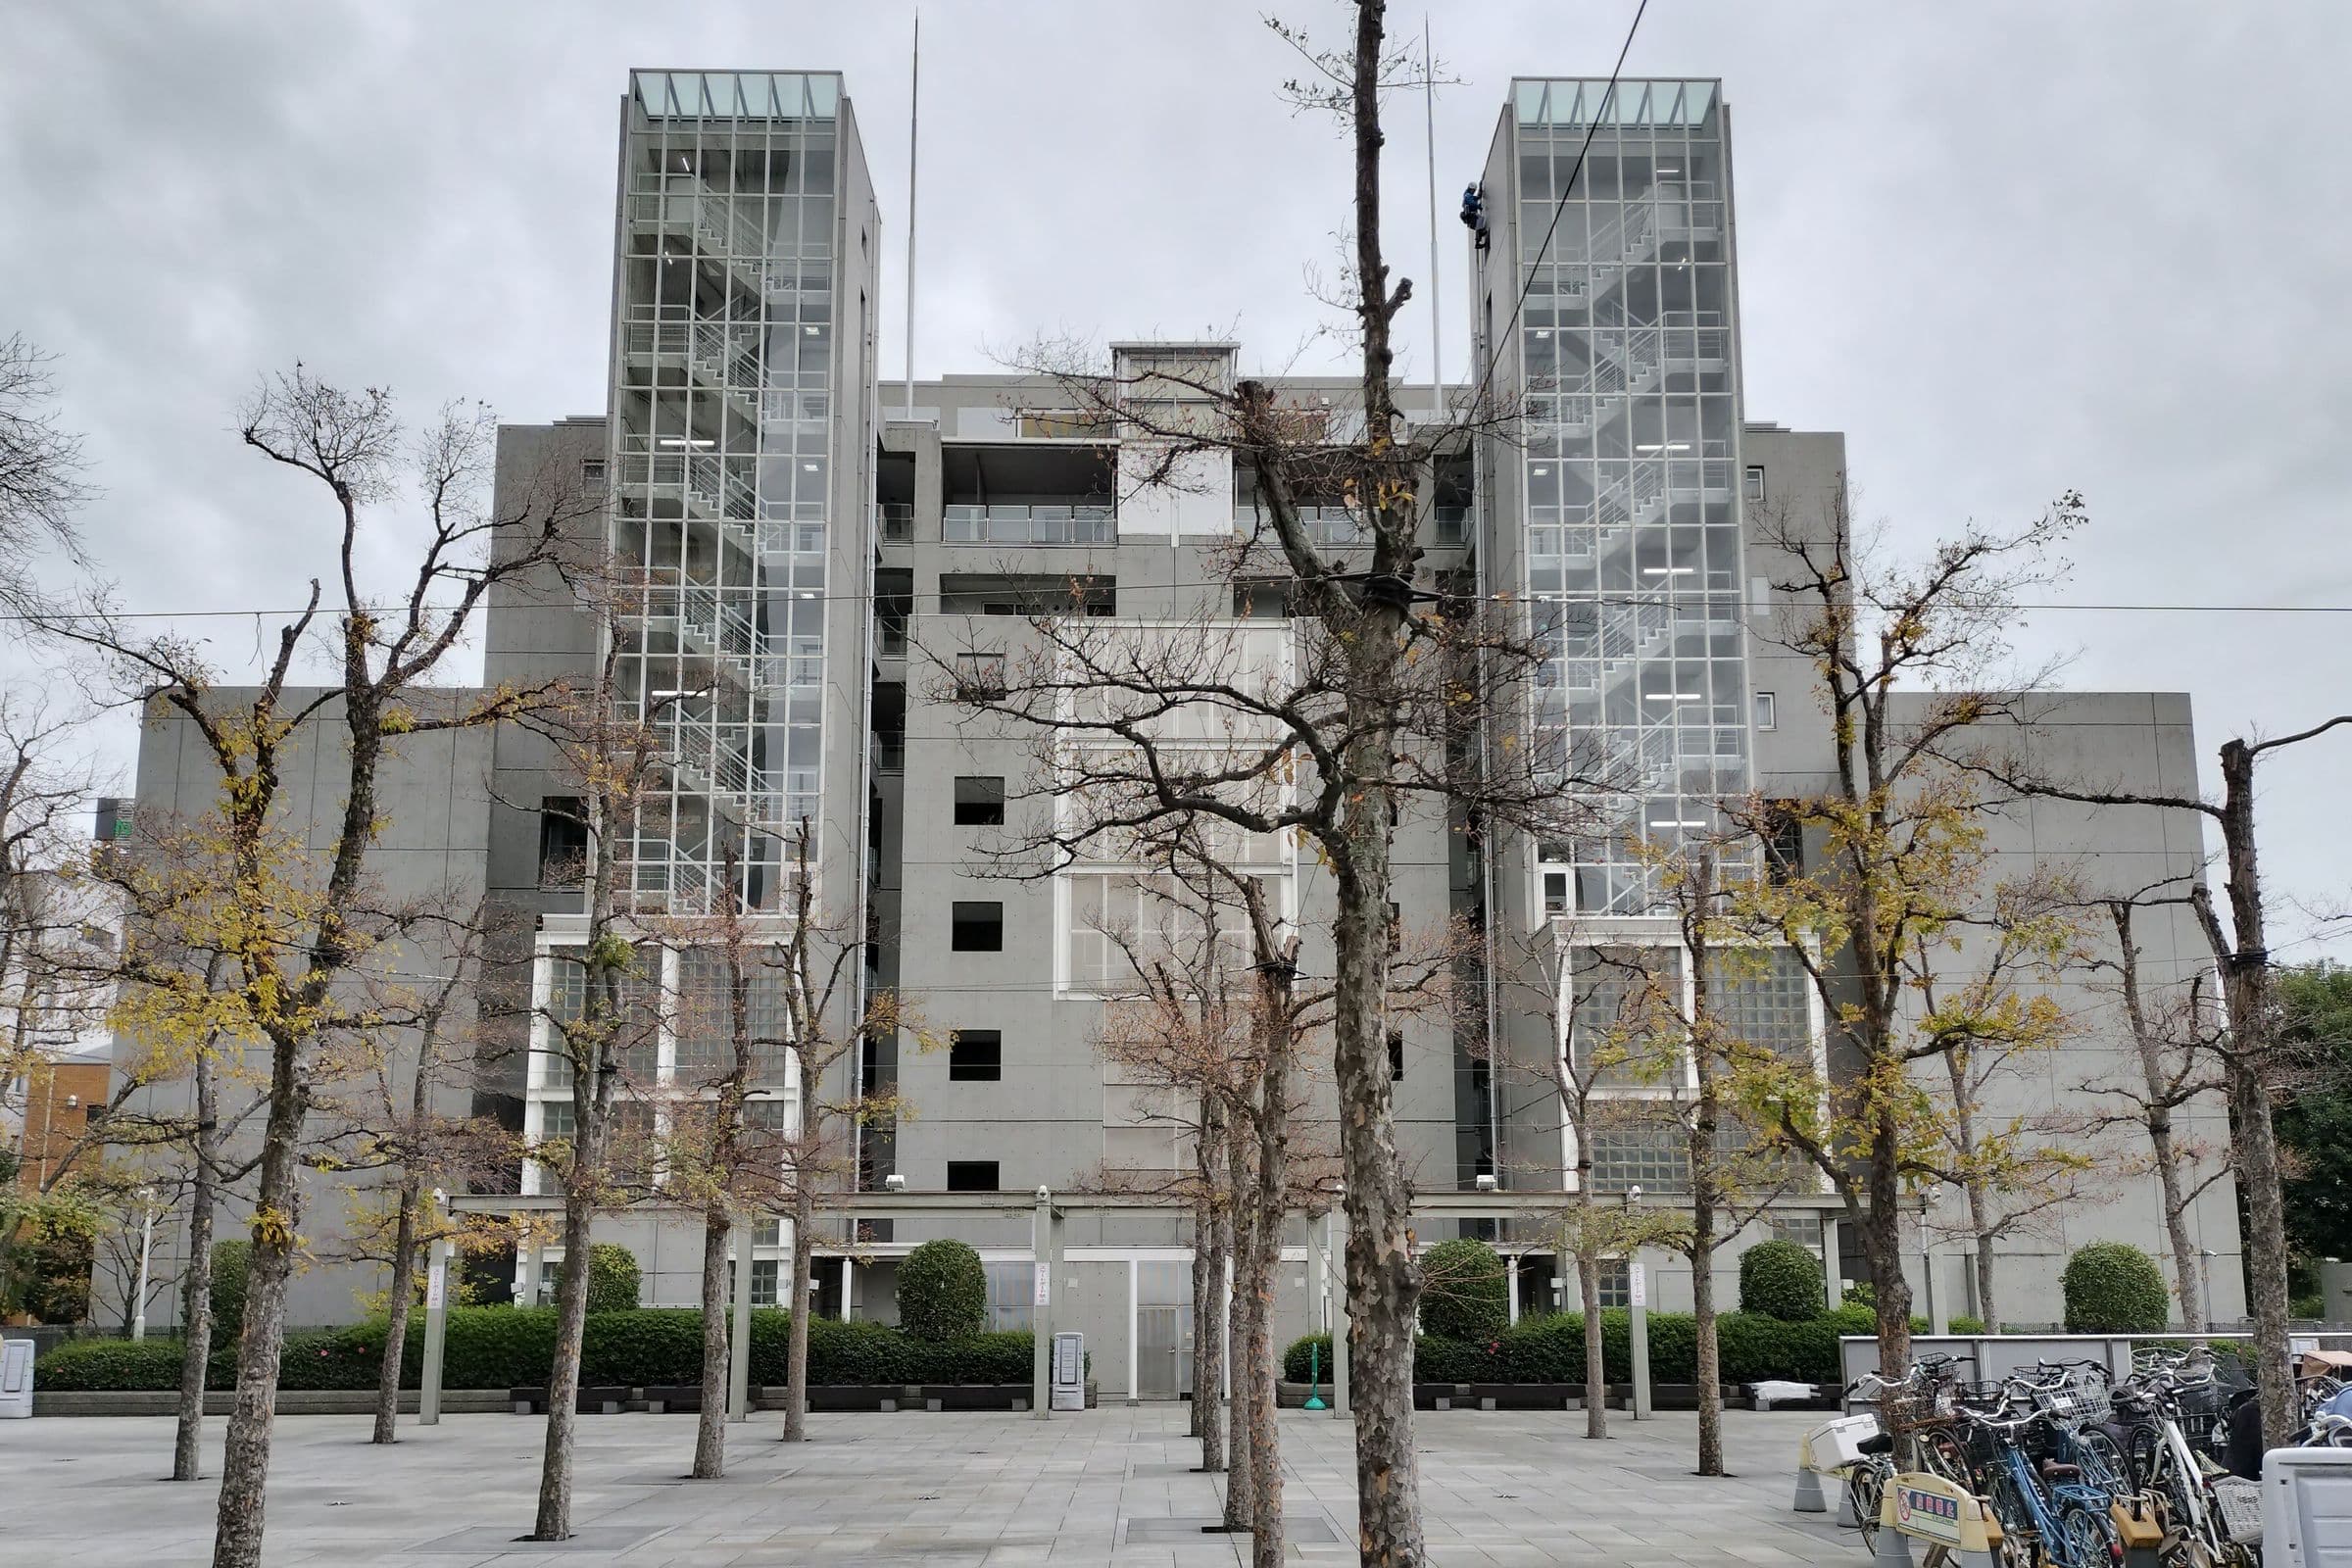
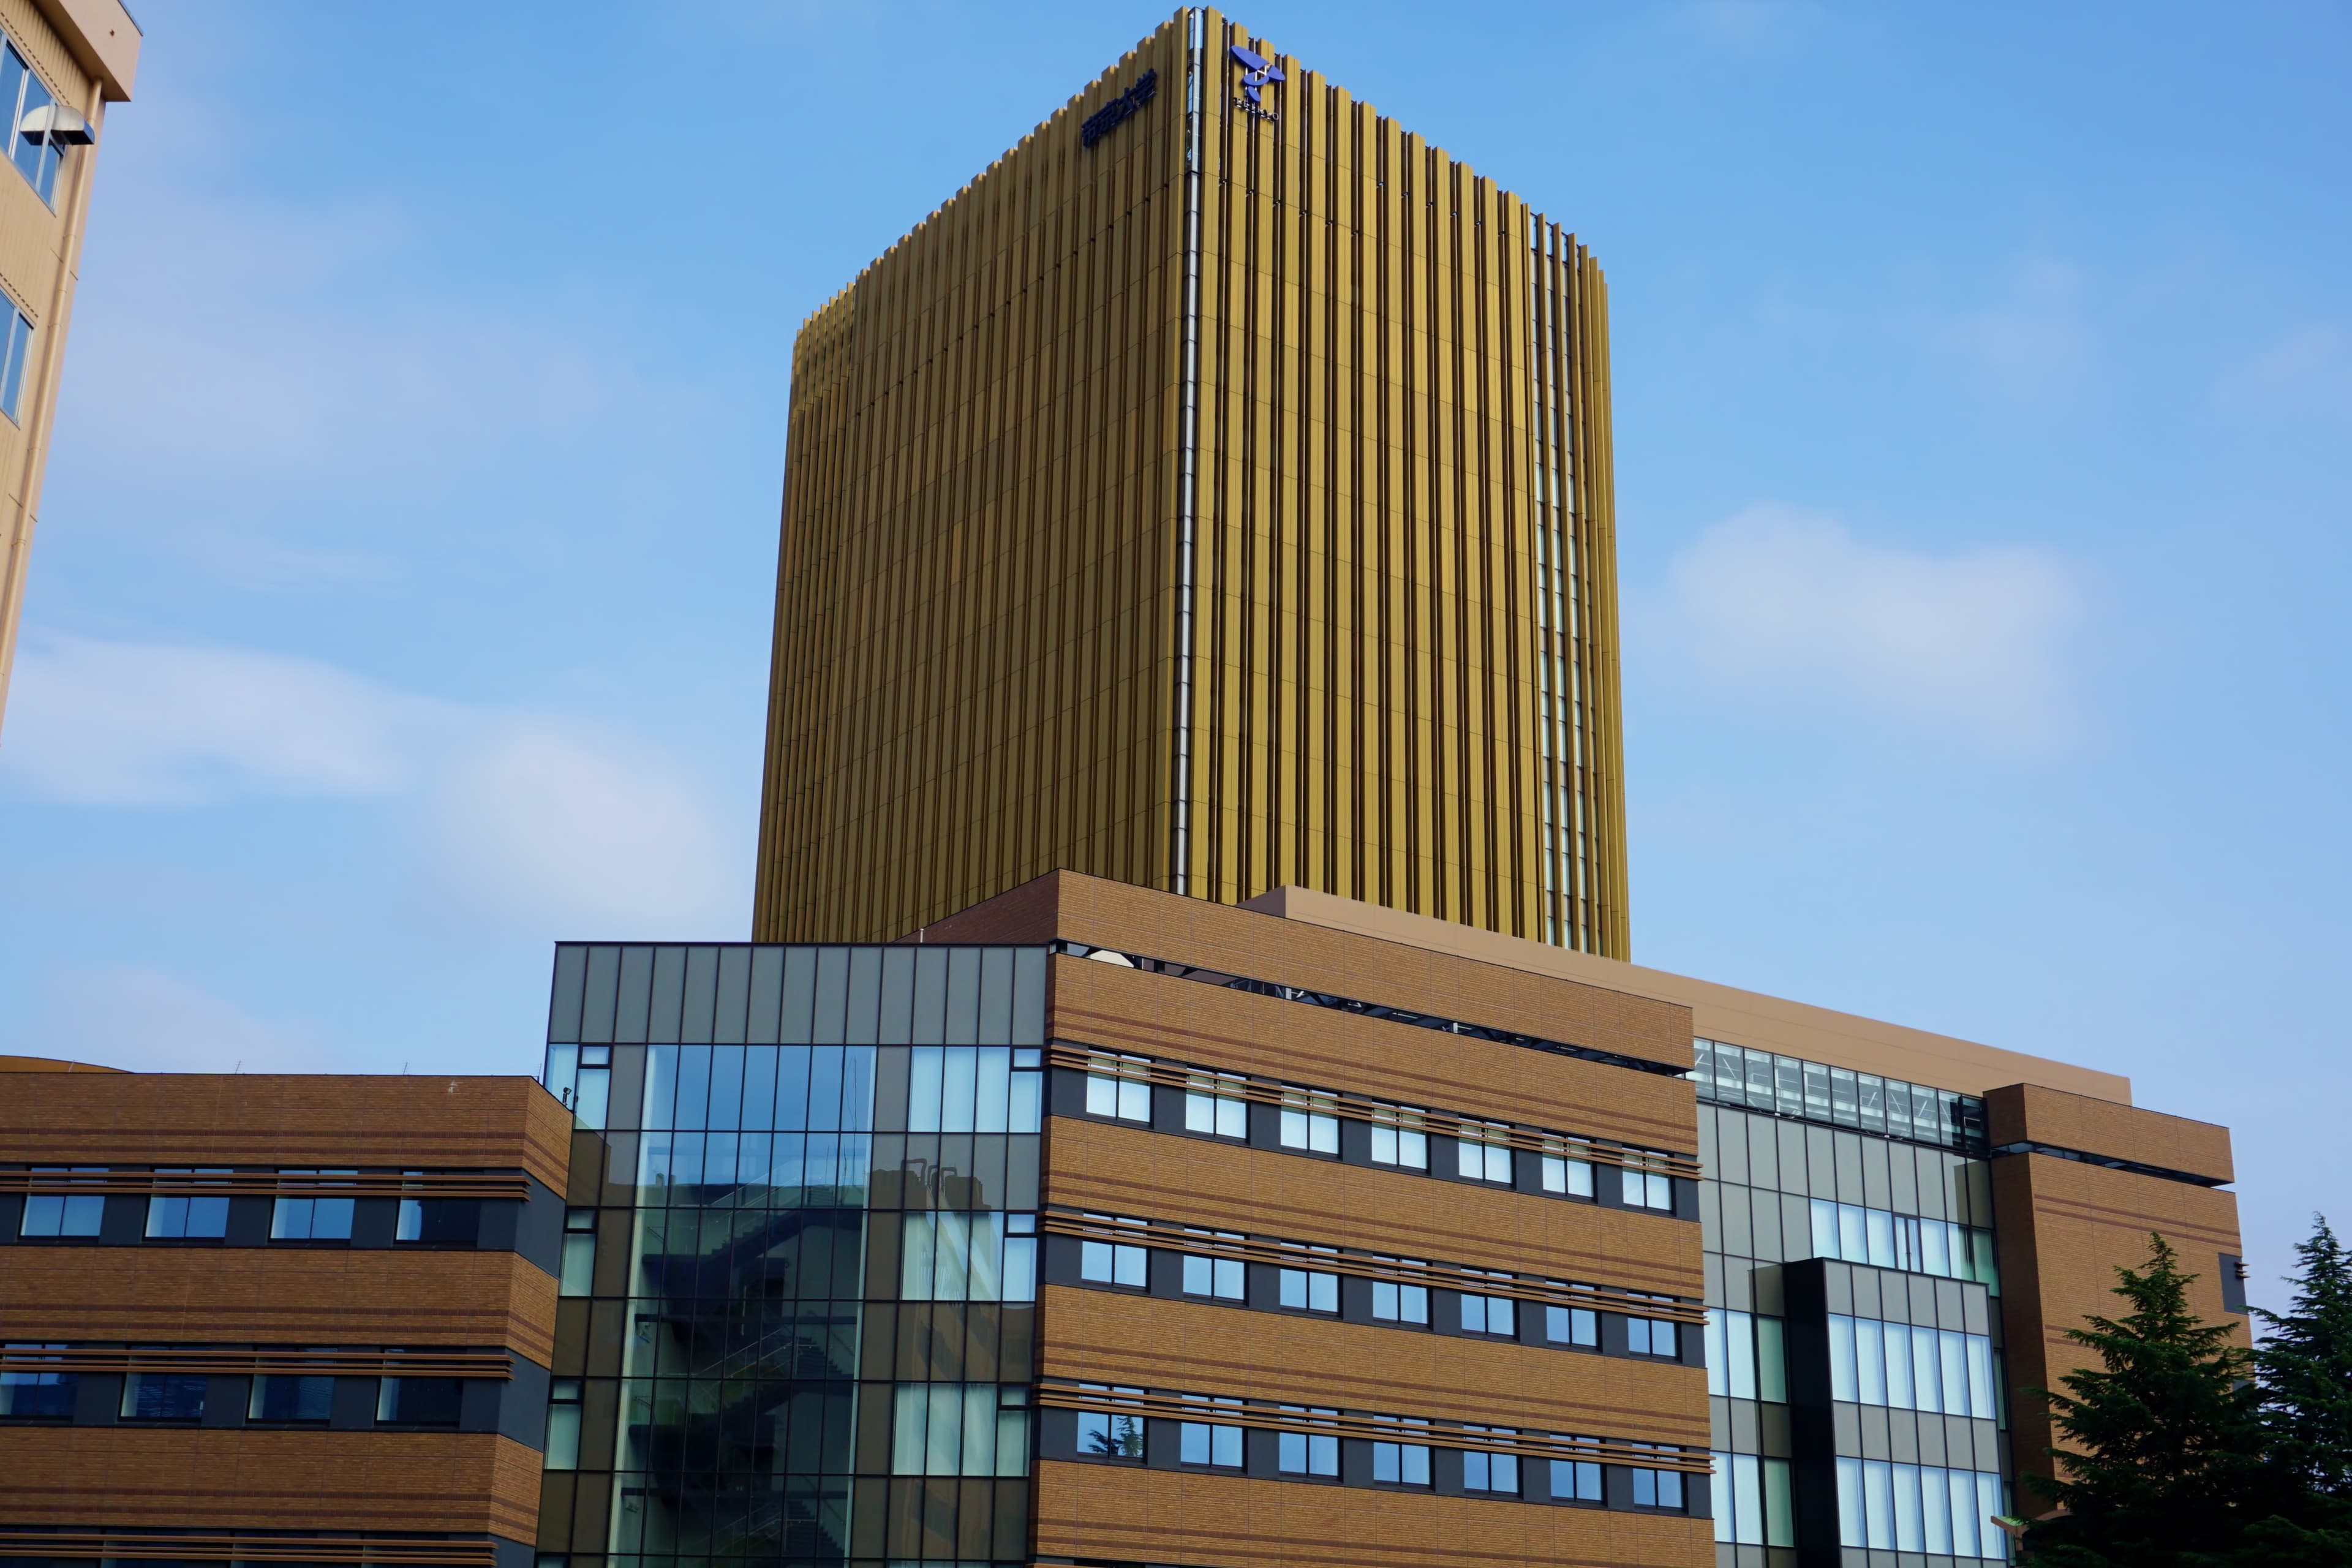
ラトゥール2·Ooozooone/CC BY-SA 3.0 (cropped)·Wikimedia Commons
Overview
#Only properties whose brand could be identified are counted.
Where they are
By building count. Properties with no registered address are kept in the table so the total matches the building count above.
| Prefecture | Buildings | Share | |
|---|---|---|---|
| 東京都 | 29 | 82.9% | |
| 埼玉県 | 3 | 8.6% | |
| 神奈川県 | 3 | 8.6% |
What the brand builds
#Specifications of the buildings themselves. The number of buildings known differs by field, so each card carries its own count.
Rent level
#Asking rents aggregated from rental listings under the same brand. Not closed rents.
Rent per tsubo, by bandn = 717
Units currently advertised per rent-per-tsubo band (rent ÷ floor area). The bands are the same on every brand page. Choosing “all four prefectures” draws one series per prefecture side by side; each band's share is in the tooltip and the table.
| Price band | All four prefectures | 東京都 |
|---|---|---|
| under 6 | 4(0.6%) | 0(0.0%) |
| 6–8 | 6(0.8%) | 0(0.0%) |
| 8–10 | 3(0.4%) | 2(0.3%) |
| 10–12 | 5(0.7%) | 2(0.3%) |
| 12–14 | 4(0.6%) | 2(0.3%) |
| 14–16 | 0(0.0%) | 0(0.0%) |
| 16–18 | 1(0.1%) | 1(0.1%) |
| 18–20 | 11(1.5%) | 11(1.6%) |
| 20–25 | 303(42.3%) | 303(43.2%) |
| 25–30 | 217(30.3%) | 217(31.0%) |
| 30 and over | 163(22.7%) | 163(23.3%) |
Rent per tsubo, by month
Median asking rent per tsubo among the units advertised each month, counted once per unit per month. The rent history only starts in 2023 and is thin in its first years, so only the last 12 months are shown.
| Month | Rent per tsubo (median) | Units |
|---|---|---|
| November 2025 | 26.1 ¥k/tsubo/mo | 52 |
| December 2025 | 29.0 ¥k/tsubo/mo | 32 |
| January 2026 | 27.5 ¥k/tsubo/mo | 39 |
| February 2026 | 26.2 ¥k/tsubo/mo | 38 |
| March 2026 | 27.0 ¥k/tsubo/mo | 28 |
| April 2026 | 29.5 ¥k/tsubo/mo | 32 |
| May 2026 | 28.2 ¥k/tsubo/mo | 10 |
| June 2026 | 26.4 ¥k/tsubo/mo | 36 |
| July 2026 | 25.4 ¥k/tsubo/mo | 45 |
| August 2026 | 29.3 ¥k/tsubo/mo | 48 |
| September 2026 | 27.5 ¥k/tsubo/mo | 47 |
| October 2026 | 26.1 ¥k/tsubo/mo | 105 |
Notable buildings
#Ordered by listing volume. Full history, rental comparables and neighbourhood comparisons for each property are in the app.
Showing the 12 buildings that have coordinates. Table rows and map pins are linked.
| Building | Nearest station | Built | Detailed listings | |
|---|---|---|---|---|
| ラトゥール千代田 | 九段下 5 min walk | 2004 | 4 | Sign-in required |
| ラトゥール新宿グランド | 西新宿 4 min walk | 2011 | 2 | Sign-in required |
| ラトゥール神楽坂 | 江戸川橋駅 6 min walk | 2002 | 2 | Sign-in required |
| ラトゥール渋谷宇田川 | 渋谷駅 8 min walk | 2019 | 1 | Sign-in required |
| ラトゥール飯田橋 | 飯田橋 4 min walk | 2010 | 1 | Sign-in required |
| ラトゥール千代田皇居ビュー | 九段下 5 min walk | — | 1 | Sign-in required |
| ラトゥール橋本 | 橋本 11 min walk | 2025 | 0 | Sign-in required |
| ラトゥール目白御留山 | 目白駅 8 min walk | 2023 | 0 | Sign-in required |
| ラトゥール新宿ファースト | 都庁前駅 17 min walk | 2023 | 0 | Sign-in required |
| ラトゥール南橋本2 | 南橋本 2 min walk | 2022 | 0 | Sign-in required |
| ラトゥール南橋本 | 南橋本 2 min walk | 2021 | 0 | Sign-in required |
| ラトゥール新宿アネックス | 西新宿五丁目駅 8 min walk | 2019 | 0 | Sign-in required |


ラ・トゥール covers all 35 buildings. To search or filter by building name, use the in-app property search.
Other brands from 住友不動産
#Other series from the same developer. Each brand sits at its own price band and unit size.


Photographs of other brands are from Wikimedia Commons (author and licence are given on each brand’s own report page).
Brands common in the same areas
Brands that also build in the municipalities ラ・トゥール builds in, ordered by how many they share.
- パークホームズ13 municipalities180 buildings
- プラウド12 municipalities136 buildings
- シティハウス11 municipalities124 buildings
- ザ・パークハウス10 municipalities183 buildings
- アルス10 municipalities91 buildings
- ブランズ10 municipalities71 buildings


Brand photographs from Wikimedia Commons (author and licence are given on each brand’s own report page).
Developers of a similar size
Ordered by how close their published building count is to this developer's. Each opens that developer's brands.
- 野村不動産±0 buildings5 brands921 buildings
- 三菱地所レジデンス−133 buildings3 brands788 buildings
- 東急不動産−199 buildings3 brands722 buildings
- 丸紅−455 buildings2 brands466 buildings
- モリモト−486 buildings4 brands435 buildings
- 東京建物−546 buildings2 brands375 buildings


Developer photographs from Wikimedia Commons (author and licence are given on each developer’s own report page).
Figures on this page are derived statistics: listing and rental-offer data collected by Urbalytics, aggregated by brand. They are asking prices at the time of listing, not closed prices. Only brands with 30 records or more across sale and rent are covered. Brands are identified from the building name, so a property matching none of the 39 series is left out of the aggregate.
Latest articles
Urbalytics analysis built on price-revision history, closed sales and rental data.
- Market AnalysisRental property acquired within five years: What proposed inheritance valuations mean for Tokyo owners
- Area & Property SpotlightShinjuku Central Park’s planned 39-story tower: What it means for nearby rental valuations
- Area & Property SpotlightFujisawa’s intergenerational housing: Who pays for discounted rents and community support?
- Price WatchTokyo Condo Market Watch (2026.10 #3) | More Price Cuts in Towers, Newer and Larger Units
- Market AnalysisTokyo investment condos average ¥41.49 million: Should whole-building prices follow?
- Area & Property SpotlightTeikyo University in Hachioji: Assessing Student Rentals Around Otsuka

Find condominiums in ラ・トゥール
Individual listings, price-change history, closed transactions and AI valuations are available on a free account.