Words: 1133 | Estimated Reading Time: 6 minutes | Views: 35
Greater Tokyo’s average fell below ¥100 million for the first time in four months; what declined wasn’t prices, but the supply of high‑priced central‑city product.
If you only read the headline, August 2026’s Greater Tokyo new‑condo market seems to have finally loosened: data released by the Real Estate Economic Institute on Sept 17 show the average price of newly built for‑sale condominiums across Tokyo and the three surrounding prefectures at ¥97.70 million, down 5.4% YoY—the first print below ¥100 million in four months.
For buyers who have waited three years for a “turning point,” that figure is enough to quicken the pulse. But turn one page in the same report, and the conclusion flips.
In the same dataset, none of the four areas actually fell
The counterintuitive part is this: of the four regions that make up the “decline,” not one actually declined.
Tokyo’s 23 wards averaged ¥138.21 million in August, up 0.1% YoY, marking 16 straight months above ¥100 million. Kanagawa came in at ¥73.09 million (+10.6% YoY); Saitama ¥68.40 million (+15.6%); Chiba ¥67.02 million (+9.1%).
All four rose, yet the combined average fell 5.4%—not an arithmetic error, but a change in weighting. As high‑ticket central projects largely disappeared from the denominator, the remaining samples pulled the average down.
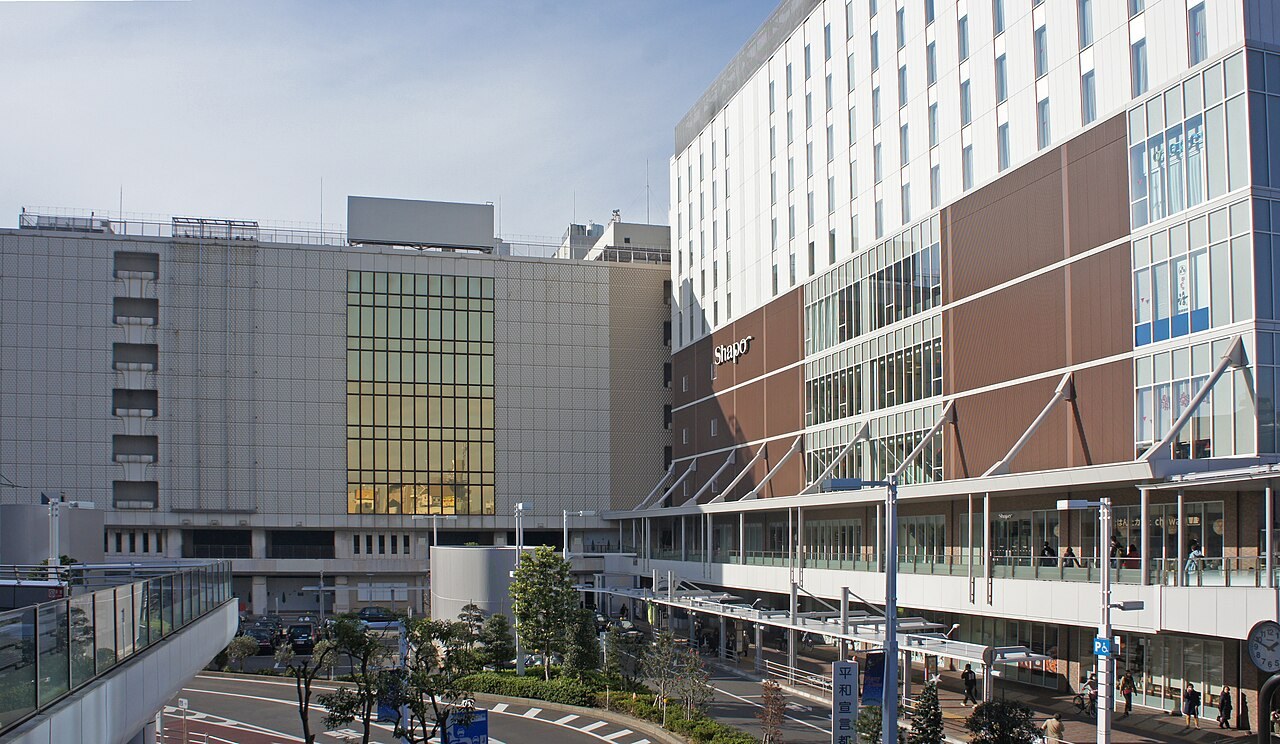
Supply data make this explicit: Kanagawa launched 140 units in August (−37.8% YoY); the Tokyo 23 wards just 478 units (−30.7% YoY). By contrast, Chiba reached 247 units on large launches around Funabashi, nearly doubling YoY (+100.8%).
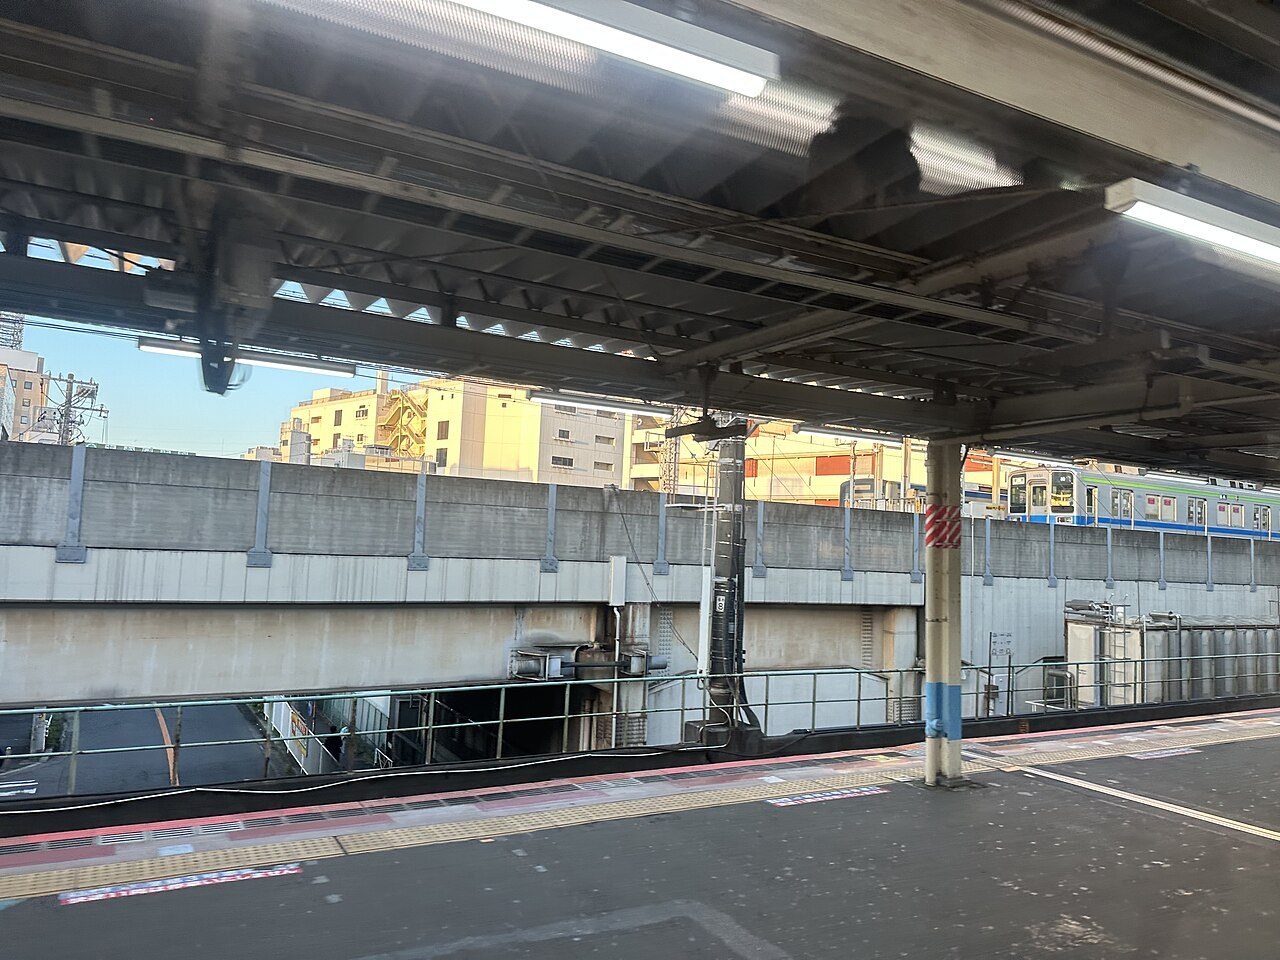
In short, August was a month of “no expensive launches, concentrated cheaper launches.” The supposed drop in the average is a statistical mirage, not a price concession.
Land and build costs are pushing developers out of the core
Why did supply buckle? The answer is on the cost side.
At the press briefing, REEI senior chief researcher Tadashi Matsuda noted that rising construction costs are redrawing project feasibility boundaries: the farther out you go, the harder it is to price to local market levels.
That point is worth dwelling on. It shows developers face not a demand question—“will it sell?”—but a supply question: “can we secure land, and do the numbers pencil?” MLIT’s benchmark land prices released Sept 15 show nationwide land up for five straight years, commercial land +2.9%, led by Tokyo and Osaka—no sign of relief on the land‑cost side.
The result is a pincer squeeze: in the core, land is too costly to start projects; in the suburbs, local rents and incomes cap achievable pricing below what construction costs require. The thick middle of the product spectrum is being thinned from both ends.
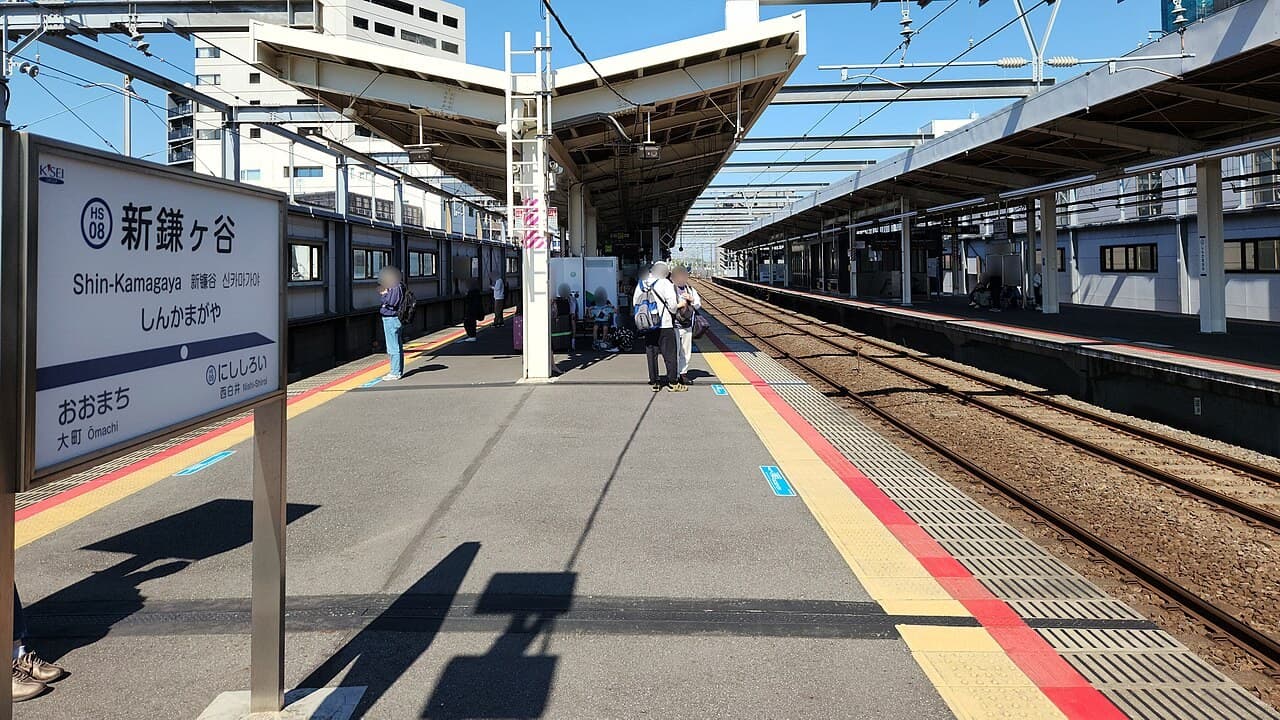
Urbalytics Insight From Urbalytics’ internal data, Funabashi is not simply “cheap.” Within the Funabashi Station catchment, 486 rental‑apartment samples show advertised rent per tsubo has recovered from 0.97 ×10,000 yen (≈¥9,700) in 2025 Q4 to 1.00 ×10,000 yen (¥10,000) in 2026 Q3, while sample size in the same period expanded from 15 to 219—volume and price strengthened together, indicating genuine spillover of end‑user demand rather than pure discounting.
Whole‑building income side: Funabashi’s prices have already moved first
The new‑condo average is only one side of the story. For income‑oriented investors, what’s happening to whole‑building assets in the same area is more informative.
On the Urbalytics platform, 105 whole‑building listings within the Funabashi Station area show an average gross yield (hyomen rimawari) of 6.36% (median 6.00%), an average asking price around ¥170.28 million, and annual income of about ¥10.10 million. In the commuter belt across the Tokyo metro, that yield level is upper‑mid.
But the price trajectory hasn’t been smooth. Achieved price per tsubo surged from ¥1.76 million in 2025 Q3 to ¥2.78 million in 2026 Q1, then eased to ¥1.8265 million in Q3—only +3.75% net over the whole period.
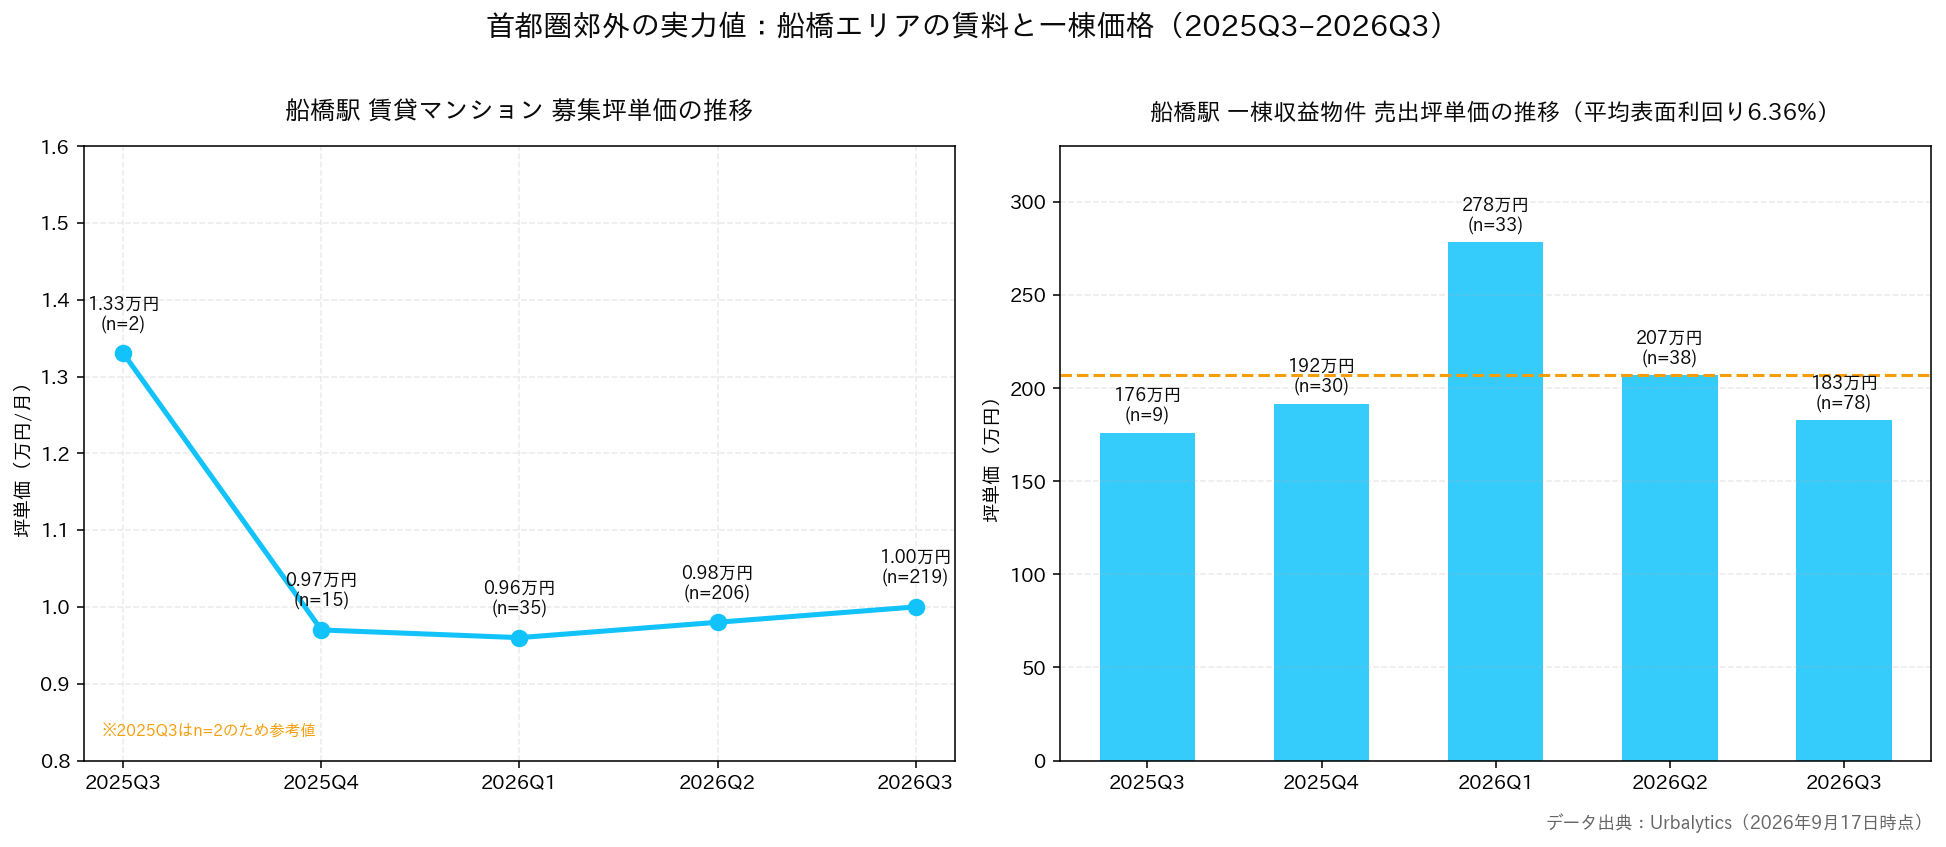
This curve suggests Funabashi pricing tested higher and then reverted ahead of new‑condo supply. The early‑year peak looks like a seller‑sentiment spike, while today’s ~¥1.8 million/tsubo zone is where buyers and sellers are shaking hands again.
Risk disclosure An average decline does not equal wider negotiation room. When supply is intentionally curtailed, buyers’ bargaining power tends to shrink, not expand. Also note: Funabashi’s 2025 Q3 rent sample count was just 2, so it is indicative only and not a reliable trend anchor.
Three practical takeaways for investors
In sum, the August data imply three points:
First, any “Greater Tokyo average” during a month of volatile supply cannot be read directly as a price signal; check the month’s regional mix and unit counts before deciding whether the number is usable.
Second, the core and the periphery are formalizing a role split—the 23 wards maintain scarcity pricing above ¥100 million, while Kanagawa, Saitama, and Chiba absorb end‑user demand priced out of the core. This spillover chain expands the investable set for both whole‑building and unit investors.
Third, cost‑push high price points won’t fall simply because demand softens; the variables most likely to trigger price adjustment are interest rates and financing conditions, not noise in a monthly average.
On Sept 17 the Bank of Japan hiked rates; Tokyo real estate stocks nevertheless rose broadly that day, with over 80% of TSE Prime constituents closing higher—the market’s read on “rate normalization” is clearly cooler than a single monthly average.
Conclusion: When you read data, read the denominator first
This August 2026 headline is a textbook demonstration of a statistical trap. The ¥97.70 million figure itself isn’t wrong; what’s wrong is taking it as evidence of price weakness.
In a market where supply is constrained by costs and demand is spreading outward, genuinely useful judgments rest on finer‑grained data—rent per tsubo by station area, yield distributions by asset type, and quarter‑to‑quarter changes in sample size. That is precisely what Urbalytics focuses on: translating coarse “Greater Tokyo” narratives into local, actionable values.
#GreaterTokyoHousing #NewCondos #Tokyo23Wards #FunabashiChiba #KanagawaRealEstate #SaitamaRealEstate #JapanPropertyInvestment #WholeBuildingIncomeAssets #GrossYield #RealEstateEconomicInstitute #BenchmarkLandPrices #BOJRateHike #RentalMarket #SupplyContraction #Urbalytics
References
1. The Yomiuri Shimbun, 2026, “In August, Greater Tokyo’s new‑build condos averaged ¥97.70 million, down 5.4% YoY, as supply declined in the high‑price segment”, https://www.yomiuri.co.jp/economy/20260917-GYT1T00335/
2. Asahi Shimbun, 2026, “Greater Tokyo new‑build condos at ¥97.70 million in August—first sub‑¥100 million in four months”, https://news.yahoo.co.jp/articles/57afd1497a0211dfff99c000443a921409d4671d
3. TBS NEWS DIG, 2026, “August new‑build condo prices: Greater Tokyo ¥97.70 million, below ¥100 million for the first time in four months”, https://news.yahoo.co.jp/articles/dfa135ae546127d3b4575720a5dd14186589b29b
4. Kenbiya, 2026, “MLIT releases benchmark land prices. Nationwide land up five consecutive years. Commercial +2.9%, led by Tokyo and Osaka”, https://www.kenbiya.com/ar/ns/research/
5. The Yomiuri Shimbun, 2026, “Nikkei 225 closes up ¥213”, https://www.yomiuri.co.jp/economy/20260917-GYT1T00274/
6. Urbalytics internal platform data (Funabashi Station area: rental apartments 486 cases / whole‑building income 105 cases, retrieved Sept 17, 2026), https://www.urbalytics.jp
Copyright: This article is original content by the author. Please do not reproduce, copy, or quote without permission. For usage requests, please contact the author or this site.