Words: 1751 | Estimated Reading Time: 9 minutes | Views: 87
In Tokyo’s 23 wards, residential land rose by 8.7%, yet live-market data show that the price per tsubo and rents for income-producing buildings have not kept pace with that curve.
On September 15, 2026, the Ministry of Land, Infrastructure, Transport and Tourism (MLIT) released the Prefectural Land Price Survey results (Kijun Chika, as of July 1) for 21,466 benchmark points nationwide. The nationwide average across all uses rose 1.5%, marking five consecutive years of gains.
But what investors should really pause to examine is not that average, but the set of gaps underneath it.
Residential land across Tokyo’s 23 wards rose 8.7%, the largest increase since 2007 before the Lehman shock; the prior year was 8.3%, indicating further acceleration. Tokyo Metropolis also ranked first for the first time in 12 years among prefectures in residential land price growth.
Yet when we pull the same-period live listings and transaction data on the Urbalytics platform, we see a curve pointing the other way.
Find properties in 東京都台東区
Individual listings, price-change history, closed transactions and AI valuations are available on a free account.
The numbers: where the rally is, and where it’s starting to slow
First, the public-data backbone. Nationwide, residential land rose 1.0%, flat versus the prior year; commercial land rose 2.9%, slightly above the prior year’s 2.8%. The three major metropolitan areas rose 4.4% overall; within that, the Tokyo metro rose 5.4% across all uses, with commercial land up a striking 8.9%.
Within the Tokyo metro, the leader in residential land gains was Kita-Shinagawa in Shinagawa Ward, up 18.8%, followed by Shibaura in Minato Ward, up 18.7%. The common driver is large-scale redevelopment around Takanawa Gateway Station (高輪ゲートウェイ駅)—the market is buying not present convenience, but expected future convenience.
The closer to the core, the steeper the rise: the Central 3 Wards’ residential land growth accelerated from 13.1% to 13.9%, the Central 6 Wards from 12.8% to 13.3%, and the 23 wards overall from 8.3% to 8.7%. MLIT’s language was cautious, noting only that it is “hard to say there is already a sense of pause” in condominium prices.
That’s only half true. In the same survey, ultra-core areas like Chiyoda and Chuo actually saw narrower gains. An MLIT official put it more bluntly: with condominium prices persistently high, some demand has already been shaved off.
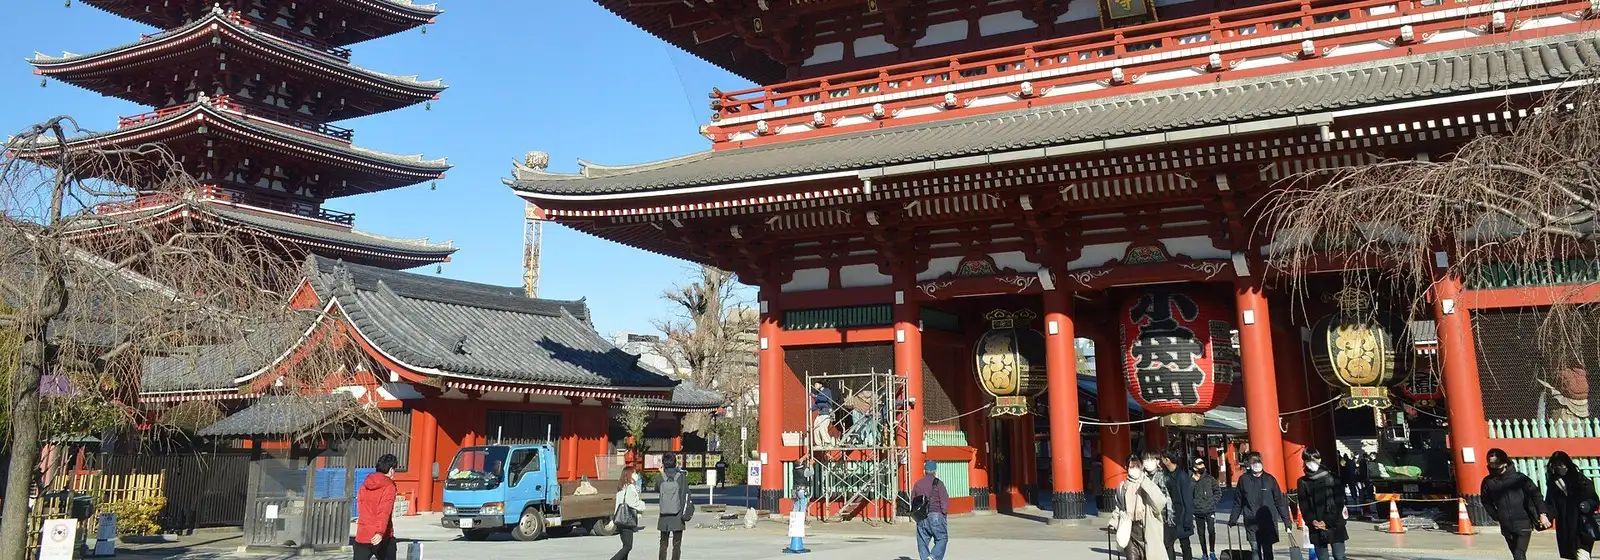
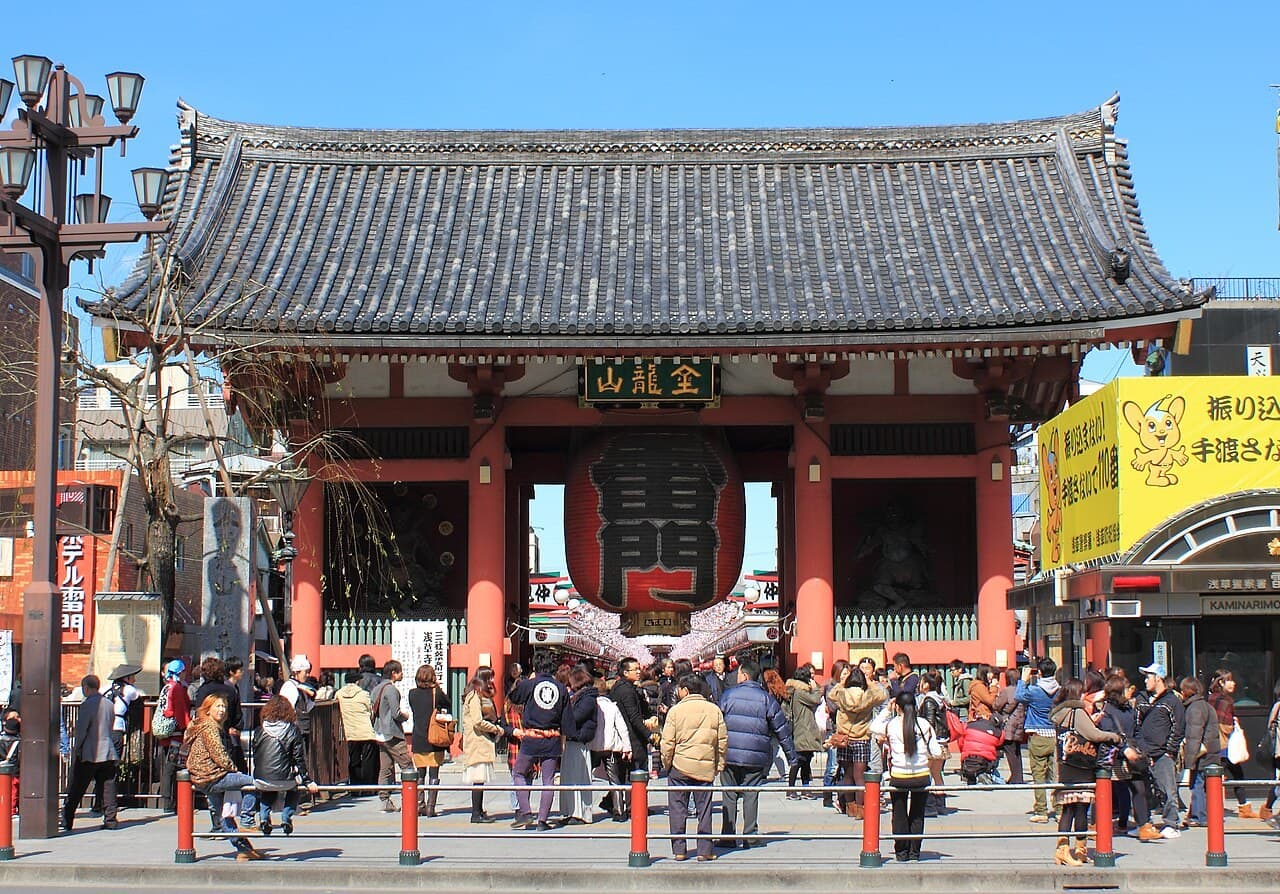
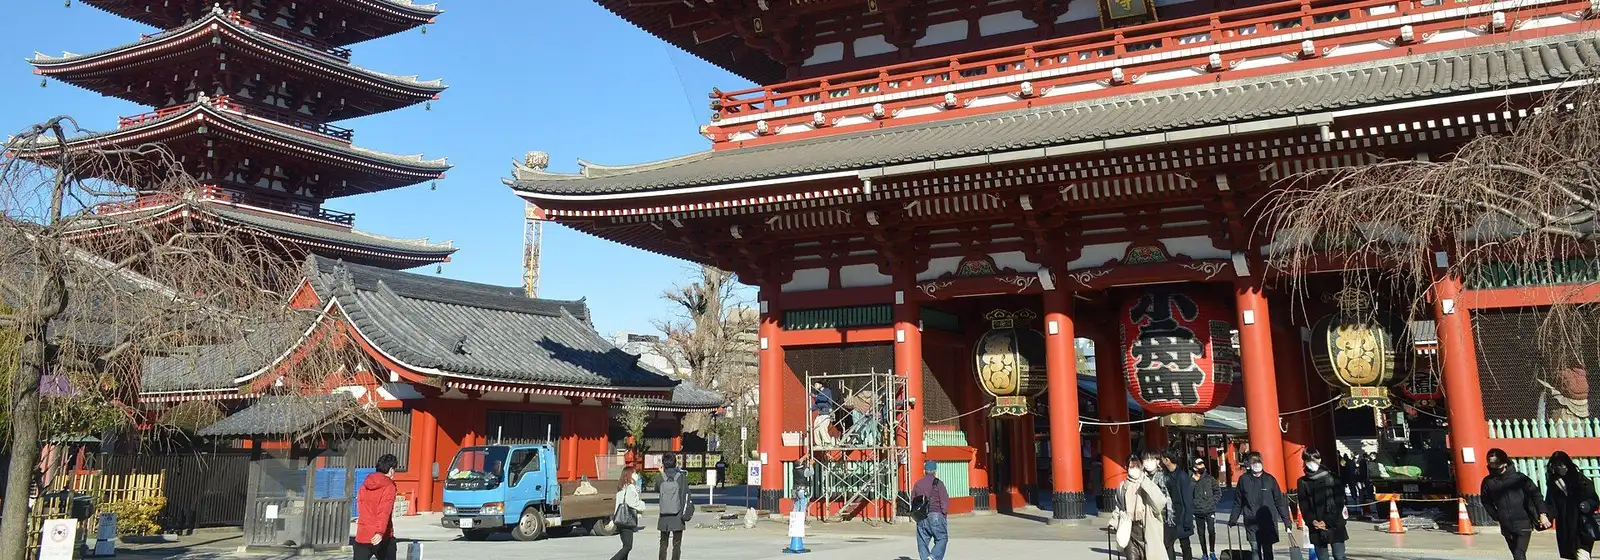
On the commercial side, Tokyo accounts for 6 of the nationwide top 10 gainers, 4 of them in Asakusa, Taito Ward. One Asakusa commercial site rose 26.9%, another 25.0%—reports say prime Asakusa land values have climbed to 2.2 times in five years.
The driver is unsurprisingly inbound tourism. But it brings more than revenue: rising land values push up rents, and coupled with succession challenges, traditional shops in Asakusa are closing one after another. Teruko Tominaga (89), who runs the handmade soba shop “Towada,” told reporters that on this street “only my place and the one across” are not chain stores anymore.
Divergence 1: Land is rising while the price per tsubo of whole-building income assets is falling
Here’s the first divergence. Using Urbalytics’ station-area data for Asakusa whole-building income properties (一棟), we pulled a time series that is almost a mirror image of the land-price curve.
In the Asakusa station area, there are 132 on-market whole-building samples. The average gross yield (表面利回り) is 5.64%, with a median of 4.60%, and the average asking price is about JPY 444 million. Not bad at first glance.
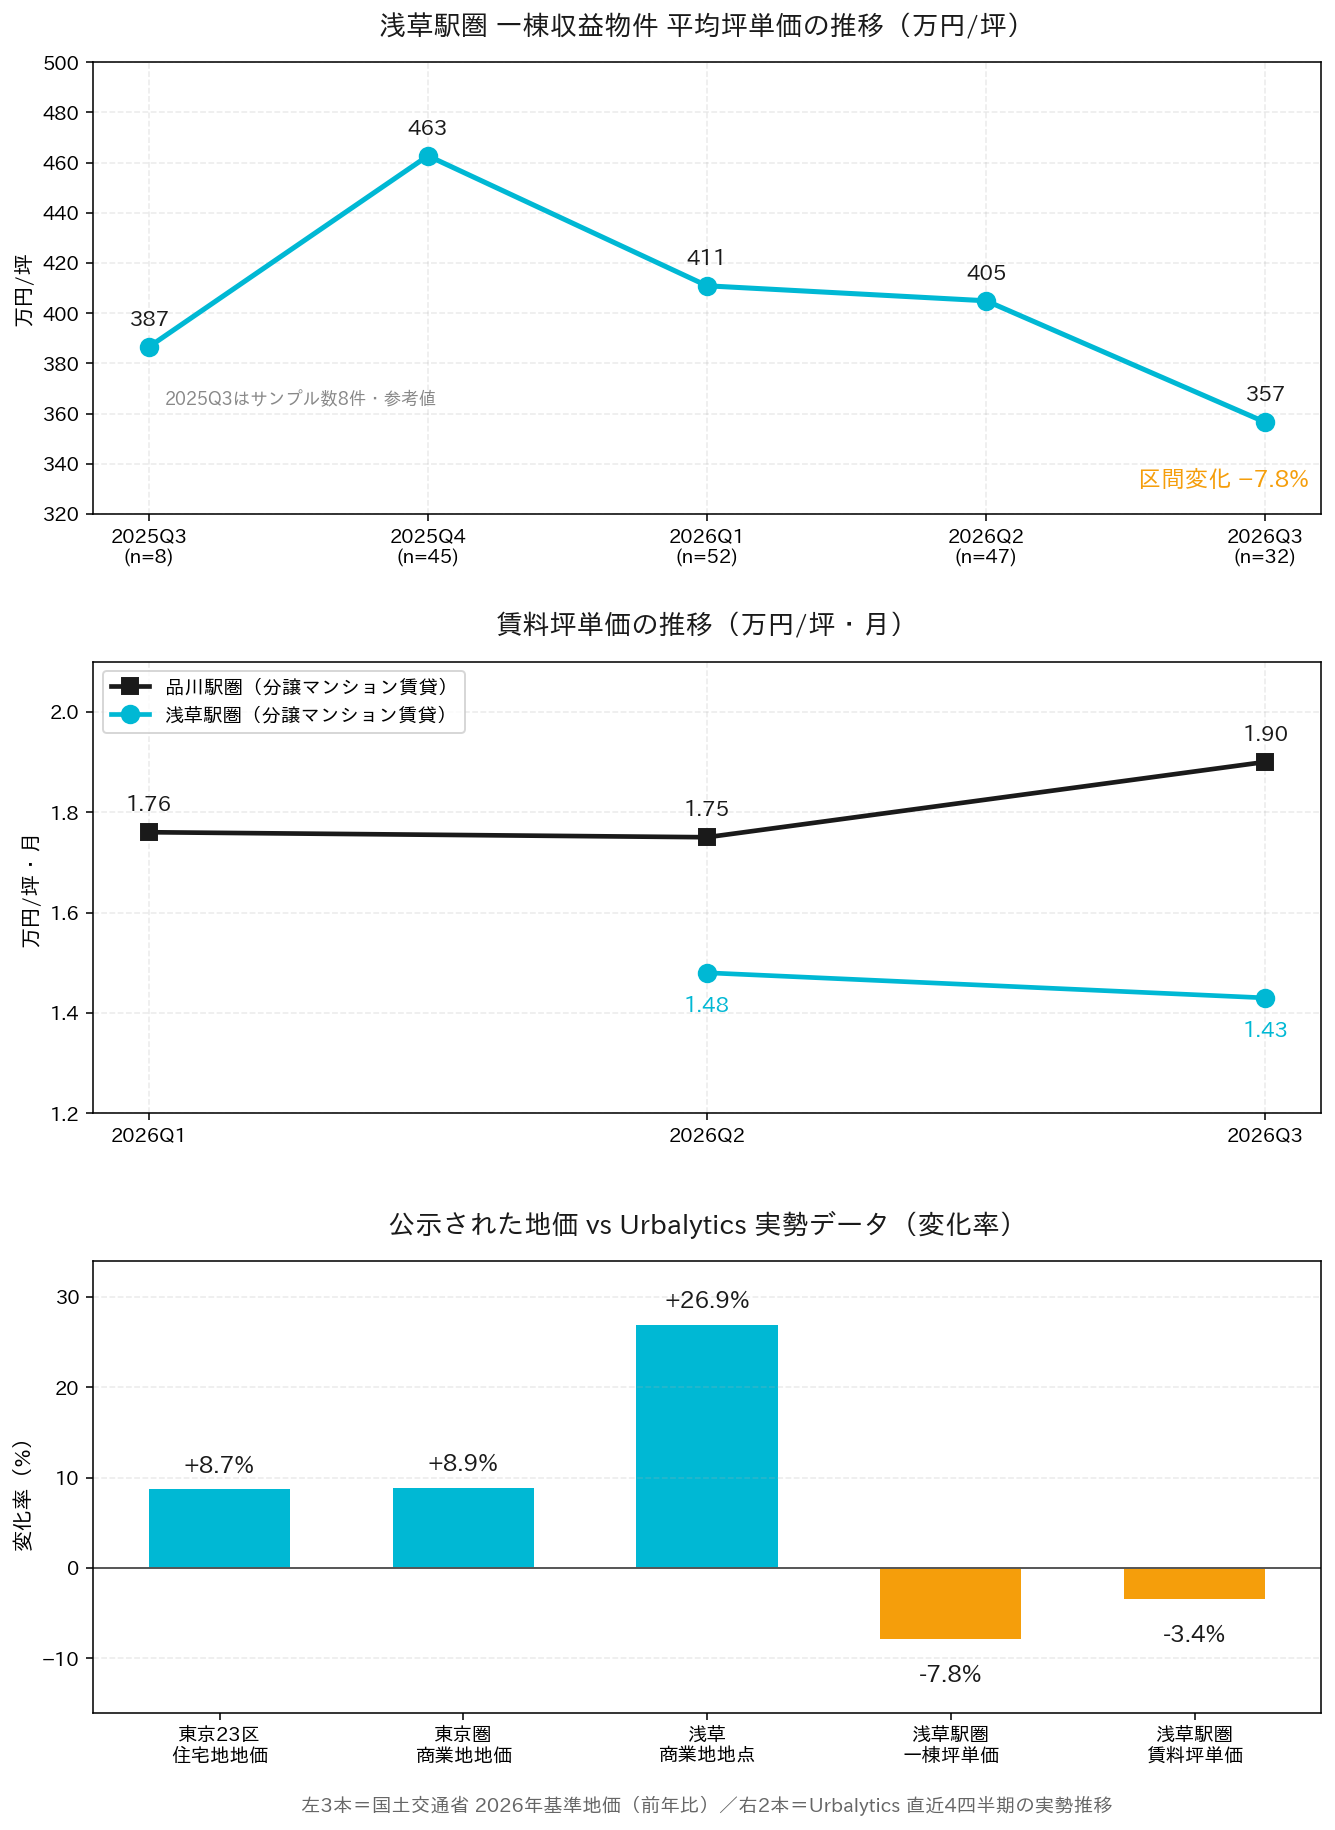
But the trajectory of average price per tsubo is the key: 2025Q4 at JPY 4.6274 million/tsubo, down to 4.1095 million in 2026Q1, 4.0498 million in Q2, and further to 3.5660 million JPY/tsubo in Q3. Over four quarters, that’s a 7.76% decline, or roughly 1.94% per quarter on average.
In other words, in the very neighborhood where published land values printed +26.9%, the unit asking prices of the income buildings actually brought to market have fallen for three consecutive quarters.
The two series are not contradictory—they measure different things. The benchmark land price measures the land itself under highest-and-best-use assumptions, while price per tsubo measures the market ask for the entire asset with an aging structure, legacy leases, and legacy income. When the former is pushed up by inbound-driven commercial expectations while the latter is held back by building age and financing costs, a scissors gap emerges.
Divergence 2: Rents are not paying for the land
The second divergence is on the leasing side, which is the true source of hold-period cash flow.
Urbalytics’ Asakusa station-area condominium rental data show an average monthly rent of JPY 145,700 and an average area of 34.28 m², equivalent to an average rent of about 0.434 ×10,000 JPY/tsubo·month. By quarter, 2026Q2 printed 1.48 ×10,000 JPY/tsubo·month, and Q3 declined to 1.43 ×10,000, a 3.38% drop over the period.
The Shinagawa station area looks slightly better but not strong: average monthly rent JPY 318,800, average rent per tsubo 0.553 ×10,000 JPY/tsubo·month; 2026Q1–Q3 came in at 1.76, 1.75, and 1.90 ×10,000 JPY/tsubo·month respectively. The latest quarter did rebound, but overall it remains a narrow range trade.
Put the three lines side by side and the logic is clear: land is rising, sale prices are softening, and rents are flat to drifting lower.
Urbalytics Insight For hold-to-earn investors, this mix means the numerator and denominator of the gross yield are moving in the same direction but asymmetrically—price per tsubo fell 7.8% over four quarters, while rent per tsubo fell 3.4% in the same period. The net effect is a slight, mechanical uptick in quoted yields, not one driven by operational improvement. The 4.60% median gross yield for whole-building assets in the Asakusa station area should be read against the backdrop of “assessed land values and actual transaction pricing are diverging,” rather than misread as “cheap.”
Note that in the Shinagawa station area there are only 3 on-market whole-building samples (median gross yield 2.41%); the sample is too small to rely on by itself. Likewise, Asakusa’s 2025Q3 price-per-tsubo sample has only 8 observations and is marked as reference.
Divergence 3: Gains are spilling over to the outer rim of the one-metropolis/three-prefectures region
The third divergence is spatial. As core-area gains begin to narrow, demand hasn’t disappeared—it’s spilling over to the periphery.
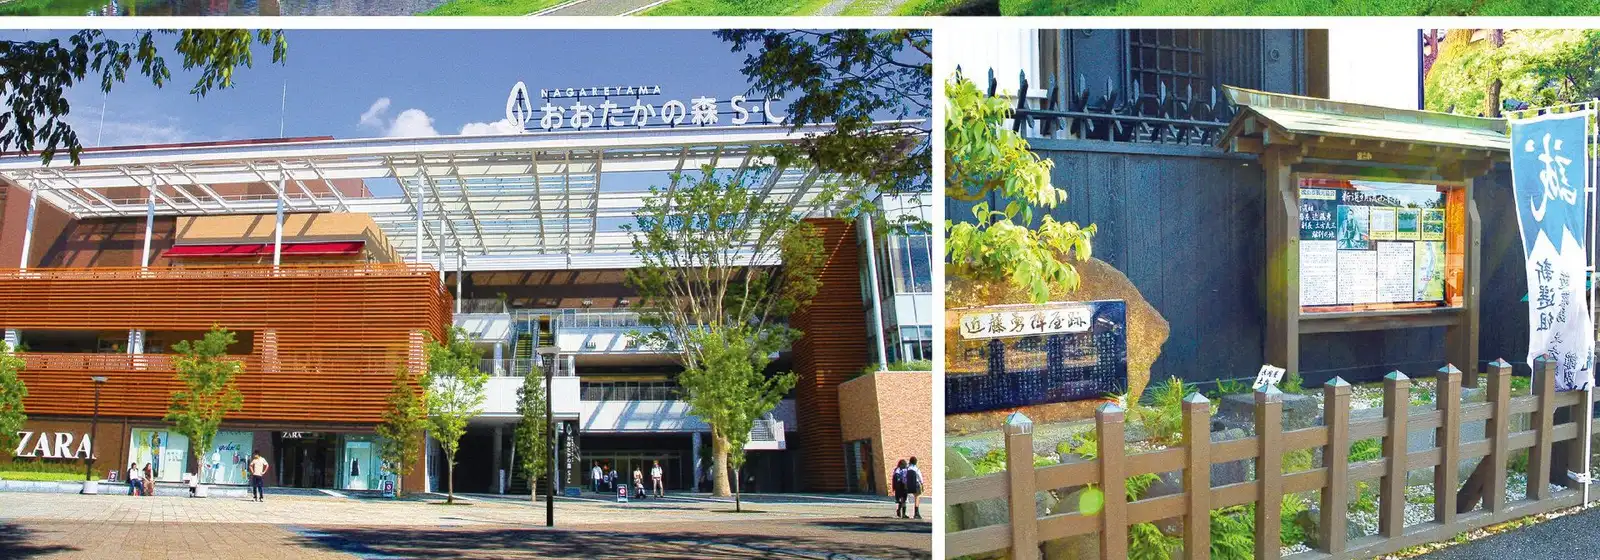
Chiba Prefecture is the clearest case. All-use average rose 3.8%, residential land 3.4%, and most of the top-10 gainers are in Nagareyama City. The top spot is “Nagareyama Higashi-Hatsuishi 3-chome 103-82,” near Hatsuishi Station on the Tobu Urban Park (Noda) Line, up 18.7% and ranking first for the second straight year.
Note that the area around Nagareyama-Ōtakanomori Station has long traded at elevated levels, so demand shifted to the cheaper outer rim—Higashi-Hatsuishi is a product of that logic. The Tsukuba Express (TX) commuting access plus a family-friendly environment provide the underlying power for this diffusion chain.
Kanagawa Prefecture tells a variant of the same story. Residential land rose 3.1%, commercial land 7.2%; among 663 continuously surveyed residential sites, 611 rose and only 3 fell. Kawasaki City rose 4.3%, explicitly attributed to “a sense of relative price advantage versus inner Tokyo.”
Around Hashimoto Station in Sagamihara City, pricing is almost entirely expectation-based—anchored to hopes for a new station on the Maglev Chuo Shinkansen (リニア中央新幹線).
Of course, spillover does not equal safety:
First, the periphery’s large percentage gains partly reflect a low base rather than a structural shift in demand; if interest rates rise and compress affordability, the outer rim is often the first to stall.
Second, while industrial land in Chiba rose 8.0% and has been positive for 14 straight years, the rate has been narrowing from 8.2% two years ago. Appraisers note that rising construction costs are pushing demand “out to cheaper sites”—that is cost-pushed spillover, not demand-pulled spillover.
Investment takeaways: read “land price news” separately from “yield decisions”
The most useful way to read this benchmark land-price release is not to confirm that “Japan real estate is still rising,” but to locate where your segment sits relative to the scissors gap.
For commercial-land assets whose core logic is inbound tourism, Asakusa has already priced expectations into land values, while the actual price per tsubo for buildings is retreating—this implies more room to negotiate on entry than headlines suggest, provided you are comfortable with older structures and operating risk.
For residential assets in the one-metropolis/three-prefectures region, the diffusion logic remains intact, but separate “big percentage gains” from “ample margin of safety”—areas like Higashi-Hatsuishi merit attention, while chasing already-run-up core station fronts may not.
Risk warning The biggest variables remain interest rates and construction costs. In its commentary, MLIT explicitly flags “how future interest-rate trends and rising construction costs will affect land acquisition appetite” as a key focus. If financing costs continue to rise, the first to be pressured will not be assessed land values, but the price per tsubo and absorption speed of income buildings—precisely the direction already visible in the three sets of live-market data cited here.
If you want to overlay land prices, price per tsubo, rents, and yields for a specific station area on a single chart, you can pull that area’s live data directly on Urbalytics by station name—and then decide whether to believe the percentage in the news headline.
#TokyoBenchmarkLandPrices #BenchmarkLandPrice2026 #Tokyo23Wards #Asakusa #KitaShinagawa #Nagareyama #ChibaLandPrices #KanagawaLandPrices #WholeBuildingIncomeProperty #GrossYield #RentPerTsubo #InboundTourism #JapanRealEstateInvestment #TakanawaGateway #Urbalytics
References
1. MLIT, Prefectural Land Price Survey 2026 (Benchmark Land Prices, as of July 1), released September 15, 2026
2. Asahi Shimbun, "Fixed-term lease condos gain attention in central Tokyo; tend to be 10–20% cheaper than for-sale units", 2026, https://news.yahoo.co.jp/articles/893f26a8838042dae017a2d61180a3ef0a47940b
3. TBS NEWS DIG, "2026 benchmark land prices: Strong inbound demand drives sharp gains in Hakuba and Asakusa; Tokyo tops residential land growth for first time in 12 years", 2026, https://news.yahoo.co.jp/articles/8a83fd8f03a64f485dc05d47dfcd1a0bd823a83c
4. TBS NEWS DIG, "2026 benchmark land prices: Asakusa surges on inbound demand, but traditional shops shutter amid soaring land costs", 2026, https://news.yahoo.co.jp/articles/222b2d2d765bae9be8c52b5fc443f7e1c393ceb4
5. Kenbiya, "MLIT releases benchmark land prices: Nationwide land up for 5th straight year; commercial land +2.9%, led by Tokyo and Osaka", 2026, https://www.kenbiya.com/ar/ns/research/china/10538.html
6. Sankei Shimbun, "TX corridor and child-rearing environment boost demand; in Chiba Prefecture, most top residential land gainers are in Nagareyama", 2026, https://news.yahoo.co.jp/articles/0d11bd63ea03e1b163f9a595e62ecf9a4754c427
7. Sankei Shimbun, "Commuting convenience and Shonan lead gains; in Kanagawa, residential land up, commercial land lifted by inbound demand", 2026, https://news.yahoo.co.jp/articles/1d8de9ef7b4c12cd37092e4dfa3e9491f20a9bad
8. Reuters, "2026 nationwide benchmark land prices +1.5%, fifth straight annual gain, reflecting moderate economic recovery", 2026, https://news.yahoo.co.jp/articles/b90ac3cf6362711079fcb59a17de39486c5b2aaa
9. Urbalytics platform data (Asakusa & Shinagawa station areas: rent_stats / building_cap_rate_stats), retrieved September 15, 2026, https://www.urbalytics.jp
Copyright: This article is original content by the author. Please do not reproduce, copy, or quote without permission. For usage requests, please contact the author or this site.
Photos in this article: Asakusa Senso-ji 2021-12 ac Asturio Cantabrio/CC BY-SA 4.0(トリミング) Wikimedia Commons·東武浅草駅20210327-IMG 2 くろふね/CC BY 4.0(トリミング) Wikimedia Commons·Nagareyama montage User:京浜にけ User:Akitoishii User:Saigen Jiro User:Otherde くろふね User:JACHZI/CC BY-SA 4.0(トリミング) Wikimedia Commons·Shinagawa Station - Aimaimyi/CC BY-SA 3.0(トリミング) Wikimedia Commons