Words: 634 | Estimated Reading Time: 4 minutes | Views: 294
BOJ Hikes to 1.25%: Cap Rate Spread Under Pressure
Policy Rate at 1.25%
On September 18, 2026, the Bank of Japan raised its policy rate from 1.0% to 1.25%, the highest level since 1995. The 25-basis-point increase is the largest single move in the current tightening cycle.
The impact on mortgage payments is immediate. A 35-million-yen, 35-year loan at 1.0% costs about 99,800 yen per month. At 1.25%, the monthly payment rises to about 102,900 yen, an increase of roughly 4,000 yen. Fixed-rate mortgages now hover near 4%, and the gap with the policy rate continues to widen.
Market expectations suggest the tightening cycle is not over. Multiple institutions forecast one to two more hikes within the fiscal year, with a terminal rate of 1.75% to 2.0%.
How Rate Hikes Transmit to Real Estate Investment
Policy rate changes affect real estate investment through two transmission channels.
The first is purchasing power. Higher rates mean the same monthly payment covers a smaller loan principal, compressing buying capacity. This channel affects residential buyers most directly and gradually transmits to price expectations.
The second channel matters more for income property investors: the spread between cap rate and financing cost. As the policy rate rises, financing costs climb. If the cap rate on a property stays flat, the investor's net return erodes. This spread is the core safety margin for income property investment.
Using urbalytics income property data, investors can check cap rate levels by station to assess how much spread remains.
Three-Station Cap Rate Spread Analysis
Pulling data from urbalytics's income property analysis, the cap rate performance across Shibuya, Shinjuku, and Shinagawa shows significant divergence.
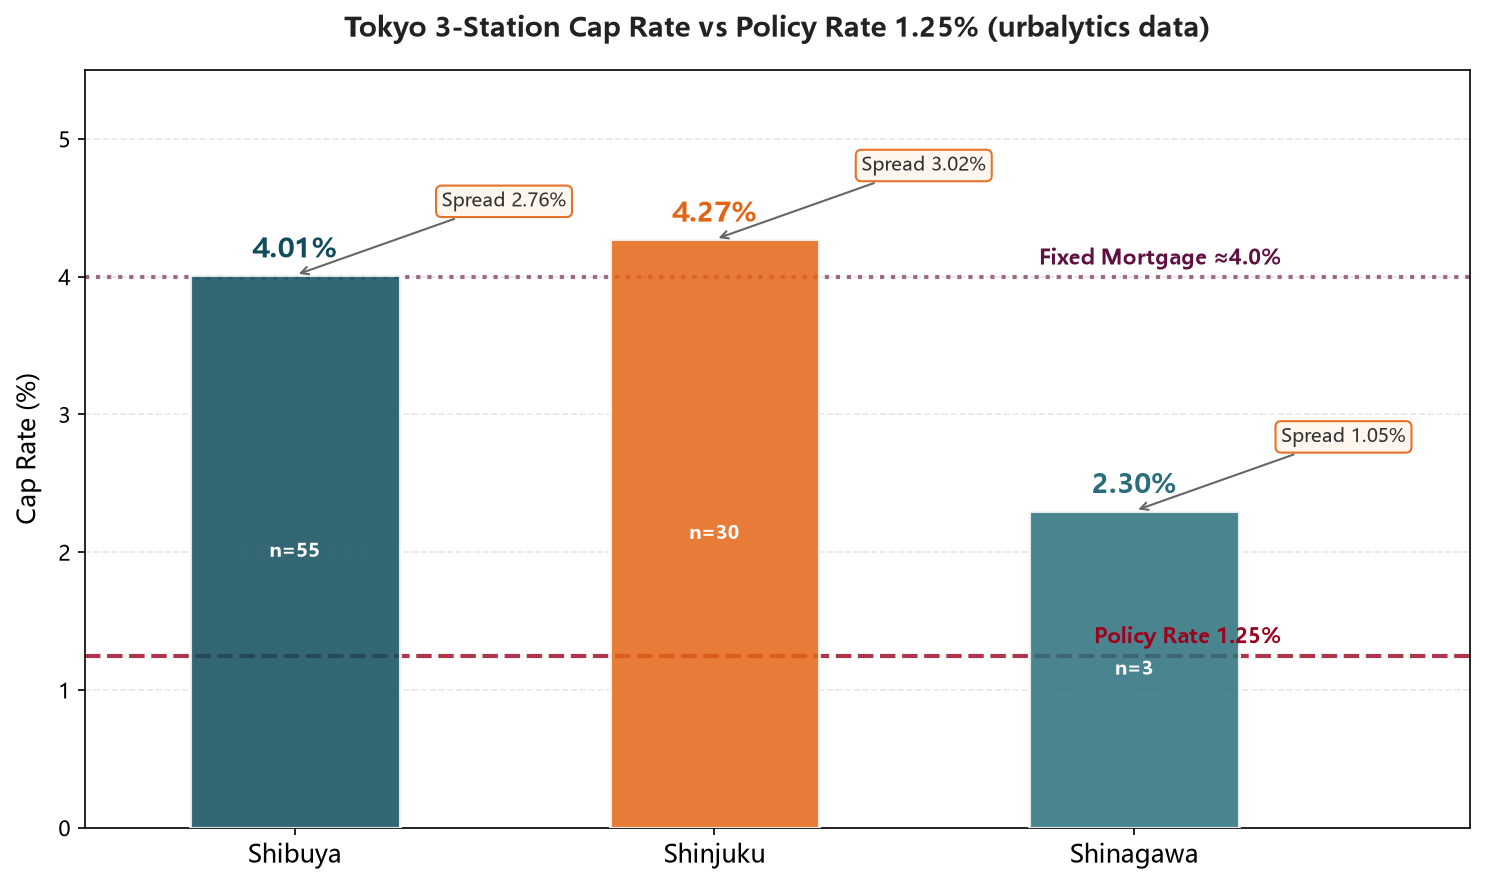
Shibuya has 55 listings with an average cap rate of 4.01% and a median of 3.5%. Shinjuku has 31 listings (excluding one outlier priced at 1 yen), with a median cap rate of 4.27%. Shinagawa has only 3 listings, averaging 2.30%.
The spread structures differ across the three stations. Shibuya and Shinjuku have cap rates around 4%, giving a spread of roughly 2.7 to 3.0 percentage points over the 1.25% policy rate, and roughly matching the 4% fixed mortgage rate. Financing an income property purchase with a fixed-rate loan means the rental yield barely covers the financing cost, leaving a very thin net spread.
Shinagawa's sample is too small. The 2.30% cap rate is likely skewed by high-priced, low-yield properties and is not statistically representative. When analyzing by station, small sample sizes distort averages, and readers should always check the listing count alongside the rate.
Signals from the Rental Side
The denominator of cap rate is income (annual rent), and the numerator is price. Rising rates pressure prices, but if rents hold firm, cap rates need not deteriorate.
Shibuya's apartment rental data provides a reference: 500 listings, an average unit rent of 6,188 yen per square meter per month, and a year-over-year change of -0.94%. Rents are slightly declining, though the magnitude is small. If rents remain flat or dip slightly, cap rate support must come from the price side.
A previous Tokyo rent analysis noted that rent trends diverge significantly across stations. During a rate-hiking cycle, markets where rents do not rise in step will see more cap rate pressure.
What Investors Should Watch
In a tightening cycle, income property investors should monitor two metrics: the spread between cap rate and financing cost, and the direction of rents.
The property valuation tool can simulate returns under different rate scenarios, helping assess whether current prices still offer a safety margin.
The current hiking cycle is ongoing. If the terminal rate expectation of 1.75% to 2.0% materializes, fixed mortgage rates could rise above 4.5%. At that point, properties with a 4% cap rate would face negative net returns. The direction of spread compression is clear; the pace depends on subsequent rate decisions.
Copyright: This article is original content by the author. Please do not reproduce, copy, or quote without permission. For usage requests, please contact the author or this site.
Photos in this article: Shibuya Station North 2 ノーマルエディタ/CC BY-SA 4.0(トリミング) Wikimedia Commons·JRE Shinjuku-STA South MaedaAkihiko/CC BY-SA 4.0(トリミング) Wikimedia Commons