

Sengawa Station income buildings market report
Record counts, unit-price trend and the gap against the Tokyo average, aggregated monthly by Urbalytics for income buildings listed around Sengawa Station. Latest month: September 2026.
Sengawa-Sta·Nyao148/CC BY-SA 3.0 (cropped)·Wikimedia Commons
Sengawa Station income buildings|overview
#Counts are listings of income buildings whose nearest station is Sengawa Station (on the market and closed alike). The commentary is derived mechanically from the figures on this page.
income buildings: gross yield over time
#Gross yield = annual income ÷ asking price, before operating costs and vacancy. With rent held constant, a falling yield means a rising price.
No data
Gross yields for Sengawa Station do not clear the publishing bar.
Conditions
- Source: listings Urbalytics collects (on the market and closed)
- Publication threshold: figures shown only for months with 10 or more records
- Statistic: median (P20–P80 is the 20th to 80th percentile). Outliers removed by the IQR method
- In a thin month (10–30 records) both the median and the P20–P80 band move on a single listing. Read them alongside the record count shown next to each figure.
- Period: from 5 2026 — the window over which each property type is aggregated independently
Asking rent and unit size for income buildings
#Rent (total) = monthly rent + common charges; rent per ㎡ is that divided by area. Unlike an asking price, rent is what is actually being paid, so it works as the numerator of a yield. Area is the variable that separates the total from the unit figure.
Sign up free to see all the data
Detailed distributions and trends are available on a free account.
income buildings: listings over time
#Record count is market depth. Fewer records means less to choose from; more means the buyer has more room to negotiate.
Sign up free to see all the data
Detailed distributions and trends are available on a free account.
Figures on this page are derived statistics: monthly aggregates of listing and rental-offer data collected by Urbalytics. They are not individual transaction records.
Income building prices at stations near 仙川駅
Nearest to 仙川駅 first, by straight-line distance. The list can cross prefecture borders.
- Tsutsujigaoka Station39,731/day3 types64September 2026
- Chitose-karasuyama Station77,686/day4 types110September 2026
- Shibasaki Station16,243/day3 types32September 2026
- Roka-koen Station13,515/day3 types44September 2026
- Seijogakuen-mae Station78,145/day3 types86September 2026
- Kokuryo Station32,622/day3 types63September 2026


Station photographs from Wikimedia Commons (author and licence are given on each station’s own report page).
Income building prices in Chofu and nearby areas
First Chofu, where Sengawa Station is, then the nearest municipalities. Distance is measured between municipality centres.
- 調布市This area25September 2026
- 三鷹市3.0km12September 2026
- 狛江市3.3km10June 2026
- 川崎市多摩区4.2km31September 2026
- 武蔵野市5.4km12September 2026
- 稲城市6.1km—
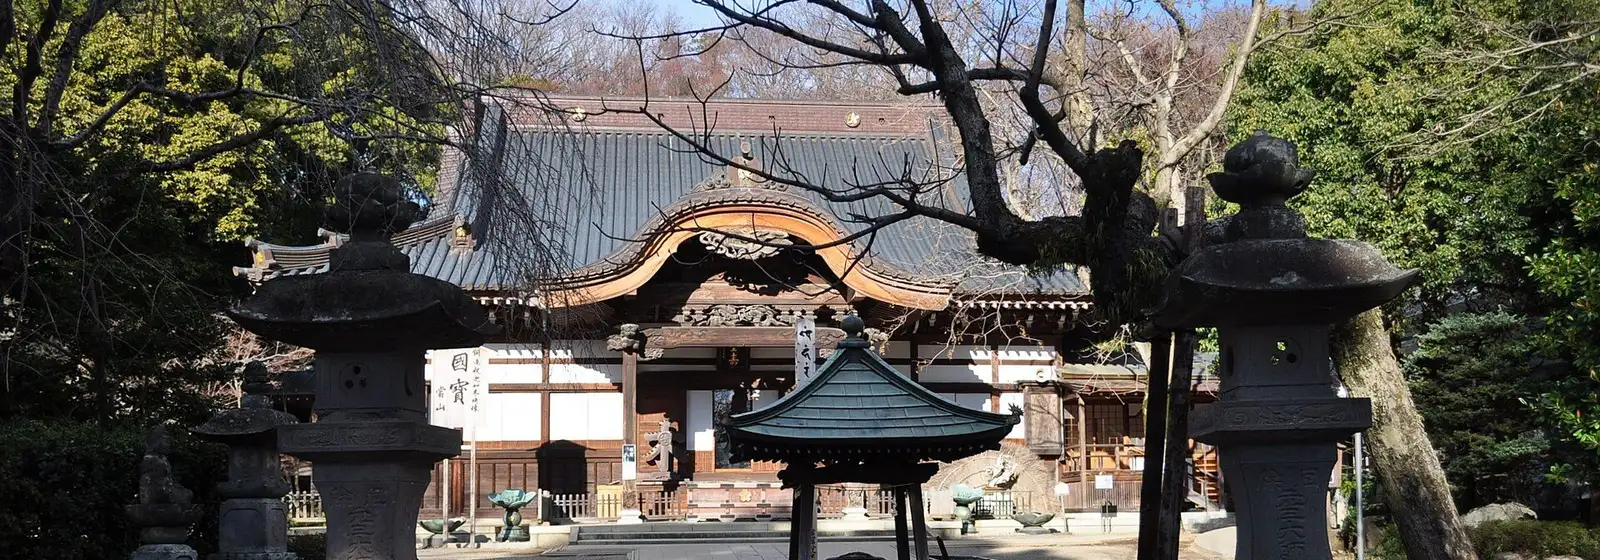

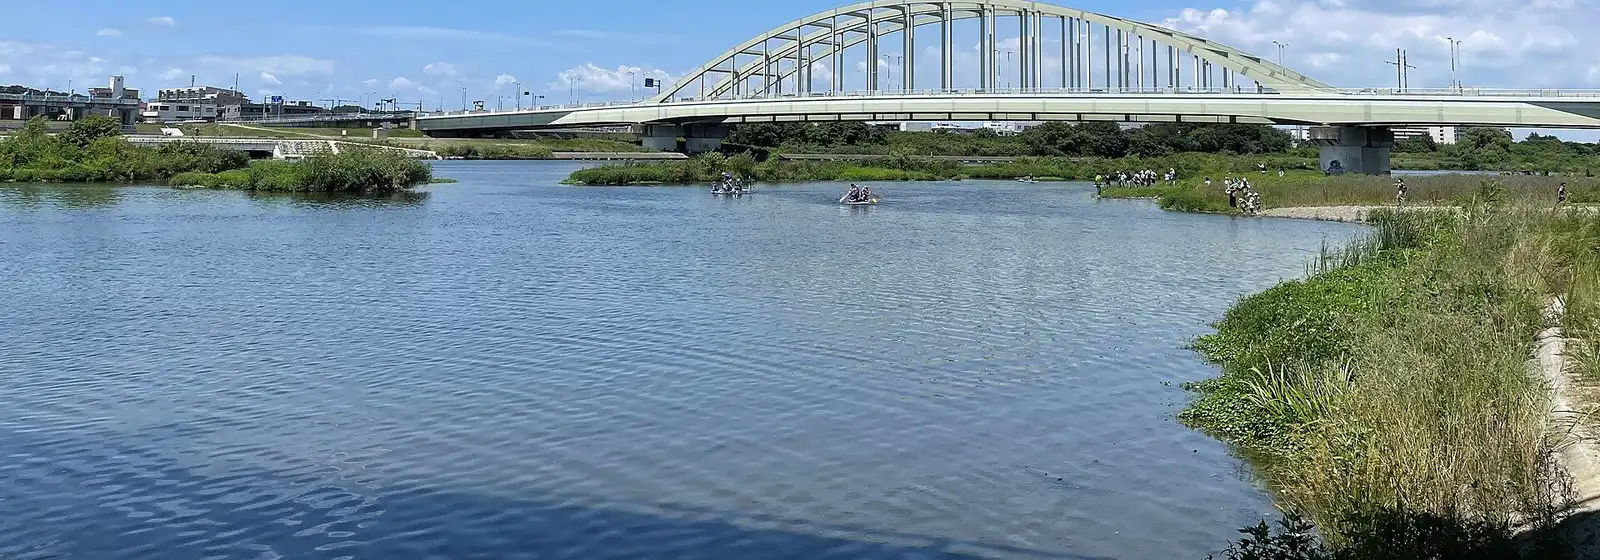
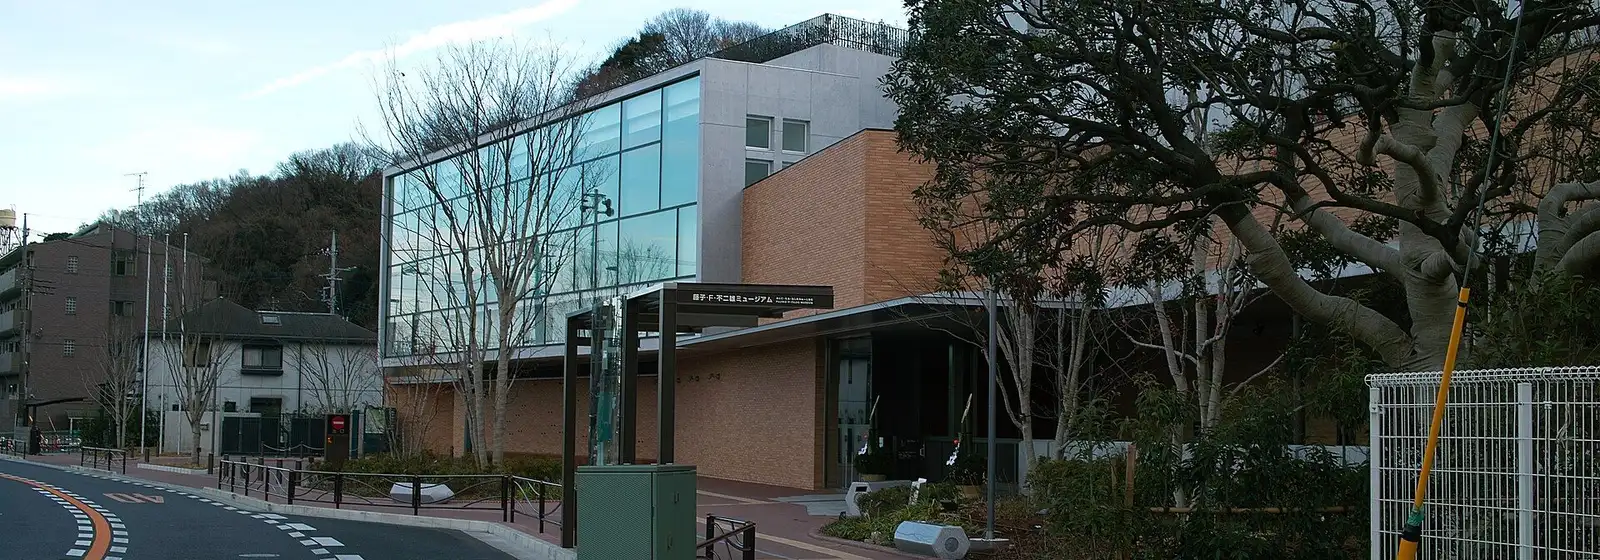
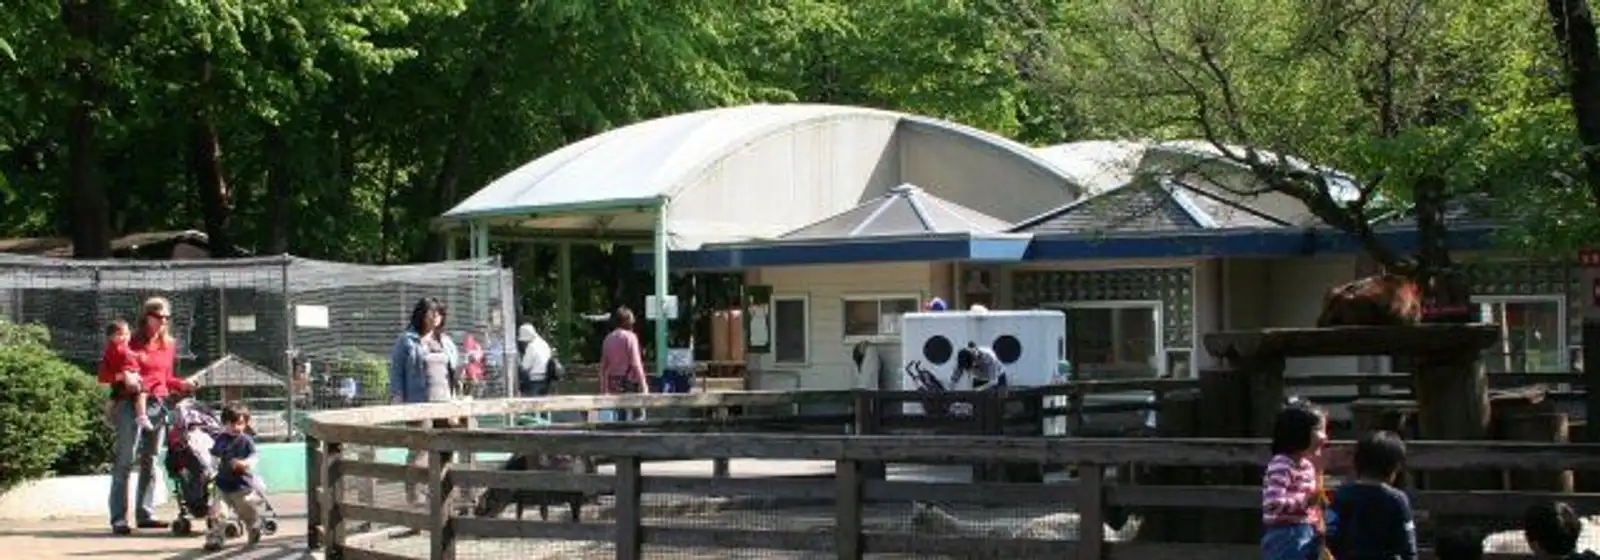
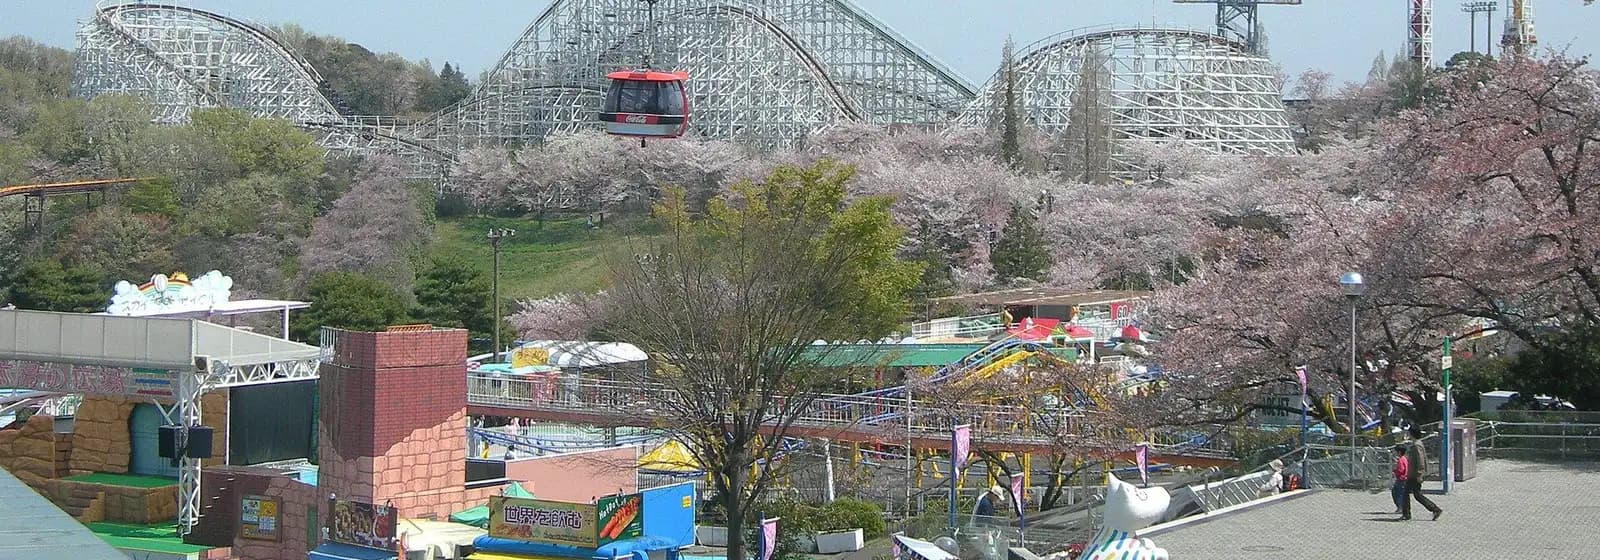
Area photographs from Wikimedia Commons (author and licence for each are given on that area’s own report page).
Prices by postal code near Sengawa Station
Nearest to Sengawa Station first, by straight-line distance. Counts are sale and rental records across the period.
- 調布市仙川町0.2km〒182-0002289
- 調布市若葉町0.5km〒182-0003161
- 世田谷区上祖師谷0.6km〒157-0065420
- 世田谷区給田0.7km〒157-0064348
- 調布市緑ケ丘0.8km〒182-0001135
- 調布市東つつじケ丘1.1km〒182-0005158
- 調布市入間町1.1km〒182-0004159
- 世田谷区南烏山1.4km〒157-00621,080


Area photographs from Wikimedia Commons (author and licence for each are given on that area’s own report page).
Articles on Chofu
Urbalytics analysis written about the area Sengawa Station sits in (Chofu).
Find income buildings in Sengawa Station
Individual listings, price-change history, closed transactions and AI valuations are available on a free account.