Words: 1304 | Estimated Reading Time: 7 minutes | Views: 2053
The homebuying threshold in Tokyo’s 23 wards has pushed nine in ten prospective buyers into the JPY 10 million-plus household income bracket, while real opportunities are being reshuffled in the yield spread between city and suburbs.
A newly released survey has pierced the unspoken truth of the 23-ward market. From July 1 to 12, 2026, Style Act, operator of the well-known real estate information platform Sumai Surfin, surveyed registered members who had visited new condominium sales galleries in the past three months, collecting 209 valid responses from a base of 330,000 members.
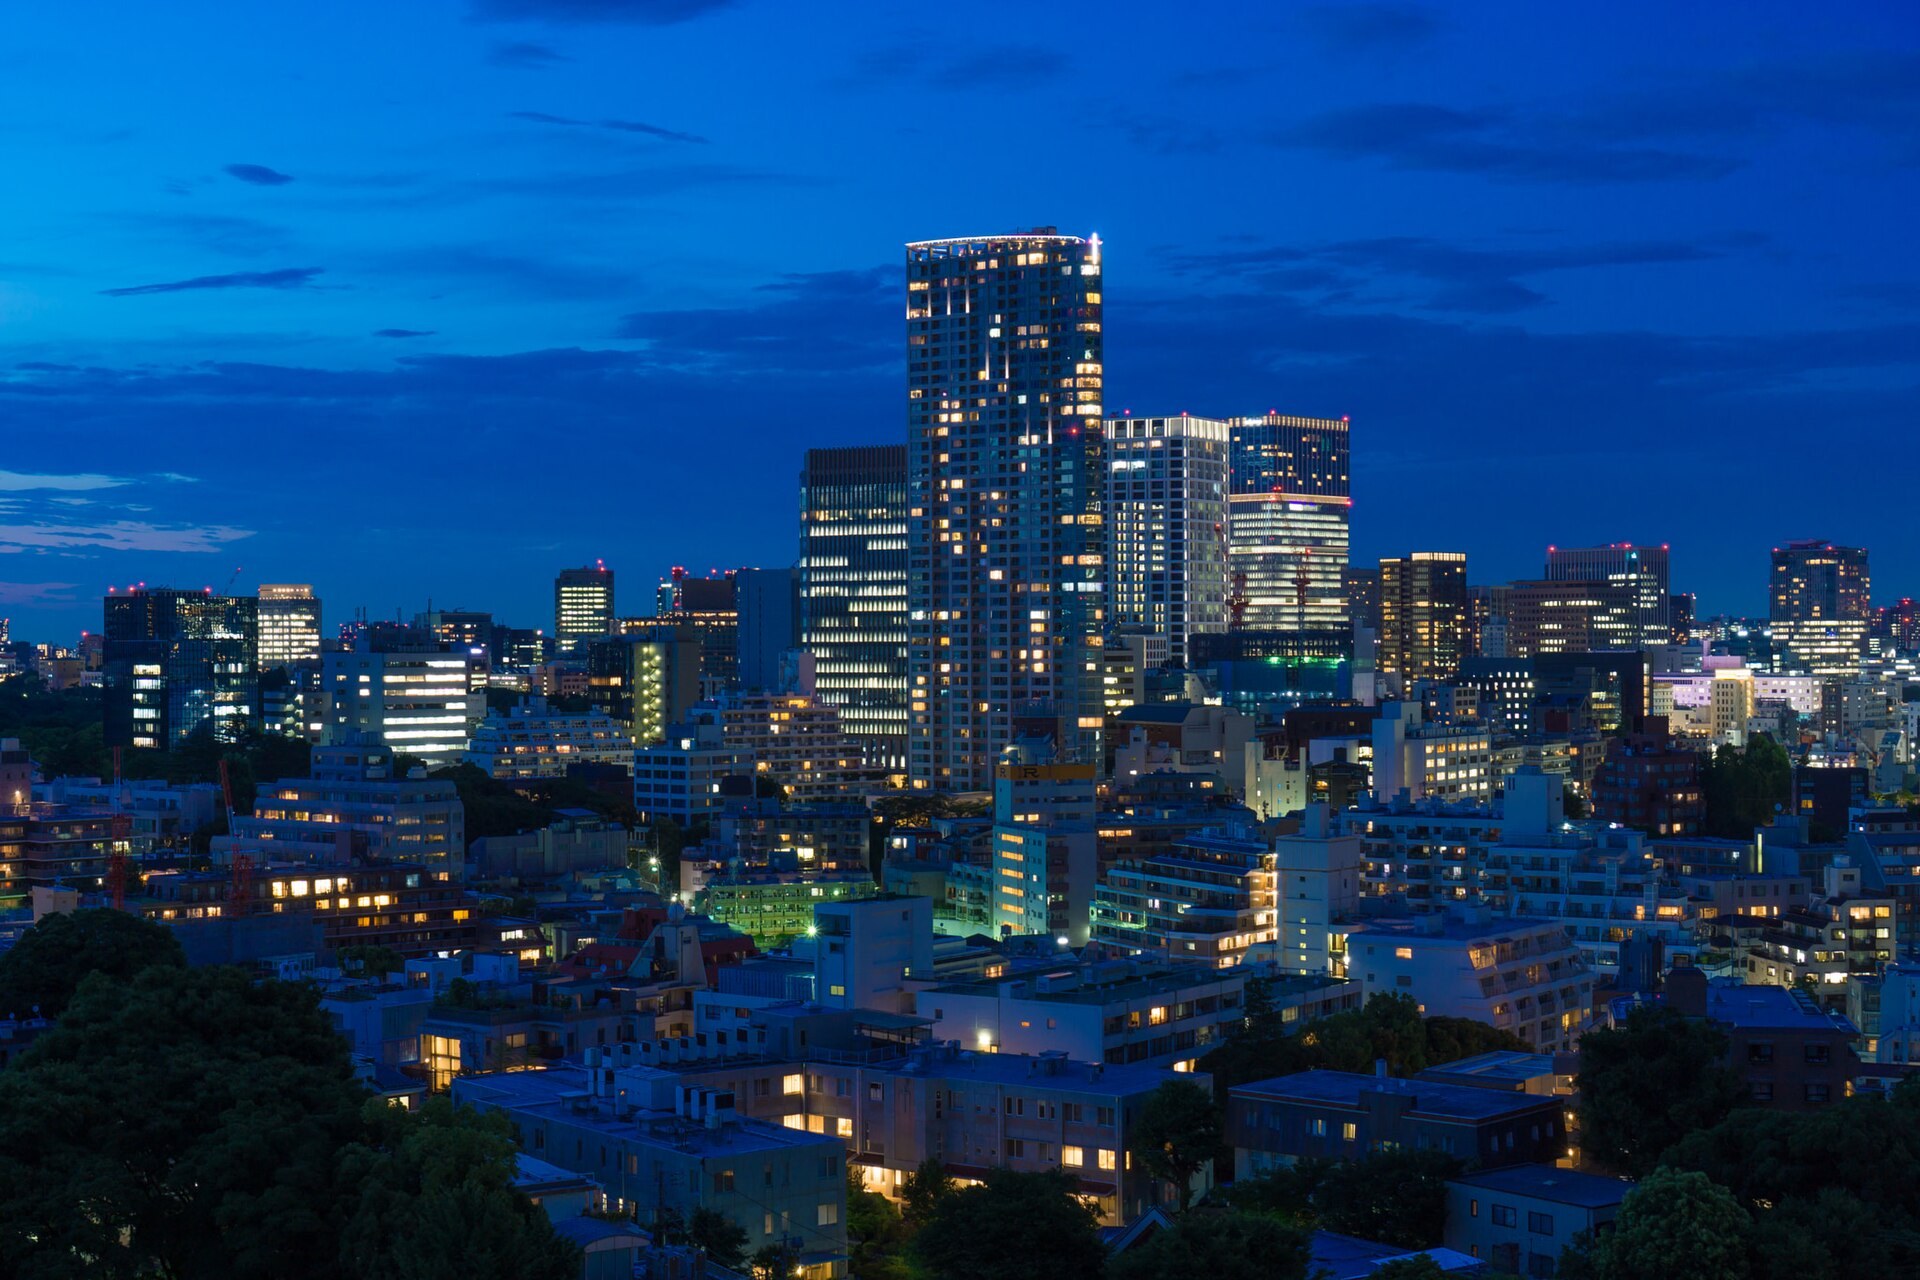
The question was simple: What household annual income is now “enough” to buy a condominium in the 23 wards? 91.3% answered “JPY 10 million or more.” The figure is striking on its own, but the breakdown is what makes you sit up—56.9% said JPY 15 million or more, and 30.6% said JPY 20 million or more. Roughly one in three prospective buyers walking out of the model room believes, “Without JPY 20 million in household income, don’t come to the 23 wards.”
JPY 100 million: from “luxury threshold” to “standard option”
If income perceptions are subjective, budget numbers are not. Among prospective buyers focused on the 23 wards, the share targeting a purchase price of JPY 100 million or more jumped from 37.2% (July 2024) to 62.2% (July 2026). In two years, that share nearly doubled.
This leap matters. Back in 2024, the “JPY 100 million condo” was still headline fodder—essentially a tag for tower units in the central three wards. By 2026, it has become the default starting line for 23-ward purchase discussions—over 60% now anchor their mental price point at JPY 100 million and up.
Crucially, this isn’t buyers getting richer; it’s options disappearing. As sub–JPY 100 million new-build inventory in the 23 wards has been absorbed and developers concentrate resources on prime, higher unit-price sites, the “desired price band” has been forced upward by supply structure. Once this line moves up, it rarely comes back down.
80% of middle-income households are already looking beyond the 23 wards
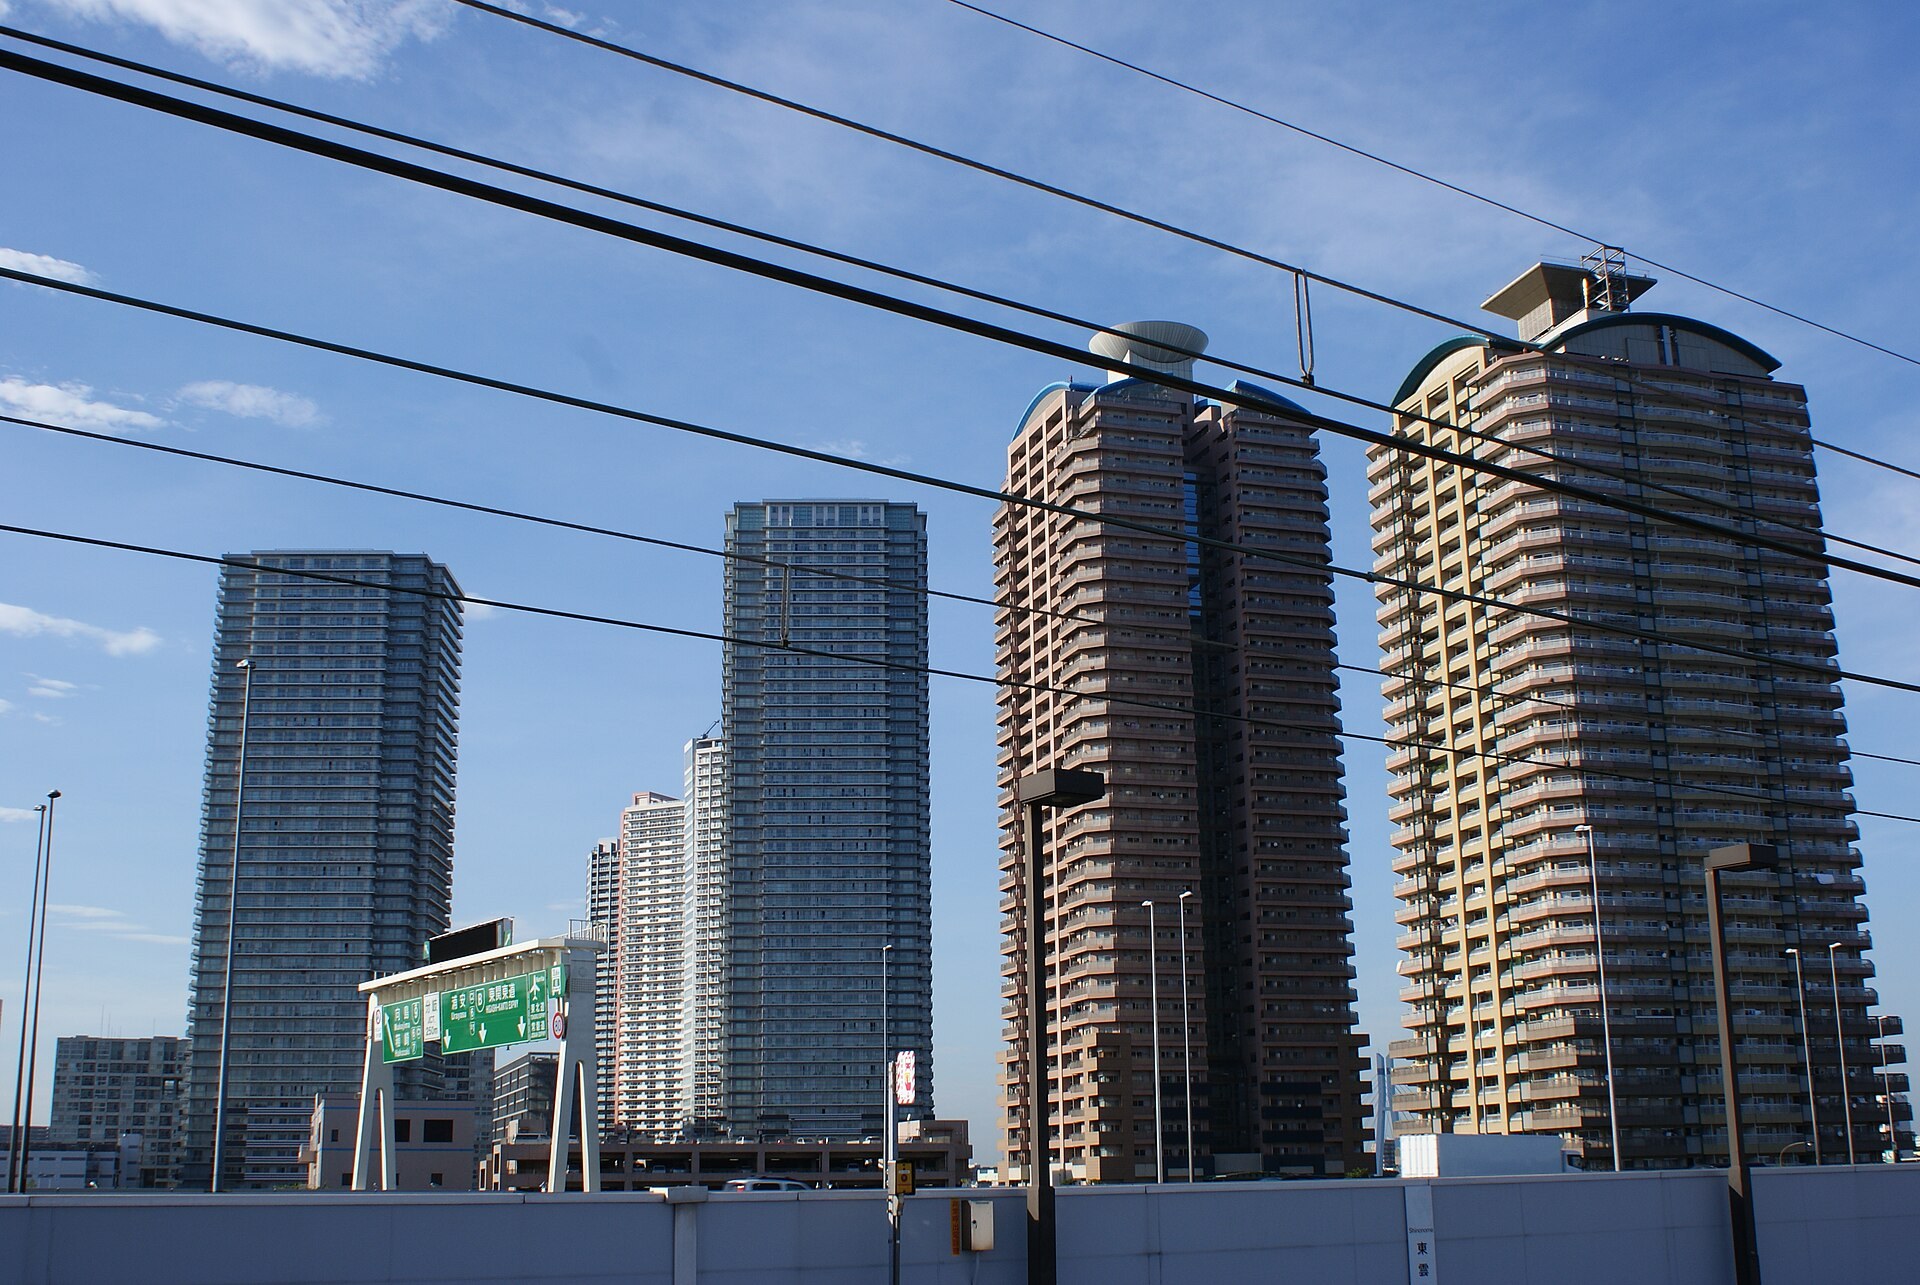
The most actionable finding sits in the back half of the survey: Among respondents with household income below JPY 10 million, about 80% are now considering properties outside the 23 wards; and of those “stepping out,” one in four explicitly said they have adjusted to “slightly farther out.”
In market terms: a sizable demand pool is being systematically pushed out of the 23 wards and is landing at near-suburban nodes in Tama, Chiba, Saitama, and Kanagawa. This is not the disappearance of purchasing power; it is the migration of purchasing power.
For investors, that migration path matters far more than the headline “the 23 wards rose again.” The displaced cohort—dual-income households earning JPY 8–10 million—are precisely the highest-quality renters: lowest default risk and longest tenure. Where they move, rental support thickens.
By the numbers: suburban yields are a full two percentage points fatter than the core
Surveys capture intent; whether intent becomes price requires real transaction and rental data. We pulled real-time data from the Urbalytics platform for four representative station areas in the core and near suburbs. The result is straightforward.
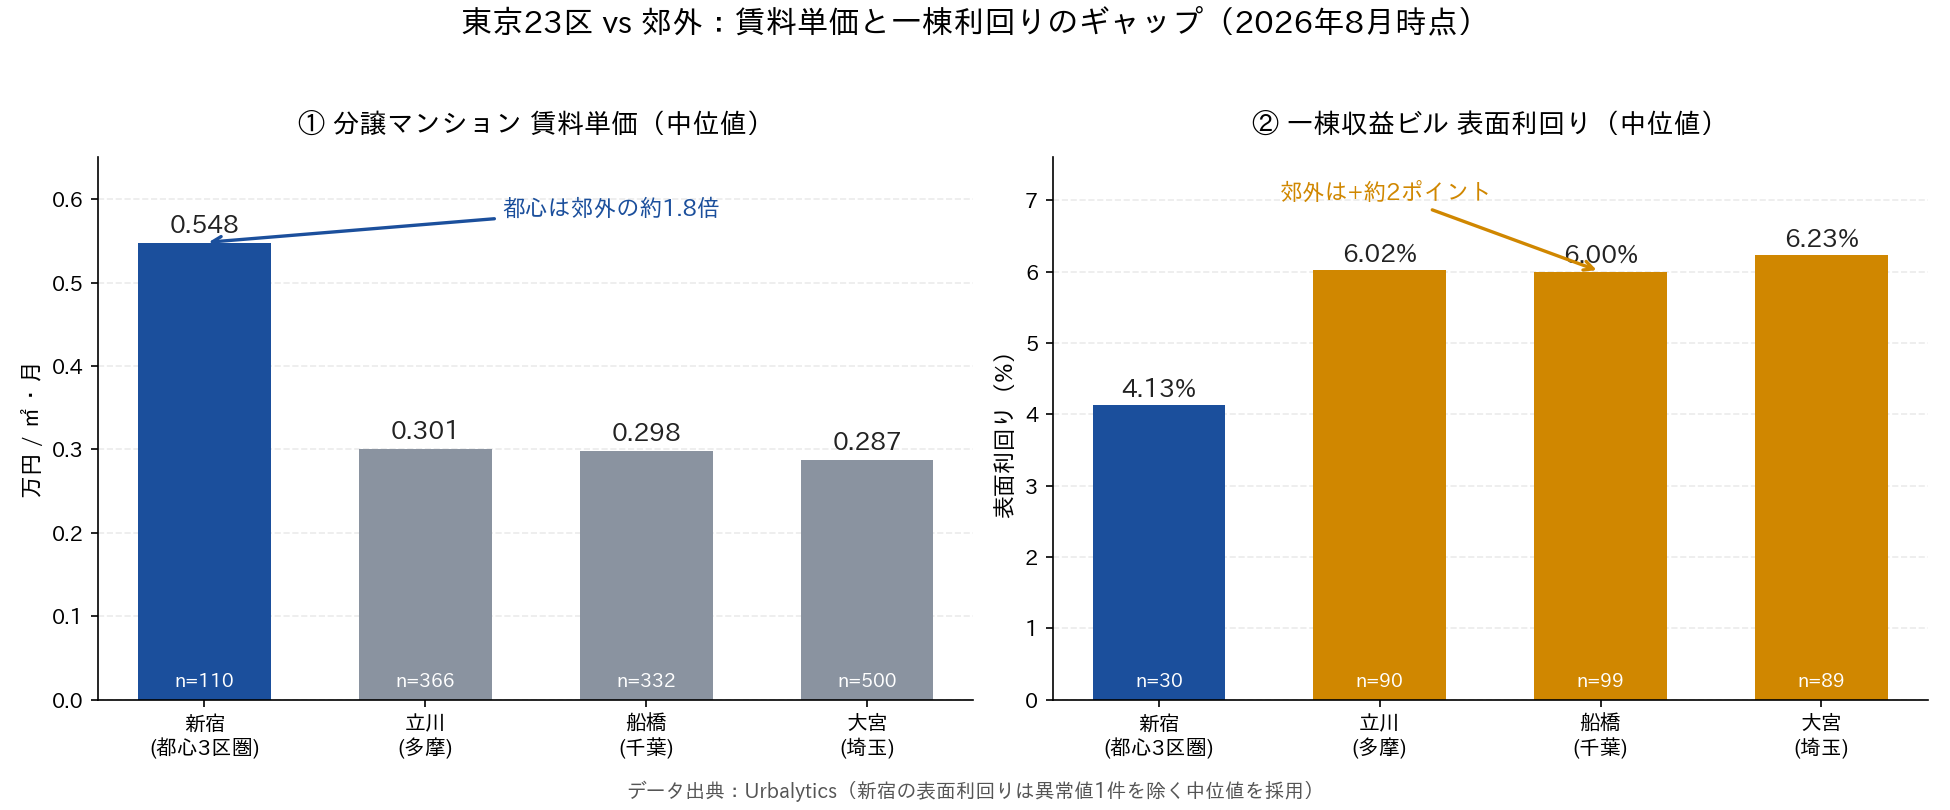
On the rental side: using the median monthly rent unit price for for-sale condominiums (10,000 JPY/sqm), Shinjuku’s ring is 0.548, while Tachikawa is 0.301, Funabashi 0.298, and Omiya 0.287. Core-area rent per sqm is roughly 1.8x these three near-suburban hubs—significant, but not enough to bridge the gulf in acquisition prices.
On the yield side, the story flips. Using the median gross yield for whole-building income properties: Shinjuku’s ring is just 4.13%, versus 6.02% in Tachikawa, 6.00% in Funabashi, and 6.23% in Omiya. The near suburbs are a full ~2 percentage points thicker than the core.
Urbalytics Insight The value of Urbalytics’ internal data is exactly here: Shinjuku’s average yield was severely distorted by an outlier listing with a mis-entered price (JPY 10,000). A naïve average would lead to absurd conclusions. The platform preserves the full distribution (30 samples; min 2.36%, median 4.13%), allowing the median to recover the true level. Public reports quote averages; internal databases preserve distributions—and investment decisions are made in distributions, not in means.
A two-point yield spread can make or break a deal in today’s financing environment. With JPY 100 million in equity and 2x leverage, two points translate into roughly JPY 4 million in annual cash flow difference—enough to absorb the incremental debt-service pressure from rising rates.
This is why, while media chase the JPY 20 billion penthouse at Azabudai Hills, professional buy-side capital has already shifted quietly along the Chuo and Sobu lines.
Bifurcation isn’t a trend; it’s already a fact
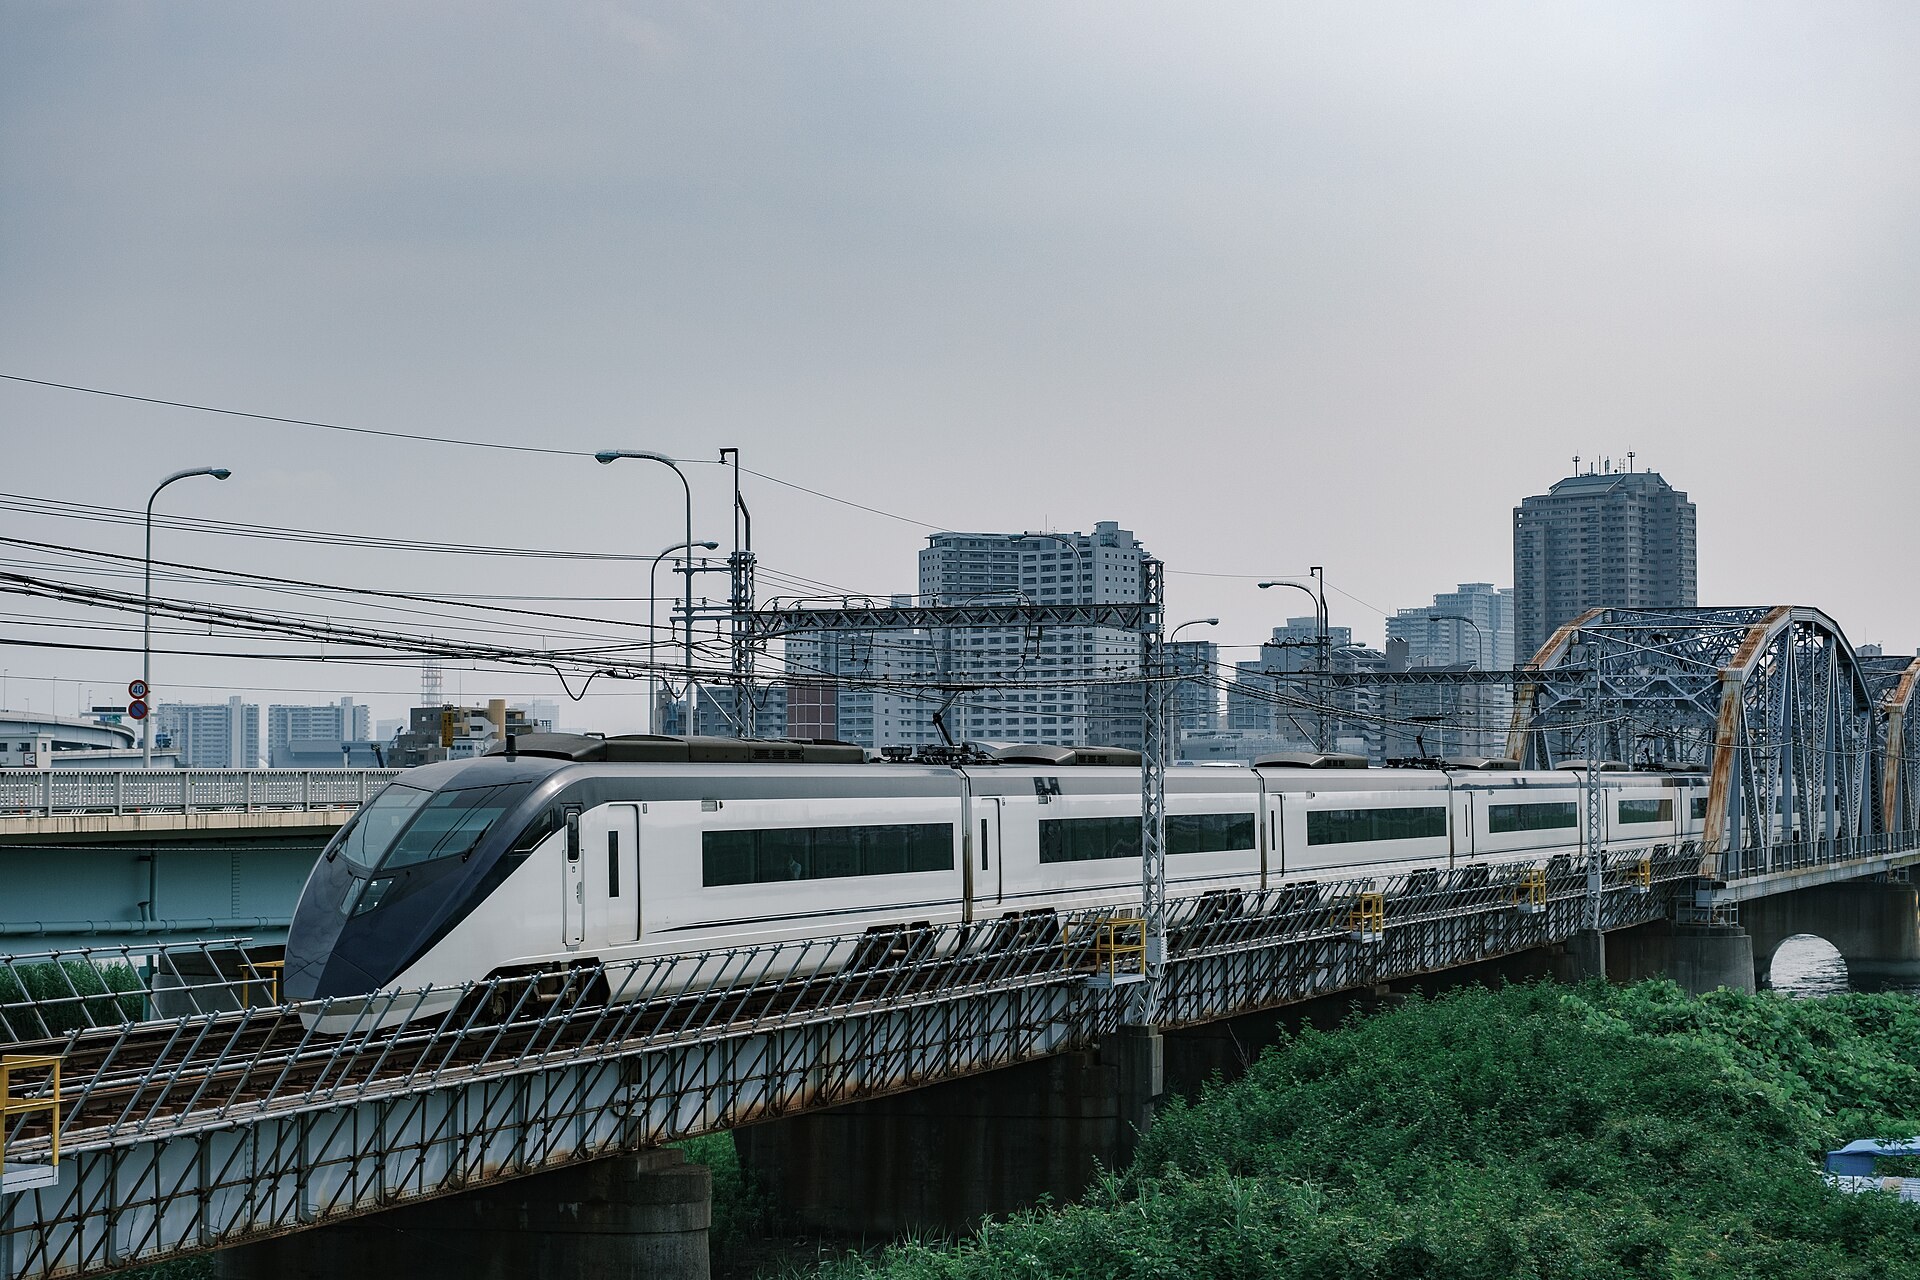
Connecting the dots, the Greater Tokyo residential market in summer 2026 shows a clear dual-track structure:
First, within the 23 wards the market continues to move upmarket. Buyer mix is shifting from “owner-occupier led” to “asset preservation and international capital led.” JPY 100 million is the default starting point; JPY 20 million in household income is the practical line for 30% of respondents. Prices here are defined by scarcity, not by affordability, making this market far less rate-sensitive than most assume.
Second, the near suburbs are absorbing displaced end-users, gaining rental resilience as a result. With 80% of sub–JPY 10 million households looking outside the 23 wards, hubs like Tachikawa, Funabashi, and Omiya are seeing their rental demand base thicken. Median yields holding above 6% are the income-side reflection of that depth.
Risk factors Two variables must be faced squarely. Rates: the survey explicitly cites the “twin impact of price inflation and rising interest rates.” Japan is emerging from a three-decade low-rate era. A 6% suburban yield looks cushioned, but another 150 bps of funding-cost increase would thin that cushion quickly. Rent lag: the spillover of demand into realized rent often takes 12–24 months. Investors buying the near suburbs now are effectively paying today for a rental curve that has not fully materialized.
Two takeaways for cross-border investors
For overseas investors watching Tokyo across time zones, the most useful part of this survey is not the obvious “the 23 wards are expensive,” but that it pinpoints where demand fractures: at JPY 10 million household income.
Above that line, the logic is asset allocation—scarcity, FX, and liquidity. Below it, the logic is housing cost—commute time, rent-to-income, and supply elasticity. Applying a single valuation framework to both is a common cross-border mistake.
If your strategy is long-term hold and income, today’s yield levels at near-suburban hubs plus the direction of demand spillover create a rare setup. If your strategy is capital preservation and intergenerational transfer, the scarcity premium in first-tier 23-ward locations still holds—just don’t try to justify it on yield; that has never been its pricing logic.
Whichever side you choose, start with the local rent distribution and yield percentiles, then talk price. Urbalytics’ area comparison and yield modeling tools are built to make this step analytical, not intuitive.
#Tokyo23Wards #BuyingInTokyo #JapanRealEstateInvestment #100MillionYenCondo #HouseholdIncome #GrossYield #SuburbanShift #Tachikawa #Funabashi #Omiya #Shinjuku #GreaterTokyoCondos #JapanProperty #CrossBorderInvestment #Urbalytics
References
- LASISA / Yahoo! News, 2026, “[Tokyo 23 wards] Condominium purchases: 30% say a household income of JPY 20 million or more is necessary… With soaring prices, 60% of prospective buyers choose ‘over JPY 100 million,’ and signs of a ‘suburban shift’ as well.” https://news.yahoo.co.jp/articles/23bb84ee6e739a1183d937392eb9703beb22d9b1
- Style Act Inc., “Sumai Surfin,” 2026, Survey of prospective new condominium buyers (conducted July 1–12, 2026; 209 valid responses; 330,000 registered members). https://www.sumai-surfin.com/
- Urbalytics platform data (internal), 2026, Rental statistics for for-sale condominiums and gross yield statistics for whole-building income properties across the station areas of Shinjuku, Tachikawa, Funabashi, and Omiya. https://www.urbalytics.jp/
Copyright: This article is original content by the author. Please do not reproduce, copy, or quote without permission. For usage requests, please contact the author or this site.