Words: 1159 | Estimated Reading Time: 6 minutes | Views: 111
Policy Rate at 1.25%: Highest Since 1995
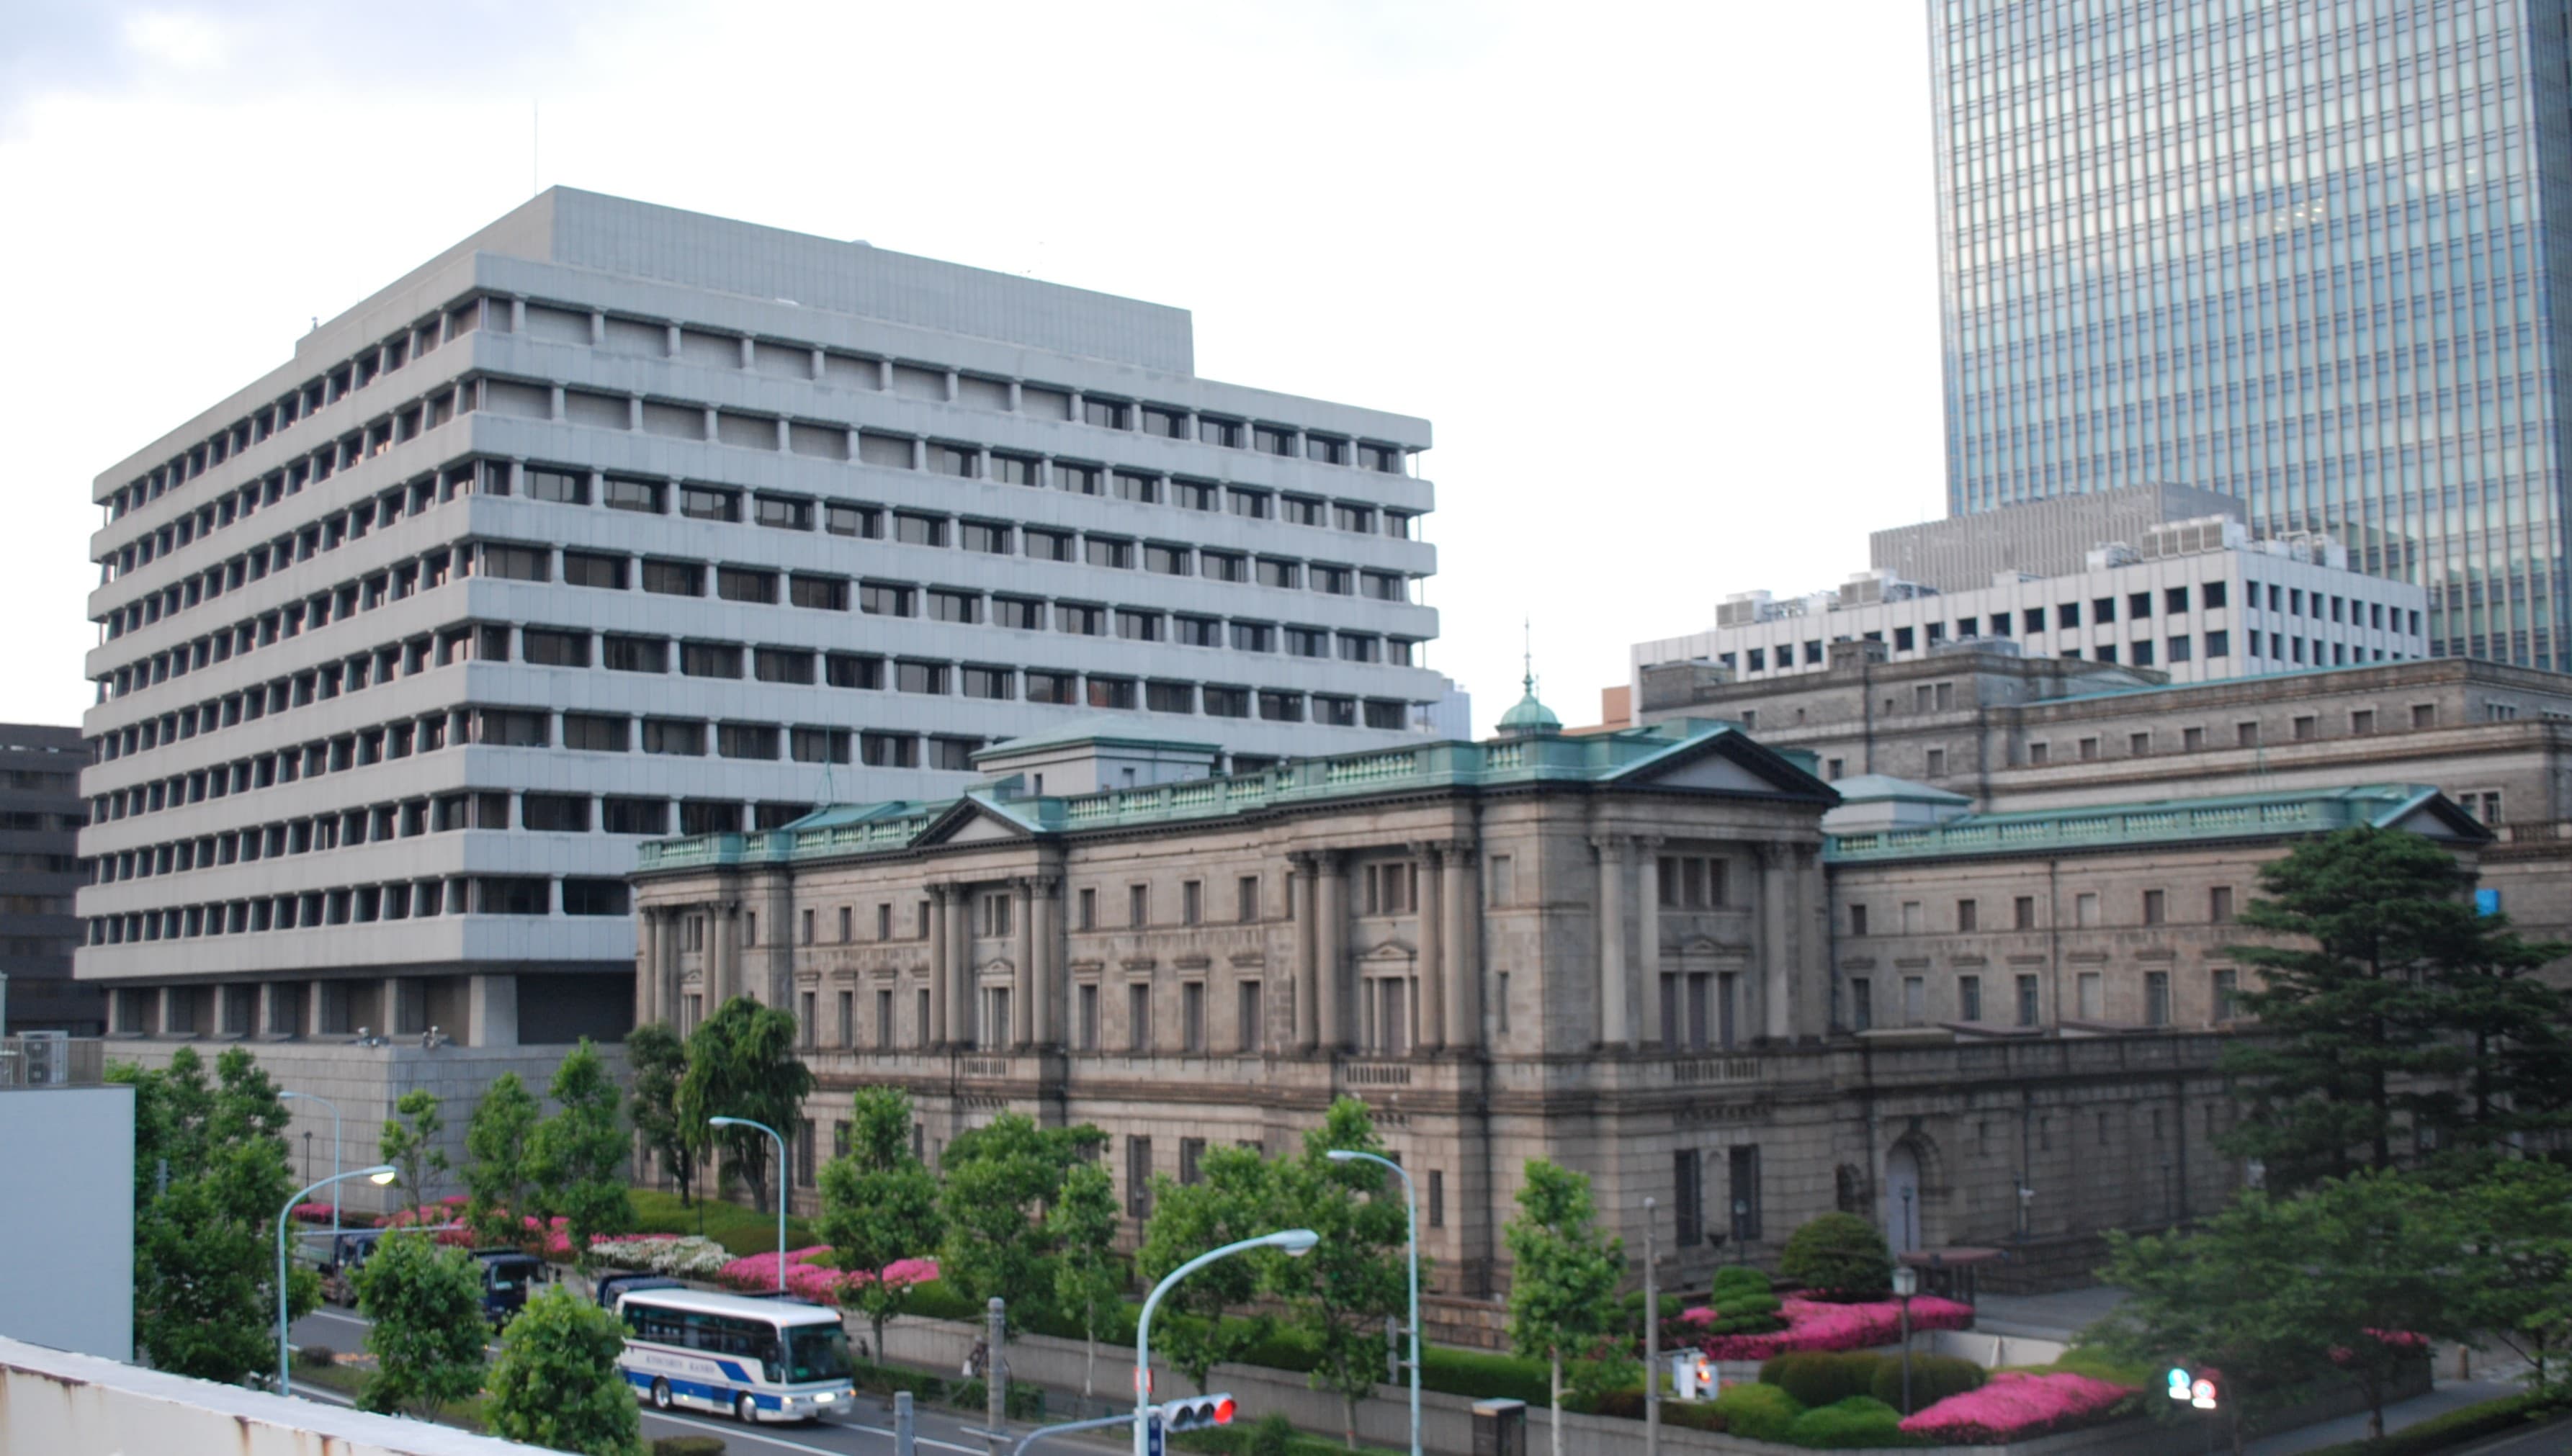
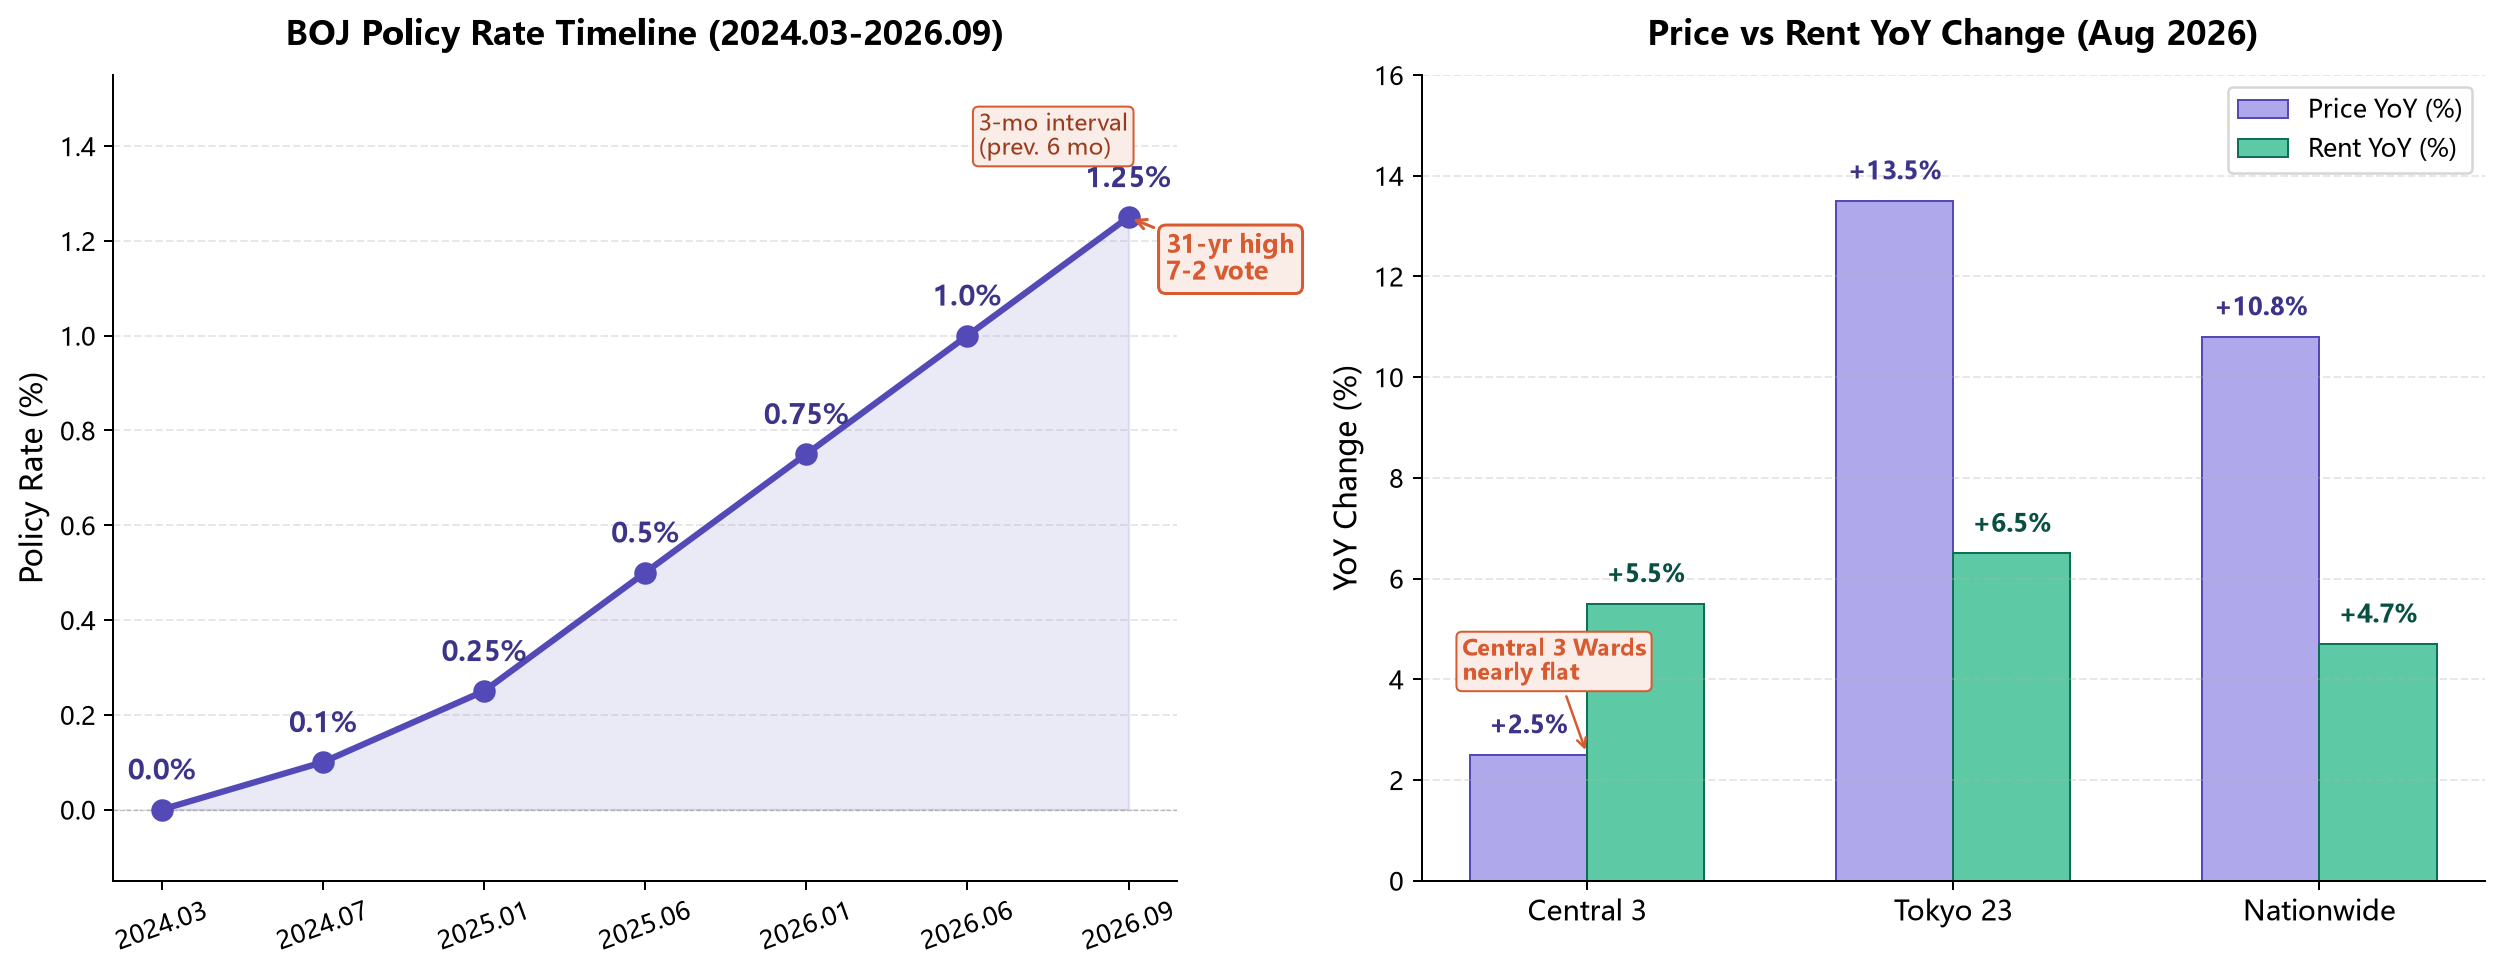
The Bank of Japan (BOJ) voted 7-2 at its September 17-18 monetary policy meeting to raise the uncollateralized overnight call rate from 1.0% to 1.25%. This is the highest Japanese interest rate since 1995, and the fastest pace of this hiking cycle — only 3 months since the previous hike in June, compared to 6-month intervals between prior hikes.
The rate hike takes effect on September 24, 2026 — today. The BOJ cited upside risks to inflation exceeding the 2% stability target, driven by rising oil prices from Middle East tensions and the pass-through of a weakening yen to import prices. Japan's August CPI rose 1.9% year-over-year, with core CPI (excluding fresh food) at 1.7%, just one step away from the BOJ's 2% target.
The two dissenting votes came from committee members Asada Tsuitsuru and Sato Ayano, both considered reflationists. Asada argued core inflation remained below 2% with weak economic momentum, while Sato questioned whether the economic and price situation was accelerating substantively. Following the decision, the yen traded at 156.64 and the 10-year JGB yield stood at 2.947%. This marks the highest range for Japan's benchmark rate since 1995, and the most notable pace shift in the BOJ's normalization cycle.
How Rate Hikes Transmit to Real Estate
The impact of rate hikes on the real estate market transmits through three channels.
Financing costs. Rate hikes directly push up the benchmark rates at which banks lend to businesses and individuals. Monthly payments on variable-rate mortgages have been rising steadily through 2025-2026, already reflected in affordability calculations. The Financial Services Agency recently signaled increased monitoring of ultra-long-term loans such as 50-year mortgages, suggesting tighter scrutiny on the demand side.
Investment spreads. For income-producing real estate, the spread between the capitalization rate (cap rate) and financing costs determines the leverage effect. In a zero-rate environment, the positive spread between 1.5-2% net returns and near-zero borrowing costs made leverage highly effective. With the rate at 1.25%, the financing cost floor has risen noticeably, compressing the positive spread and weakening the return-amplifying effect of leverage. Investors can use urbalytics' cap rate statistics to track net yield changes by city and station.
Price expectations. Since the BOJ began policy normalization in March 2024, the pace has accelerated — from every 6 months initially to every 3 months in recent moves. Market expectations for the terminal rate continue to adjust, affecting real estate valuation models through the discount rate, particularly for long-duration, rate-sensitive assets in core locations.
Price Bifurcation: Central 3 Wards Stagnating While Periphery Accelerates
A rate hike does not mean across-the-board price declines. According to August 2026 data, nationwide condominium prices continued to rise, but regional divergence has become pronounced.
The average price in Tokyo's 23 wards reached ¥86.37 million, up 13.5% year-over-year. However, the Central 3 Wards (Chiyoda, Chuo, Minato) averaged ¥184.91 million, up only 2.5% YoY and down 0.2% month-over-month, with just 0.2% growth over the past three months. The Tokyo Bayfront area averaged ¥138.80 million, up 3.3% YoY, also plateauing.
In contrast, Tokyo Metropolitan Area periphery regions show continued strength. Tokyo overall averaged ¥72.57 million (+13.1% YoY); Kanagawa ¥39.19 million (+10.7%); Saitama ¥31.19 million (+10.5%). These areas' price levels are less than one-third of the Central 3 Wards, yet their growth rates match Tokyo's 23 wards overall.
The core driver of this bifurcation: the Central 3 Wards, as the leading area in this housing cycle, have already accumulated substantial gains in 2024-2025, and buyers' rate sensitivity is approaching its ceiling, dampening further upside. Meanwhile, peripheral areas, with more moderate prior gains, show greater resilience in a rising-rate environment, supported by relatively lower price levels.
Rent Growth Improving Investment Spreads
The other side of real estate investment is rent. Nationwide 3LDK (70㎡) monthly rent averaged ¥156,000, up 4.7% YoY; Tokyo 23 wards ¥305,000 (+6.5%); Central 3 Wards ¥437,000 (+5.5%). Rents across Tokyo, Kanagawa, Saitama, Chiba, Osaka, Kyoto, and Hyogo are at their highest levels since April 2019.
While rent growth has moderated from 2024 peaks, its persistence is strong. For the Central 3 Wards, with monthly rent of ¥437,000 (annualized ¥5.24 million), the gross yield on a ¥184.91 million property is approximately 2.8%. Before the rate hike, this merely seemed low; with rising financing costs, rent growth prevents further yield deterioration and shows an improving trend. Investors can use urbalytics' rent statistics to query historical rent trajectories by station and unit type.
Note that the gross cap rate is a rough reference. In practice, net yield after deducting holding costs is typically 1-1.5 percentage points lower.
Data Granularity Matters
For area-level analysis, understanding data granularity is increasingly important. City-wide averages mask valuable detail — different stations, periods, and unit types have very different sample characteristics.
For example, the Central 3 Wards' average of nearly ¥185 million is a weighted average of high-end assets (e.g., recently traded luxury towers) and mid-range assets. Focusing on the number of high-price transactions and the share of mid-to-low price transactions provides more signal than price alone. In a rising-rate environment, tracking whether high-price listings are declining in volume is more informative than watching the average.
Checking urbalytics' station-level market analysis reveals that Shinjuku, Shinagawa, and Shibuya stations show different rhythms from the Central 3 Wards average. This is the primary value of station-level analysis over city averages.
Key Watchpoints in the Hiking Cycle
1.25% is not the terminal rate. The BOJ retained the language "will discuss rate hikes at every meeting." Governor Ueda's press conference remarks are seen as key for December meeting expectations.
For real estate investors, four watchpoints:
10-year JGB yield direction. As the risk-free rate reference, it directly affects discount rates in long-duration real estate valuation. At 2.947% on September 18, continued upward movement pressures core-location asset prices.
Mortgage rate pass-through speed. Variable-rate mortgages typically adjust within 1-3 months of a policy rate change. Monitor the timing and magnitude of pass-through to monthly payments.
Central vs. periphery price scissors. Whether the divergence continues to widen or narrows. If periphery momentum slows while the Central 3 Wards remain flat, a new equilibrium may emerge.
Rent persistence. Rents have improved investment spreads, but whether this is structural or cyclical depends on employment concentration and wage growth.
urbalytics provides station-granularity data for rent history, cap rates, and transaction volume tracking — effective tools for judging these four watchpoints.
Bottom Line
The transmission of 1.25% to the real estate market has begun, but price bifurcation is more noteworthy than simple up/down movements. The Central 3 Wards' plateau does not signal a crash — it's a natural consolidation after rapid gains. Peripheral areas and rents provide a buffer. In this hiking cycle, station-level analysis and yield calculations are more informative than city averages.
Data sources: BOJ Monetary Policy Meeting Statement (Sept 18, 2026), CAPS Condominium Price Report (Aug 2026), Tokio Marine Asset Management Market Report (Sept 18, 2026), CNBC Asia (Sept 17, 2026). This article does not constitute investment advice.
Copyright: This article is original content by the author. Please do not reproduce, copy, or quote without permission. For usage requests, please contact the author or this site.