Words: 1574 | Estimated Reading Time: 8 minutes | Views: 1602
The gap between asking prices and achieved prices has widened to JPY 14.18 million. This is not a continuation of an overheated rally, but a signal that central Tokyo is slipping first into a buyer’s market.
When a market sends two opposite signals in the same month, it merits more caution than a one-way rise or fall. In June 2026, the Greater Tokyo area (Tokyo, Kanagawa, Saitama, Chiba) saw listing prices and contract prices for existing condominiums trace two divergent curves.
In Japan the industry calls this the “Crocodile Mouth” (ワニの口): the upper jaw is the seller’s ever-higher ask; the lower jaw is the cash buyers actually put on the table. The angle between them is the gap between sentiment and purchasing power. As reported by Asahi Shimbun based on REINS (the Real Estate Information Network System) statistics, that mouth opened in June to its largest in recent years.

Find properties in 埼玉県大宮駅
Individual listings, price-change history, closed transactions and AI valuations are available on a free account.
1. Rate hike delivered: Policy rate at 1.00%, resetting what “affordable” means
On June 16, 2026, the Bank of Japan raised the target for the uncollateralized overnight call rate (無担保コールレート・オーバーナイト物) from 0.75% to 1.00%. It was another step in monetary-policy normalization and a clear exit from years of ultra-low rates.
For real estate, hikes are never abstract macro news; they directly rewrite the variables on every loan application. Twenty-five basis points may look mild, but stretched over a 35-year mortgage they compound into several million yen of additional interest.
Buyers’ monthly repayment capacity hasn’t risen in tandem, so the principal they can support is being squeezed—this is the mechanical reason achieved prices tend to peak before listing prices.
Importantly, this adjustment does not mean demand has vanished. Shinji Fukushima of Mansion Research notes that price adjustments are concentrated in central Tokyo—especially the five core wards where investment-driven purchases are common—“it is not that residential acquisition demand across Greater Tokyo has declined.” In other words, the first capital to be filtered out is the highly leveraged, rate-sensitive segment.
For cross-border investors, there is another layer. Overseas buyers in Japan already face stricter underwriting and higher spreads; policy-rate increases are passed through to realized borrowing rates, while FX volatility maps yen-denominated cash flows into a different curve.
The result: the same property can warrant bids that differ by 10–20% across a Japanese corporate, a Japanese individual, and an overseas investor. This stratification of the buy-side is the micro foundation for “listing prices rising while contract prices barely move.”
2. Dissecting the “Crocodile Mouth”: 26 months of listing-price gains meet two straight months of contract-price declines
First, the upper jaw. In June, the Greater Tokyo new listing price (新規登録価格, i.e., the seller’s asking price) for existing condos was JPY 66.26 million, up 20.8% year on year—its 26th consecutive monthly increase, a near one-way climb.
Now the lower jaw. The month’s contract price (成約価格) was JPY 52.08 million, down a marginal 0.02% year on year—already the second straight monthly decline after May’s “first drop in 19 months.”
The spread between them reached JPY 14.18 million, equivalent to 27.2% of the contract price. In other words, sellers on average are asking roughly a quarter more than buyers are actually willing to pay.
On a per-square-meter basis the picture is even clearer: since summer 2024, new listing unit prices have raced ahead after crossing above contract unit prices, while contract unit prices have flattened from a gentle uptrend. That crossover was the true inflection point of this cycle.
For investors, this spread is itself tradable information. It means the listing price is no longer a valuation anchor, but closer to the upper bound of seller psychology—treating it as market price skews your underwriting from step one.
3. Regional split: The jaw opens in Tokyo; Kanagawa, Saitama, and Chiba barely budge
Greater Tokyo’s number is an average across one metropolis and three prefectures, and averages mask dispersion. Broken out by prefecture, the widest “Crocodile Mouth” is in Tokyo (the urban core), while Kanagawa, Saitama, and Chiba show little to none of this gap.
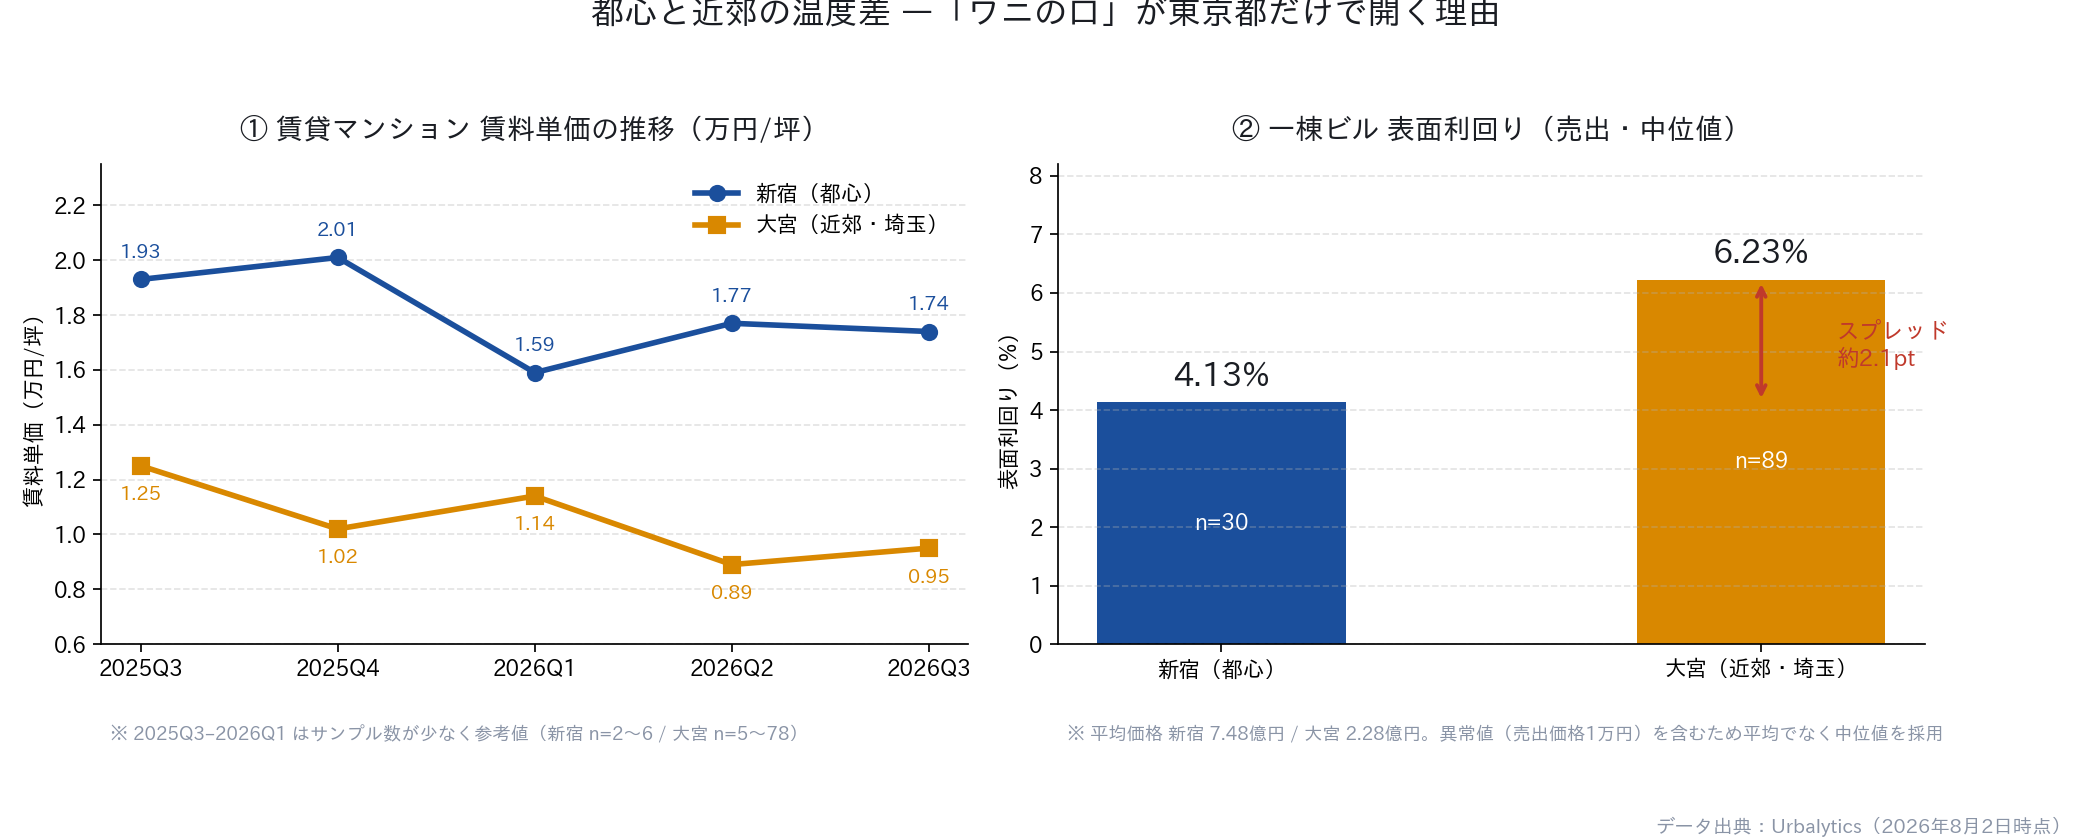
Urbalytics first-party data corroborate this. Around Shinjuku Station, the median gross yield (表面利回り) for single-building income properties is just 4.13% (sample size 30; average price ≈ JPY 748 million). Around Omiya Station in Saitama it is 6.23% (sample size 89; average price ≈ JPY 228 million)—a difference of roughly 2.1 percentage points.
Yield is not just a return; it is a thermometer of whether prices have outrun rents. When core-area yields are compressed to just above 4%, prices have already discounted several years of rent growth; where yields still exceed 6% in the near suburbs, there is more buffer between price and cash flow.
When funding costs rise from 0.75% to 1.00%, the thinnest buffer adjusts first. This explains why, in the same dataset, Tokyo and the three prefectures exhibit two very different patterns.
The three prefectures are not identical either. Kanagawa’s Yokohama–Kawasaki axis hews closer to core pricing logic; Saitama, anchored by the Shinkansen hub at Omiya, absorbs significant owner-occupier spillover from Tokyo; Chiba relies more on corridor development and commuting-time improvements. The common thread: their price gains have not fully pre-spent the room for rent growth.
For investors targeting cash flow rather than short-term price spreads, this 2.1 percentage-point yield spread is essentially a pricing sheet that swaps location for yield. The question is not “core or suburbs,” but whether, at today’s rates, the location premium you pay can still be covered by rents.
Urbalytics Insight Urbalytics internal data show the median gross yield on single-building income properties is 4.13% around Shinjuku Station and 6.23% around Omiya Station. This 2.1 percentage-point gap is the quantitative explanation for why the “Crocodile Mouth” is opening mainly in Tokyo. Rents also tier: asking rent for leasing apartments is about JPY 17,400/tsubo in Shinjuku versus roughly JPY 9,500/tsubo in Omiya; however, the lower rent base in the near suburbs leaves relatively more upside, and the disconnect between prices and cash flow is milder. (Quarterly sample sizes for 2025Q3—2026Q1 are small and thus indicative.)
4. Drivers and trajectory: From “mark-ups to clear inventory” to “where negotiations do the real work”
Three threads make the drivers of this shift clear:
First, rate normalization capped leveraged buying power—especially investment-driven demand in Tokyo’s five core wards that relied on rate spreads—so it was the first to be squeezed out.
Second, sellers still benchmark pricing to the last 26 months of gains. Listing-price adjustments naturally lag achieved prices; that time lag mechanically widens the gap.
Third, the three prefectures have not fully priced in future rent growth; with thicker yield buffers, they are more stable under the same rate shock.
What comes next? The gap will not stay open indefinitely, and there are only two ways to close it: either contract prices catch up to listing prices—which requires a material improvement in rents and incomes—or listing prices correct downward, which is more likely and typically shows up as longer time-on-market and more frequent price cuts.
During that convergence, buyer negotiating leverage is at its cyclical peak. For patient, cash-rich investors, this is the window to be selective and negotiate hard.
The monitoring indicators are straightforward: no need to call the top of the index—just track days on market and price-cut frequency for the same building and micro-segment. When average time-on-market starts to lengthen and the first price cut happens noticeably earlier, sellers’ anchors are being forced down toward achieved prices.
Note also that this adjustment is occurring while transaction volumes have not collapsed—demand remains, but is no longer willing to fund seller expectations. Historically, such “steady volume, lagging price” phases are more conducive to accumulation than “volume and price both falling,” because they filter out bidders, not tenants.
Risk disclosure The “Crocodile Mouth” is an overheating indicator; it does not mean prices are about to crash—Greater Tokyo’s average new-build price just topped JPY 100 million for the first half, and aggregate demand has not ebbed. The real risks are twofold: underwriting acquisitions with the listing price as the valuation anchor may pre-consume 3–5 years of appreciation; and under continued rate-hike scenarios, high-leverage, low-yield core assets are least resilient to changes in loan terms.
Conclusion: Take “listing price” off the valuation pedestal
For long-term cross-border investors, the point of the June 2026 data is not to answer “buy or not,” but to recalibrate which price anchor should govern that decision. When the listing–contract gap is 27%, continuing to use the ask as your benchmark amounts to voluntarily paying a JPY 14.18 million cognitive cost.
A more robust path is to return to achieved prices and rental cash flows: first confirm the achieved unit-price percentile in your target micro-area; then check gross yields and rent comps for single-building assets in that band; only then set your bid.
With Urbalytics’ price-history lookup and yield statistics, investors can verify these three layers before bidding—without relying on listing price, a signal that has already become distorted.
#TokyoRealEstate #GreaterTokyoHousingMarket #ExistingCondo #PreOwnedCondo #ContractPrice #NewListingPrice #CrocodileMouth #BoJRateHike #PolicyRate #GrossYield #Shinjuku #Omiya #SaitamaInvestment #BuyersMarket #Urbalytics
References
- Asahi Shimbun (Yahoo! News reprint), 2026, 「中古マンション価格、広がる「ワニの口」 売り手は強気、買い手は?」, https://news.yahoo.co.jp/articles/d696d51f0c7e16cc2b1d91e148e144746fcf55b7
- Bank of Japan, 2026, 「金融市場調節方針の変更について」(2026年6月16日 金融政策決定会合), https://www.boj.or.jp/mopo/mpmdeci/mpr_2026/k260616a.pdf
- Bank of Japan, 2026, 「金融政策に関する決定事項等 2026年」, https://www.boj.or.jp/mopo/mpmdeci/mpr_2026/index.htm
- Tokio Marine Asset Management, 2026, 「日銀金融政策決定会合(2026年6月)~事前の予想通り、0.25%の利上げと国債買入れの減額停止を決定~」, https://www.tokiomarineam.co.jp/market/market_report/2026/031.html
- Dai-ichi Life Research Institute (Hideo Kumano), 2026, 「政策金利1.00%への引き上げ ~2026年6月の日銀金融政策決定会合~」, https://www.dlri.co.jp/report/macro/623090.html
- Urbalytics platform internal data(`building_cap_rate_stats` / `rent_stats`, acquired Aug 2, 2026), https://www.urbalytics.jp/
Copyright: This article is original content by the author. Please do not reproduce, copy, or quote without permission. For usage requests, please contact the author or this site.
Photos in this article: Omiya-STA West MaedaAkihiko/CC BY-SA 4.0(トリミング) Wikimedia Commons