Words: 1679 | Estimated Reading Time: 9 minutes | Views: 118
Inventory on the waterfront has stopped rising not because demand has recovered, but because sellers are generally conceding 10%+ to get deals done—the list price is no longer the market price.
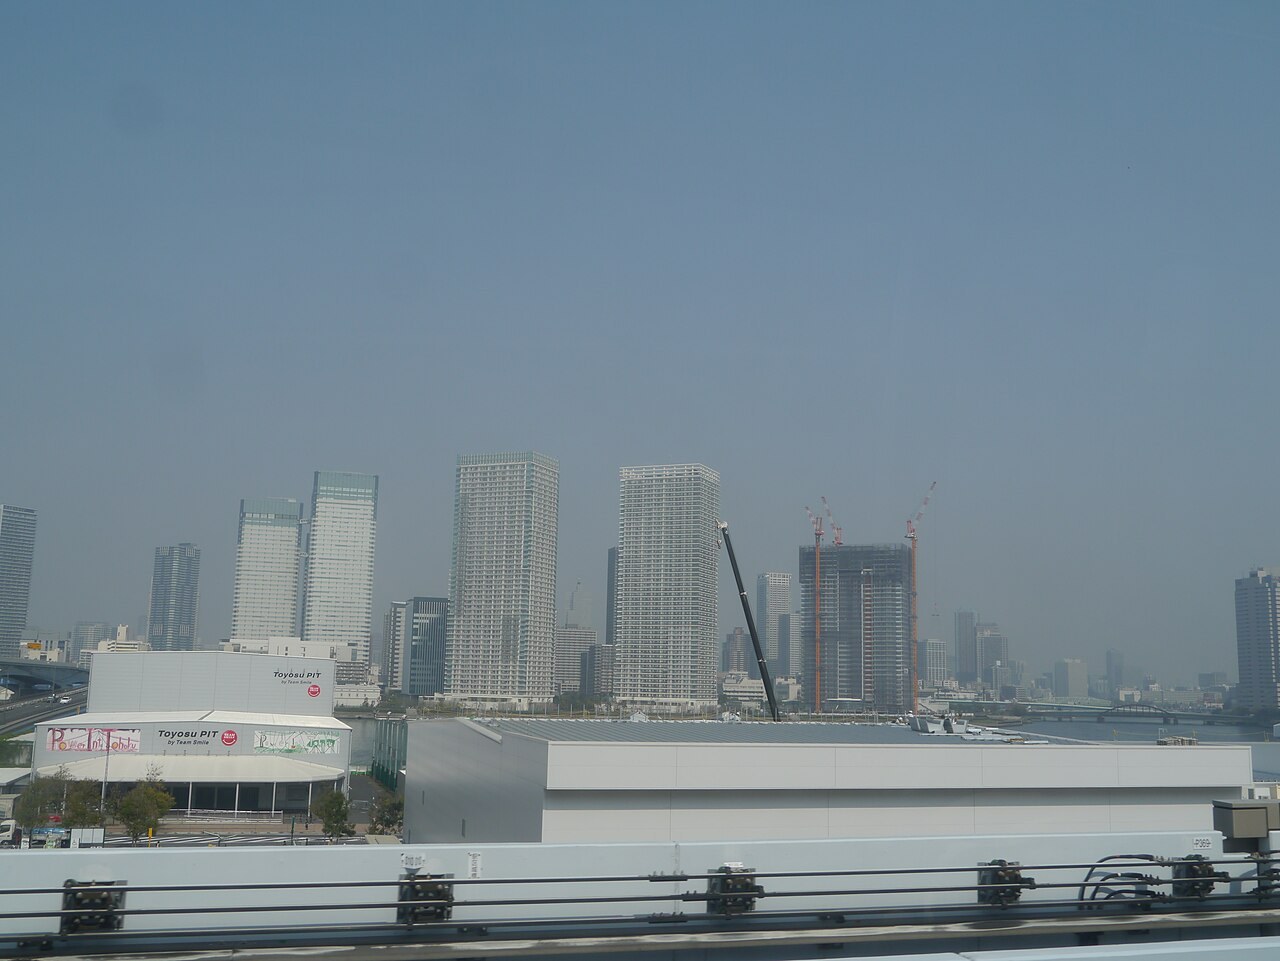
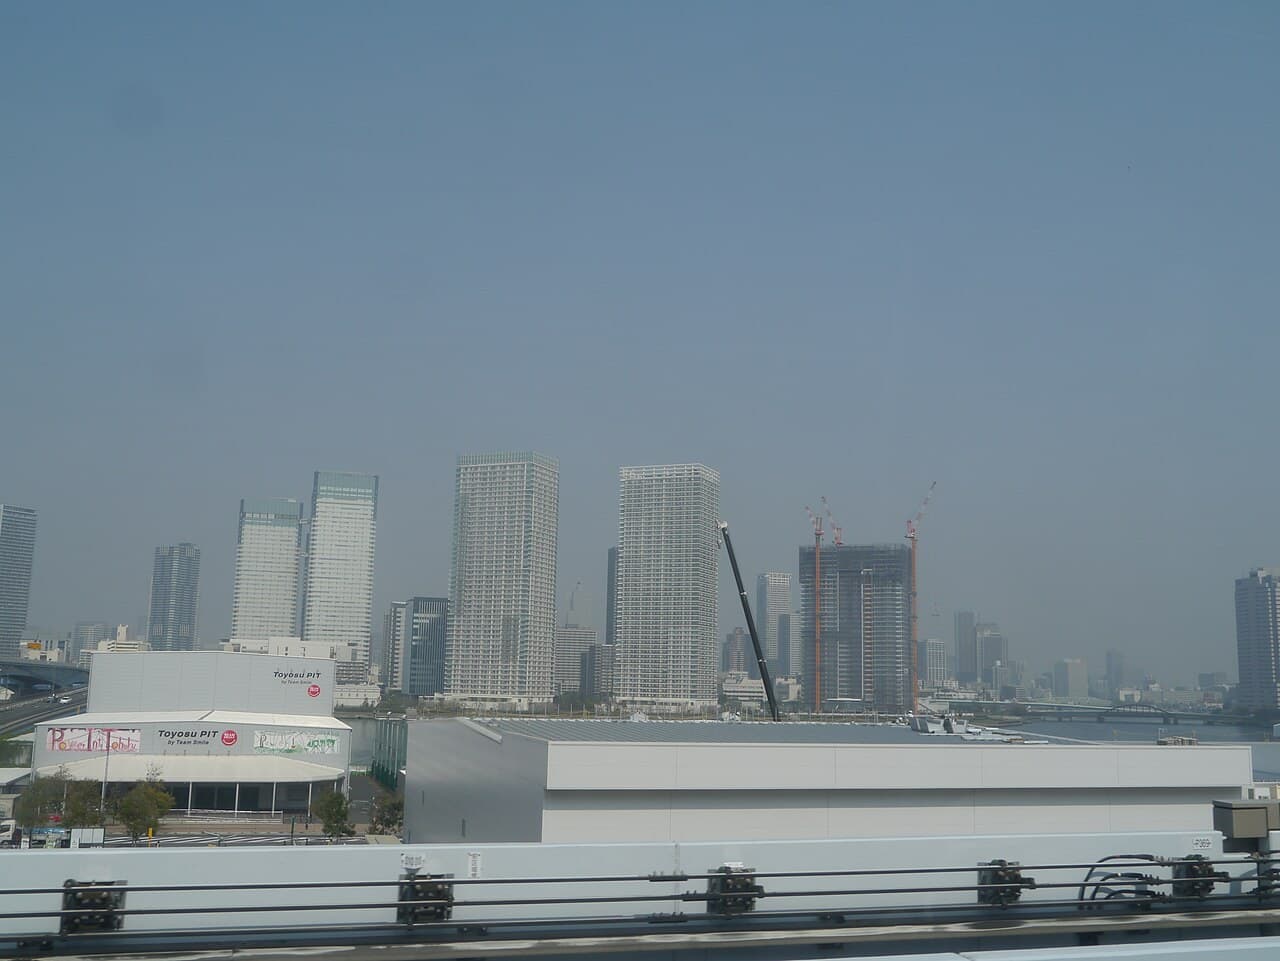
Over the past decade, if you wanted a near-certain “buy and it goes up” story in Japan, tower condos in Minato Ward and the waterfront were almost the only answer. But on August 17, 2026, a data release by Mansion Research’s in-house Fukushima Research cracked that narrative: a study covering 106,877 existing-condo cases in Chuo and Koto Wards shows that since the second half of 2025, deals in the waterfront area have typically required an average discount of 10%+ to close.
The importance of this figure is not the magnitude per se, but the premise it overturns: in the waterfront, asking prices can no longer be read as market prices. The level the market actually accepts sits roughly one notch down—about 10% below the ask.
The inventory curve is misleading: sideways ≠ recovery
First, a signal that’s easy to misread. Fukushima Research’s data show that existing-condo inventory (active listings) in Chuo and Koto surged from mid-2024, but the pace has slowed markedly in recent quarters and is now flat to slightly down.
If you look only at that curve, you would conclude “the market has bottomed and demand is recovering.” Overlay the deal terms, and the story flips.
Inventory stopped rising not because buyers returned, but because sellers finally compromised. The report states plainly: most sellers only concluded a sale after making large price cuts. In other words, the “improvement” in inventory was bought with price, not with demand.
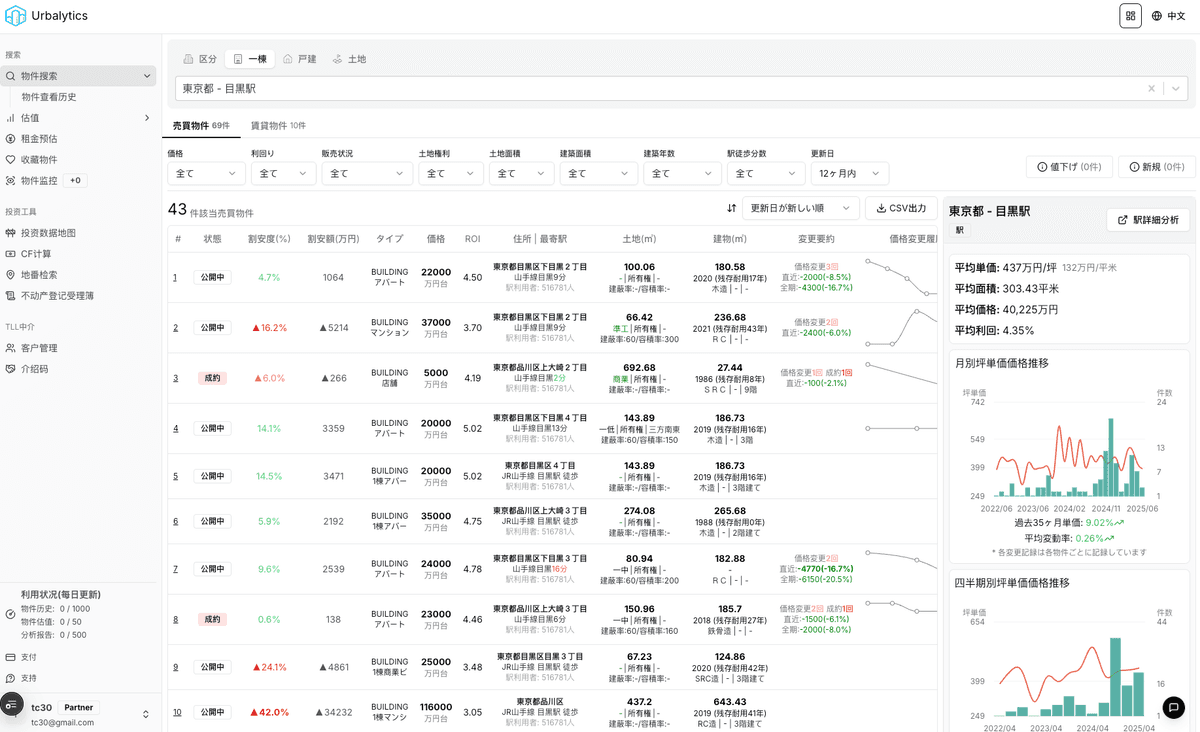
Urbalytics Insight This is precisely why Urbalytics insists on evaluating inventory, achieved price, and time-to-close together when assessing submarkets. Looking only at active listings yields the wrong takeaway of “recovery.” Only when you add the concession at closing (the ask–take gap) and absorption speed into the model can you tell true demand from pseudo-clearance driven by price capitulation. Investors can use Urbalytics’ price history (価格変更履歴) to see how many times an asset was repriced from listing to sale, and by how much each time.
The inflection point is mid-2024: Japan entered a positive-rate era
Why did the change start right around mid-2024? Fukushima Research points directly to monetary policy.
In 2024, the Bank of Japan ended zero rates and lifted the policy rate to 0.25%, officially ushering in an “era of positive rates” (金利のある時代). The timing of high-priced condo inventory piling up nearly overlaps that shift. Hikes didn’t stop there—per Shueisha Online the same day, in June 2026 the BOJ raised the policy rate from 0.75% to 1%, the fifth hike since exiting negative rates.
The bite of rates is amplified in “hundred-million-yen property clusters” like the waterfront. The logic is simple: the larger the loan, the larger the absolute shock to monthly payments from the same rate move.
On a 35-year mortgage for ¥100 million, a 1 percentage-point increase in rates lifts the monthly payment by roughly ¥50,000. Even with recent wage gains in Japan, few salaried workers have an extra ¥50,000 take-home each month. Compounding this, banks have also tightened underwriting, shrinking approved loan amounts—a negative loop where “budgets fall” and “monthly payments rise” happens at once.
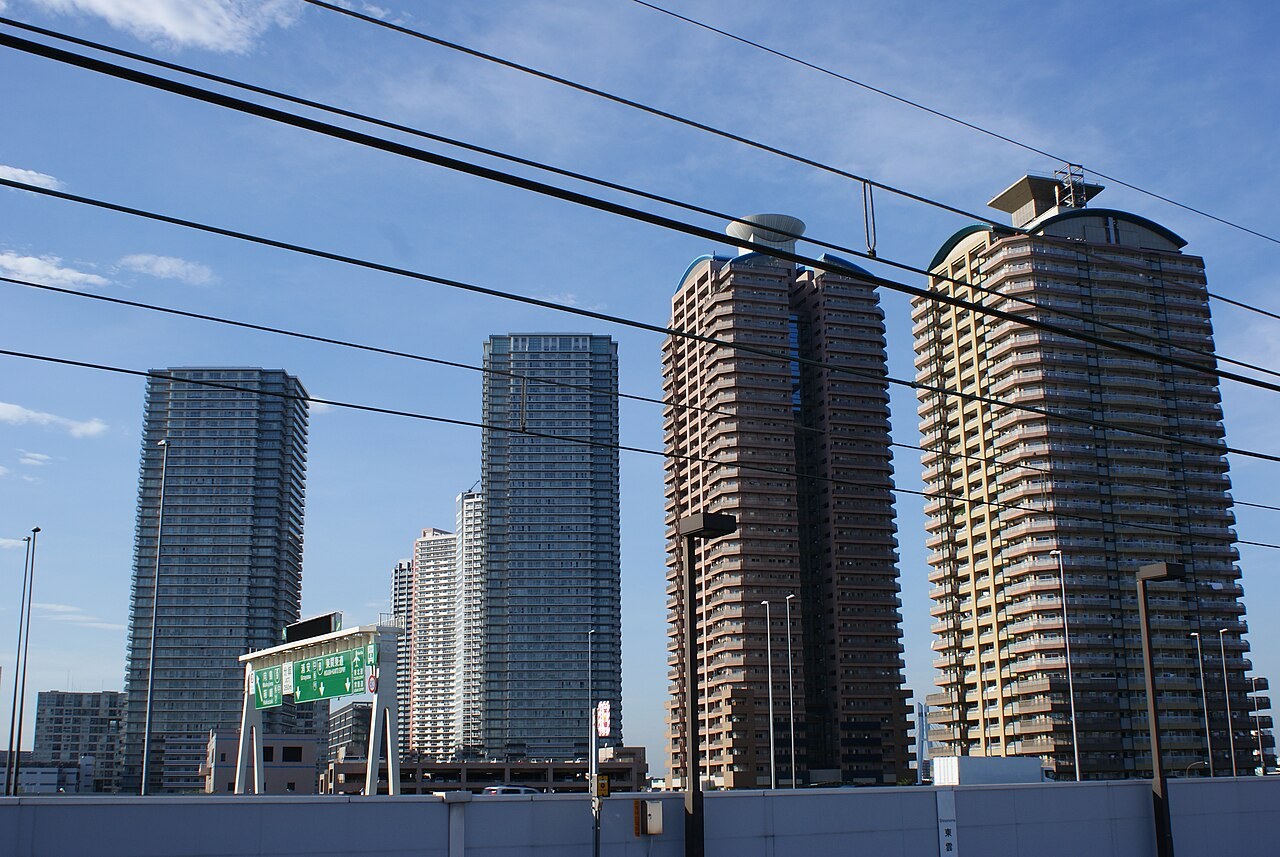
Both end-user and investor demand are weaker: the waterfront’s structural vulnerability
Waterfront pricing had been propped up by two pools of capital: leveraged end-users and domestic/overseas investors. The problem with rate hikes is that they weaken both at the same time.
On the end-user side, affordability shifts down and some buyers drop out. On the investor side, rising financing costs compress net yields, while future appreciation expectations shrink—when expected capital gains fall, investors’ price tolerance naturally declines.
The result is that the waterfront is more prone than other areas to losing both legs simultaneously, which explains why price adjustments are more pronounced here than in other parts of Tokyo.
Risk warning The report explicitly frames the current “~10% on average” as the first-stage adjustment under today’s rate environment. If the BOJ continues stepwise hikes and mortgage rates ratchet higher, the buyer pool will narrow further and market liquidity will deteriorate. To restore smooth transactions then, required discounts may exceed today’s 10%. Reading “down 10%” as a buy-the-dip signal is the most dangerous misinterpretation this cycle.
Case studies: from 139× lottery odds to ¥30 million price cuts
What does a statistical 10% look like at the project level? A same-day Shueisha Online piece offers two striking examples.
The first is Livio Tower Shinagawa. At the Phase 1, first batch launch in 2025, investors piled in: average lottery odds were 12.3×, with a maximum of 139×. The condo community on social media (マンクラ) shouted in unison: “absolute bargain,” “the last chance for ordinary buyers to own a Minato tower.” The developer then raised prices, lifting the Phase 1 second-batch starting price from the ¥150 million range to the ¥160 million range, creating gaps of over ¥20 million for comparable layouts.
The turn came with Phase 3, first batch in May 2026: a unit originally listed at ¥229 million was cut to ¥196 million, a drop of more than ¥30 million in one go. A project that once drew 100× lotteries now has first-come, first-served inventory.
The second is Cielia Tower Minami-Azabu. At launch in 2024, a just-over-70 m² 2LDK was priced above ¥280 million and widely cited as emblematic of Tokyo’s surge; two years later, a 73 m² unit was quoted at ¥249 million, and the developer was emailing weekly to push remaining stock.
The ones truly hit by this adjustment are those who entered assuming prices would rise:
First, leveraged end-users who chased the market higher. Some buyers locked in paper losses before handover—the home hasn’t been occupied yet, but the mark-to-market is negative, while the mortgage was signed at the original price.
Second, pure flippers. In 2025, buying and holding to completion for two years could net tens of millions of yen, prompting some to apply repeatedly under relatives’ and friends’ names. With prices reversing and handover approaching, many lack full cash and must choose between forfeiting deposits and cutting losses. Reportedly, handover at Livio Tower Shinagawa is set for April 2027, yet portals like SUUMO already show numerous apparent resales—with transactions nearly stalled.
The other half in Urbalytics data: rents are quietly softening
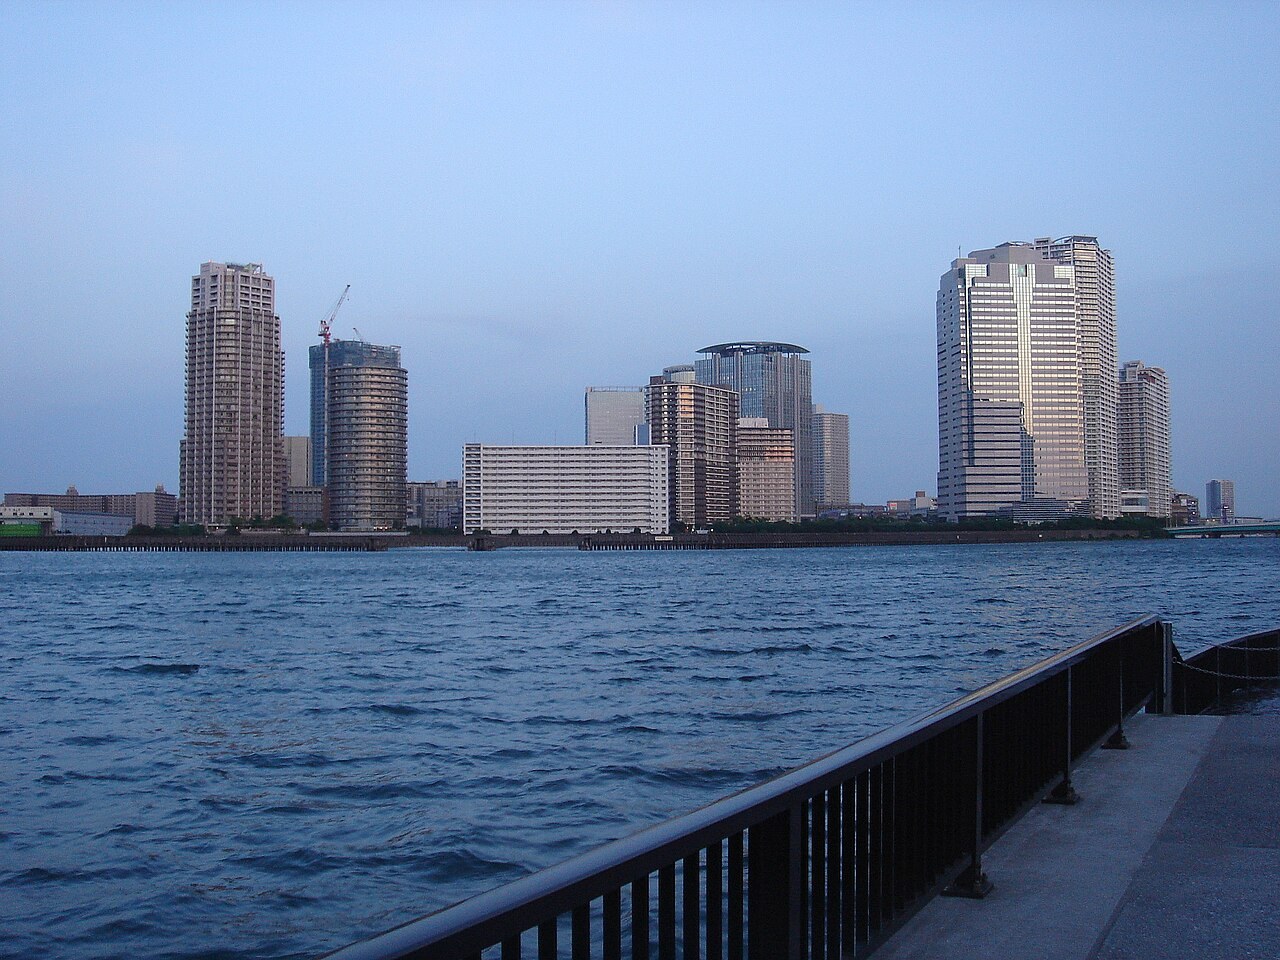
Prices are adjusting—what about rents, the base of income? Using Urbalytics’ rent_stats and building_cap_rate_stats for two representative stations in the waterfront, the picture is more nuanced than “prices are falling.”
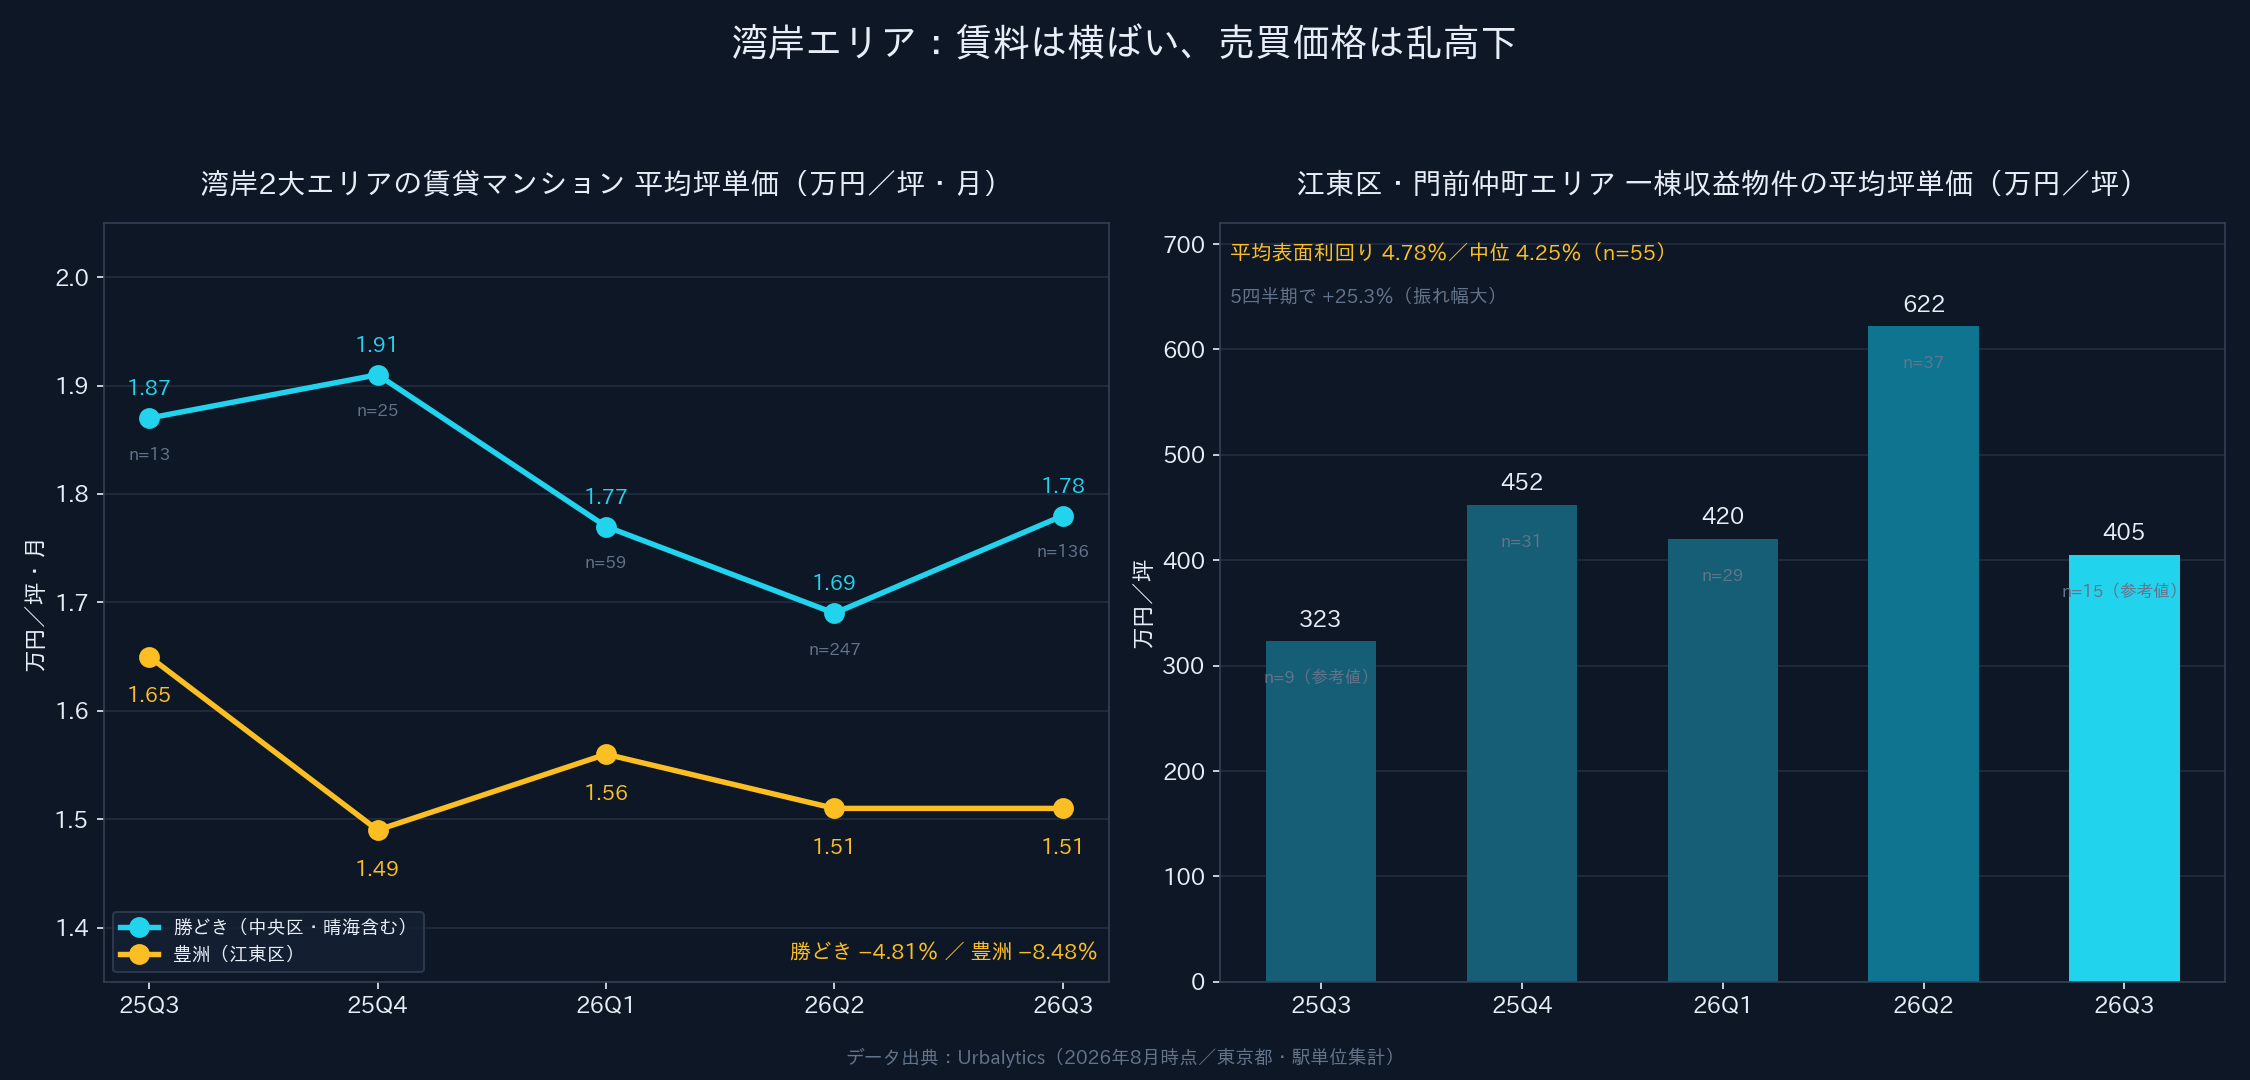
In the Kachidoki station area (including Harumi), average asking rent fell from ¥18,700/tsubo·month in Q3 2025 to ¥17,800 in Q3 2026, a cumulative −4.81% over five quarters. Toyosu saw a steeper drop—from ¥16,500/tsubo·month to ¥15,100, a cumulative −8.48%.
This means the waterfront is not experiencing a healthy “prices down, rents steady” adjustment, but softness on both fronts. For cash flow–oriented investors, this matters more than headline price cuts: if rent support is loosening, lower prices may not immediately improve cap rates.
On whole-building income assets, the picture is chaotic in a different way. Around Monzen-nakacho in Koto Ward, the average gross cap rate is about 4.78% and the median about 4.25% (55 samples), while price per tsubo swung from ¥3.23 million to ¥6.21 million and back to ¥4.05 million over five quarters. Such large swings are themselves a symptom of deteriorating liquidity—as deal counts thin (only 15 in Q3 2026, indicative), the price band whipsaws on outliers, and the “average price” loses signal.
From price to liquidity: the coordinates for valuing assets have shifted
Fukushima Research’s closing point is worth noting for anyone holding Japanese real estate: when analyzing the waterfront from here, what matters isn’t simply whether prices are rising or falling, but three liquidity questions—how much discount it takes to transact, whether the sales cycle is shortening, and whether inventory declines come alongside price adjustments.
Behind this lies a shift in valuation frame. In the past, you judged an asset by “what’s the ask.” From here, it’s “what did it actually clear at, and how easily did it sell.”
For TLL as an acquisition-and-resale house, this has direct operational implications: buying prices for waterfront assets should no longer anchor to peak ask levels, but to the “ask × 0.9” market line, with buffer reserved for a second leg of adjustment if rates rise further. For long-term holders, attention should pivot back from capital gains to the sustainability of rents—and as shown above, the rent side on the waterfront is itself under pressure.
As one operator active in Minato Ward put it bluntly in the Shueisha Online piece: the abnormality was that every area rose together; going forward, screening by location and brand will only tighten. Read that as: the waterfront won’t collapse wholesale, but differentiation within it will be magnified by rates—truly scarce locations versus those sustained mainly by “appreciation narratives” will be repriced by the market.
To gauge which bucket your target asset sits in, pull up that building’s price history and nearby transactions and rental comps on Urbalytics, and position it using closing prices rather than asks.
#TokyoWaterfront #WaterfrontTowers #ChuoWard #KotoWard #MinatoWard #ShinagawaRedevelopment #RisingInterestRates #BOJRateHikes #JapanRealEstateInvestment #ExistingCondos #TowerCondos #RentalComps #GrossCapRate #Liquidity #Urbalytics
References
- Kenbiya, “Is a ‘10% price cut’ on waterfront condos just a waypoint? Higher rates and the question of true fair value” (Shinji Fukushima / Mansion Research Co., Ltd. – Fukushima Research), 2026, https://www.kenbiya.com/ar/ns/research/price_trends/10422.html
- Shueisha Online (Tsukiji Confidential), “Anomalies at Minato Ward tower condos over ¥200 million: ‘Paper losses almost certain before move-in’—maximum lottery odds 139× → price cuts over ¥30 million; the outcome for buyers who trusted the ‘mansion-cluster’ narrative,” 2026, https://news.yahoo.co.jp/articles/2fae9370314f3e88c50bbe576f5522917ba4ad96
- Mansion Research Inc., Survey overview (study period Jan 2023–Jun 2026 / 106,877 existing-condo cases in Chuo and Koto Wards), 2026, https://www.kenbiya.com/ar/ns/research/price_trends/10422.html
- Urbalytics, Rent Statistics and Whole-Building Cap-Rate Statistics (Tokyo / Kachidoki, Toyosu, Monzen-nakacho station areas, as of Aug 2026), 2026, https://www.urbalytics.jp