Words: 1448 | Estimated Reading Time: 8 minutes | Views: 39
The brand-line premium is not a single line item; it stacks a 2.46x rent multiple on top of a 1.89x pricing multiple, ultimately pushing same-size assets to nearly 4.7x.
A ¥30 million spread should first be broken into two ledgers
On August 16, housing consultant Takashi Teraoka published a cross-sectional analysis on President Online: he placed four main through-service routes to Shinjuku—the JR Chuo Line, the Odakyu Line, the Keio Line, and the Seibu Shinjuku Line—on the same table and scored them across six dimensions: pricing, commute quality, daily-life convenience, asset characteristics, household-budget rating, and his own metric of “line prestige.”
The conclusion is straightforward. New-build condominium asking prices in Kokubunji on the Chuo Line (28 minutes direct) run ¥75–100 million, while Kodaira on the Seibu Shinjuku Line (30 minutes direct) sits in the ¥50–70 million range; even the medians differ by roughly ¥25–30 million. With near-identical commute times and similar convenience, what exactly are buyers paying that difference for?
Teraoka’s answer is “line prestige”—a brand premium built up by history, educational environment, and media image. Intuitively plausible, but it’s consultant judgment, not verifiable numbers. For investors, the real question is: in what form is that premium actually being priced into the asset?
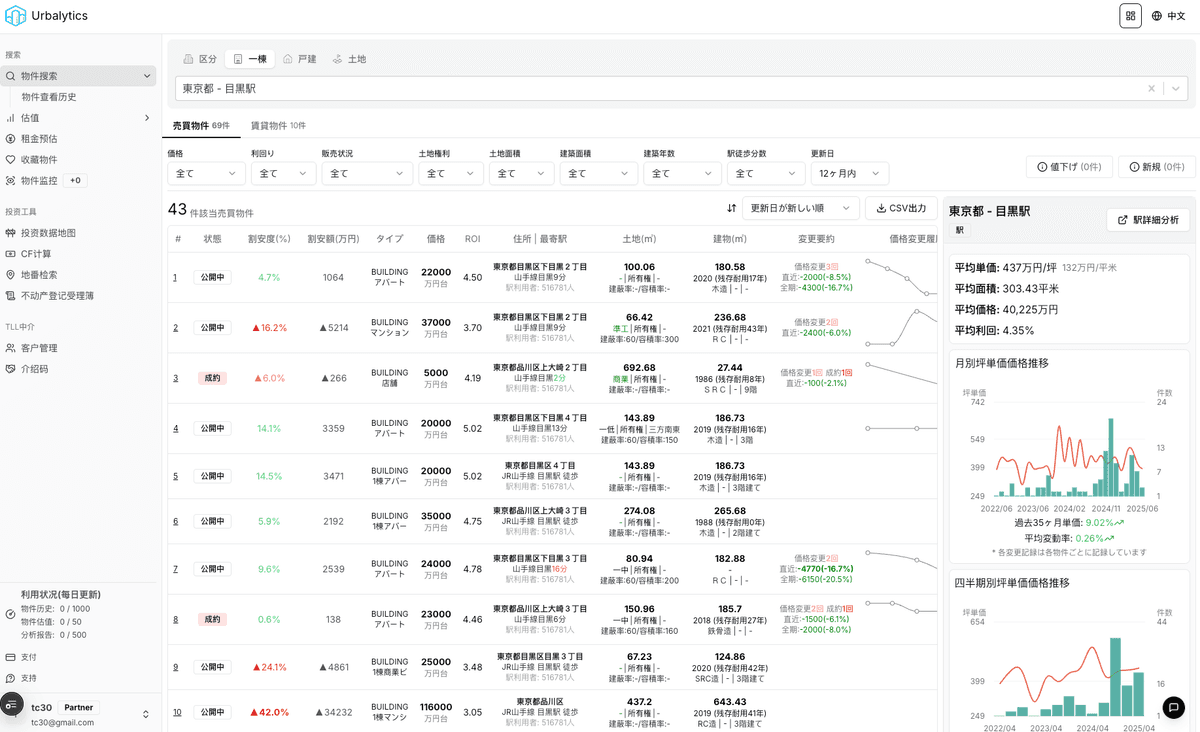
We linked that hypothesis to live listings on the Urbalytics platform, pulling five stations—Yoyogi-Uehara (Odakyu), Fuchu (Keio), Kokubunji (Chuo), Tanashi and Kodaira (Seibu Shinjuku)—and retrieving both rental unit prices and the gross yield (表面利回り) of whole-building income assets. The results show the brand premium is not a single ledger entry; it leaves a mark on both the rent side and the price side, aligned in direction but materially different in magnitude.
Rent side: the market has only accepted part of the brand premium
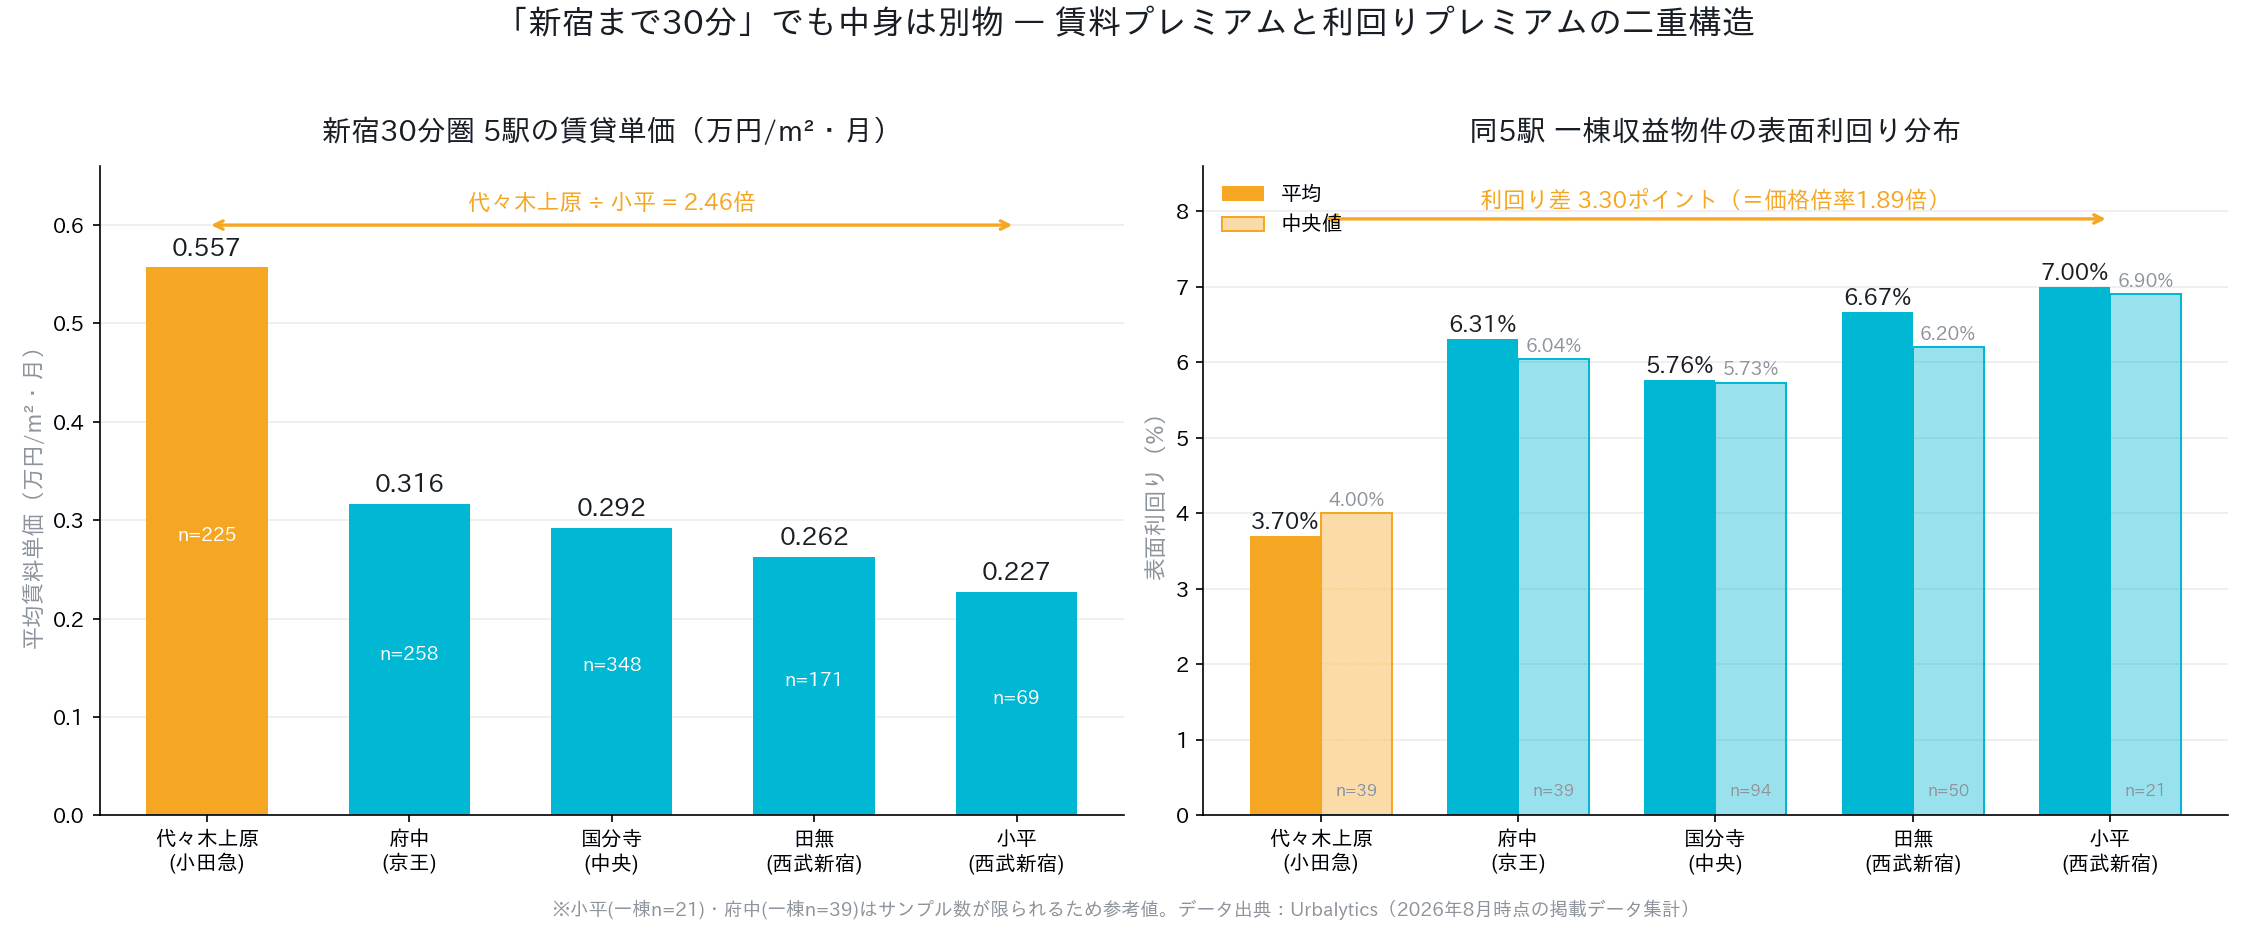
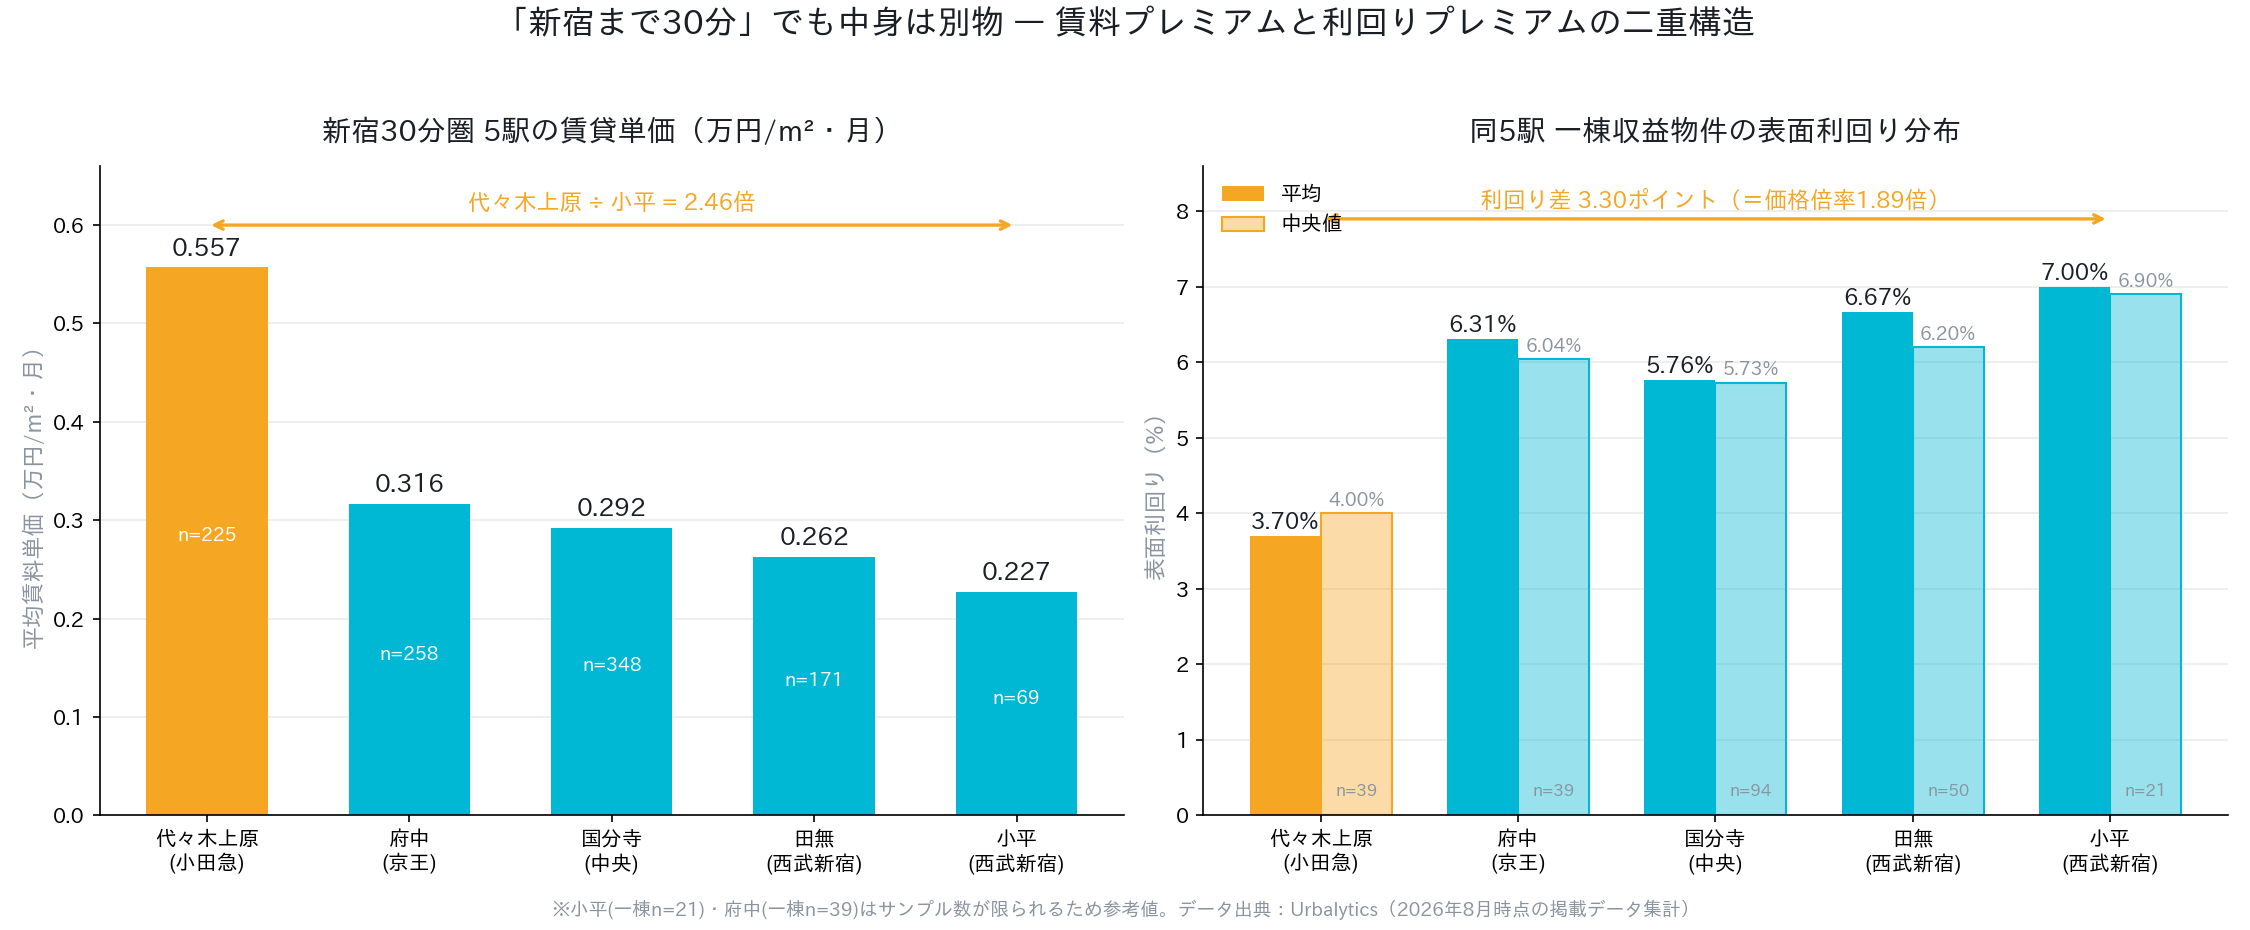
Start with rents. Around Yoyogi-Uehara, Urbalytics shows 225 apartment (mansion) rental samples with an average unit rent of about ¥5,569 per sqm per month and a median of ¥5,492; on the same basis Kodaira has 69 samples, averaging ¥2,267 with a median of ¥2,150. Dividing the two, the brand station’s rent per sqm is 2.46 times the suburban station’s.
What does that multiple mean? It reflects what actual users—tenants—are willing to pay each month for the address “Yoyogi-Uehara.” Tenants vote with cash flow and do not pay for appreciation expectations; therefore the rent-side gap can be seen as the portion of the brand premium genuinely validated by end-user demand.
The middle three stations line up cleanly as well: Fuchu ¥3,164, Kokubunji ¥2,924, Tanashi ¥2,623. Fuchu’s edge over Kokubunji on rent likely stems from its role as the commercial and administrative hub of the Tama area—consistent with Teraoka’s labeling of the Keio Line as the “cost-performance champion,” except the driver here is sturdy demand rather than mere cheapness.
Urbalytics Insight The value of Urbalytics’ internal data is that it aggregates live listings and trades on-platform, rather than media-quoted ranges. Sample densities like Kokubunji’s 348 and Fuchu’s 258 are sufficient to make cross-station unit-rent comparisons robust against case-specific noise; conversely, with just 21 whole-building samples in Kodaira, we must flag it as a reference value rather than a conclusion—this granularity-level honesty is precisely where internal data trump secondhand reporting.
Price side: the real premium is embedded in yields
The rent gap is 2.46x, but price gaps extend beyond that. For the same station set, gross yields on whole-building assets show: Yoyogi-Uehara averages 3.70% (median 4.00%, n=39), while Kodaira averages 7.00% (median 6.90%, n=21). In between: Kokubunji 5.76%, Fuchu 6.31%, Tanashi 6.67%.
Yield is the inverse of price. The same annual rent capitalized at 7.00% in Kodaira and at 3.70% in Yoyogi-Uehara implies a 1.89x price difference. In other words, beyond the 2.46x rent that tenants will pay, buyers also accept nearly a 90% additional capitalization premium on top.
Multiply the two and same-area assets in Yoyogi-Uehara carry a theoretical price about 4.65x Kodaira’s. This is the full balance-sheet footprint of “line prestige”—well beyond what commute time alone can explain.
Can the model be validated? Apply it to Teraoka’s pair: Kokubunji vs. Kodaira. Rent unit-price ratio 1.29x; yield ratio 1.215x; composite theoretical price multiple about 1.57x. His reported median transaction comparison (¥87.5 million vs. ¥60 million) is 1.46x. Two independent lenses land in the same band, indicating this “Rent Premium × Capitalization Premium” decomposition captures the main drivers of the spread.
Divergence across the four lines: who is converging, who is under pressure
A static snapshot would end the story here. But Urbalytics’ time series signals something more interesting: the rent gap between brand and suburban stations is slowly converging.
Over the past five quarters, Kokubunji’s surrounding unit rent per tsubo is up roughly 16.09%, Tanashi up 4.76%, Kodaira up a modest 1.47%; over the same period, Yoyogi-Uehara is -0.55%, essentially flat. In short, the “value-for-money lines” are rising; the “brand lines” are not.
This is not hard to interpret:
First, brand stations within the 30-minute Shinjuku ring are near affordability limits: at Yoyogi-Uehara the average monthly rent is ¥264,000 and the average size is only 45 sqm; the tenant cohort able to shoulder that level is shrinking, leaving little room for further increases.
Second, suburban stations have absorbed a large wave of family demand priced out of the urban core over the past two years; listing densities such as Kokubunji’s 348 and Fuchu’s 258 indicate these rental markets are expanding, not contracting.
Price-side signals, however, require caution. Unit price per tsubo for whole buildings shows double-digit swings at multiple stations—Fuchu down 42.25% cumulatively over five quarters, Kokubunji -29.87%, Kodaira up 81.53%—but quarterly samples at these stations are often single digits to the low twenties, so much of the volatility reflects sample-mix shifts rather than an actual market breakdown. Treating such prints as trend is one of the most common analytical misreads.
Risk notice The yields and rents cited here are listing-based and are not equivalent to executed transactions. In particular, Kodaira (whole-building n=21) and Fuchu (whole-building n=39) have thin samples; their average yields should be treated as indicative ranges at best. In addition, Teraoka’s reminder about the Seibu Shinjuku Line’s terminal configuration must be factored in: Seibu-Shinjuku Station is a several-minute walk from JR Shinjuku Station. This “last leg after arrival” friction is invisible in rent data but does tangibly cap the line’s long-term demand ceiling.
Investment takeaways: know whether you are buying cash flow or valuation
Viewed side by side, the roles across the four lines are clear.
At brand stations like Yoyogi-Uehara, a 3.70% gross yield means cash-flow return is compressed to the limit; the thesis is almost entirely about capital preservation and liquidity—own it to fall less in down cycles and to have a ready bid when you want to sell.
At Seibu Shinjuku Line stations such as Tanashi and Kodaira, 6.67–7.00% yields provide tangible cash-flow room, at the cost of weaker liquidity, stronger tenant bargaining power, and a notably narrower buyer base at exit.
Fuchu sits in a rare middle ground: unit rent of ¥3,164 ranks second among the five stations, yet yield at 6.31% still clears six, making it the only station where rent strength and yield both hold up. This aligns with Teraoka’s “best value” call on the Keio Line—except from an investment lens, its edge is not cheapness but that the mismatch between demand strength and yields has not been fully priced.
Looking 12–24 months ahead, we expect suburban-station rents to keep rising for a while, while brand-station rents hover near a plateau. That implies the yield spread between the two ends could narrow modestly from today’s roughly 3.30 percentage points, but the structural gap will persist—brand premia rest on scarcity, and scarcity is not rebuilt by a few quarters of rent prints.
For investors screening assets within the 30-minute Shinjuku ring, do one simple thing: don’t just compare sticker prices—put rent per sqm and gross yield on the same page. Pulling both by station on Urbalytics takes only a few minutes, and it makes clear whether the extra you pay is buying cash flow—or other people’s imagination about a place name.
#TokyoRealEstate #Shinjuku30MinZone #BrandLine #YoyogiUehara #Kokubunji #Fuchu #Tanashi #Kodaira #SeibuShinjukuLine #KeioLine #OdakyuLine #ChuoLine #GrossYield #RentPerSqm #WholeBuildingIncomeProperty #Urbalytics
References
- President Online (republished by Yahoo! News), Aug 16, 2026, 「「新宿まで30分」は同じでも、住宅価格は3000万円違う…住宅コンサルが分析した「最強コスパのブランド沿線」」 (Takashi Teraoka), https://news.yahoo.co.jp/articles/f6682fdb1eb9598342f0c8d23f6571c59ab41a27
- Urbalytics platform data (rent_stats / MANSION scope), Aug 2026, station-level rental listing statistics for Yoyogi-Uehara, Fuchu, Kokubunji, Tanashi, Kodaira, https://www.urbalytics.jp
- Urbalytics platform data (building_cap_rate_stats scope), Aug 2026, gross-yield distribution for whole-building income assets at the same five stations, https://www.urbalytics.jp
- Kenbiya, Aug 16, 2026, 「西武線の新型特急列車トキイロは、田無・新所沢にも停車!」 (Seibu Shinjuku Line corridor developments), https://www.kenbiya.com/ar/ns/region/shutoken/10427.html