Words: 1566 | Estimated Reading Time: 8 minutes | Views: 36
In Tokyo’s 23 wards, the true discount on aging single-building assets isn’t the construction year; it’s the operational inertia that keeps rents suppressed at roughly half of market.
A contrarian case: Spending two years of rent to move monthly from 60,000 to 110,000
In Japan’s real estate investment circle, a near-sacrosanct rule says: “Don’t spend too much on renovations,” “Don’t overdo it.” The logic sounds airtight—old buildings have long payback periods, and you can’t easily recoup heavy capex through rent. But a case disclosed by Rakumachi News on August 13, 2026, turns that rule on its head.
Takashi Sekita, a 13-year investor who owns seven buildings across Tokyo and Saitama, acquired in 2022 a 12-unit steel-frame property in Katsushika, Tokyo, 40 years old, all 2DK, for JPY 110 million, showing about a 9% gross yield at purchase, financed by a Shinkin credit union. This year, when a roughly 40 m² unit turned over, he replaced floors and wallpaper, and nearly the entire kitchen, bath, and MEP. The per-unit capex totaled about JPY 3.6 million.
The result: the monthly rent jumped from the JPY 60,000 band to the JPY 110,000 band—about a JPY 50,000 lift, or roughly JPY 600,000 more per year. Dividing spend by incremental income implies an ~16% return on this capex, well above any fixed-income product in Japan at the time.
Note the cadence: move-out at end-February, completion end-April, lease signed in August—about three months of active marketing. The achieved rent slightly exceeded the local upper bound for comparable units, yet he did not cut price due to vacancy—the patience was ultimately validated by the market.
First Urbalytics takeaway: JPY 110,000 wasn’t a “stretch price”; it was “back to average”
The easiest line in this case to misread is the investor’s self-assessment that he set a “challenge price” slightly above the local ceiling. Urbalytics’ rent statistics suggest he actually understated the pricing versus market.
Urbalytics data show that for 30–55 m² rentals in the Kameari station area, the average monthly rent is JPY 118,300 (average size 39.11 m², 126 samples), with a median unit rent of about JPY 3,120 per m² per month. In other words, this ~40 m² unit at around JPY 110,000 sits squarely on the area average—hardly a premium.
What was truly anomalous was the pre-renovation rent: the JPY 60,000 band—about half the area average. The building had originally been pushed during the Suruga Bank era of full-LTV sales by aggressive intermediaries; the prior owner sustained headline occupancy with very low-rent tenants. The root cause of the suppressed rent wasn’t the building’s age—it was the operating approach.
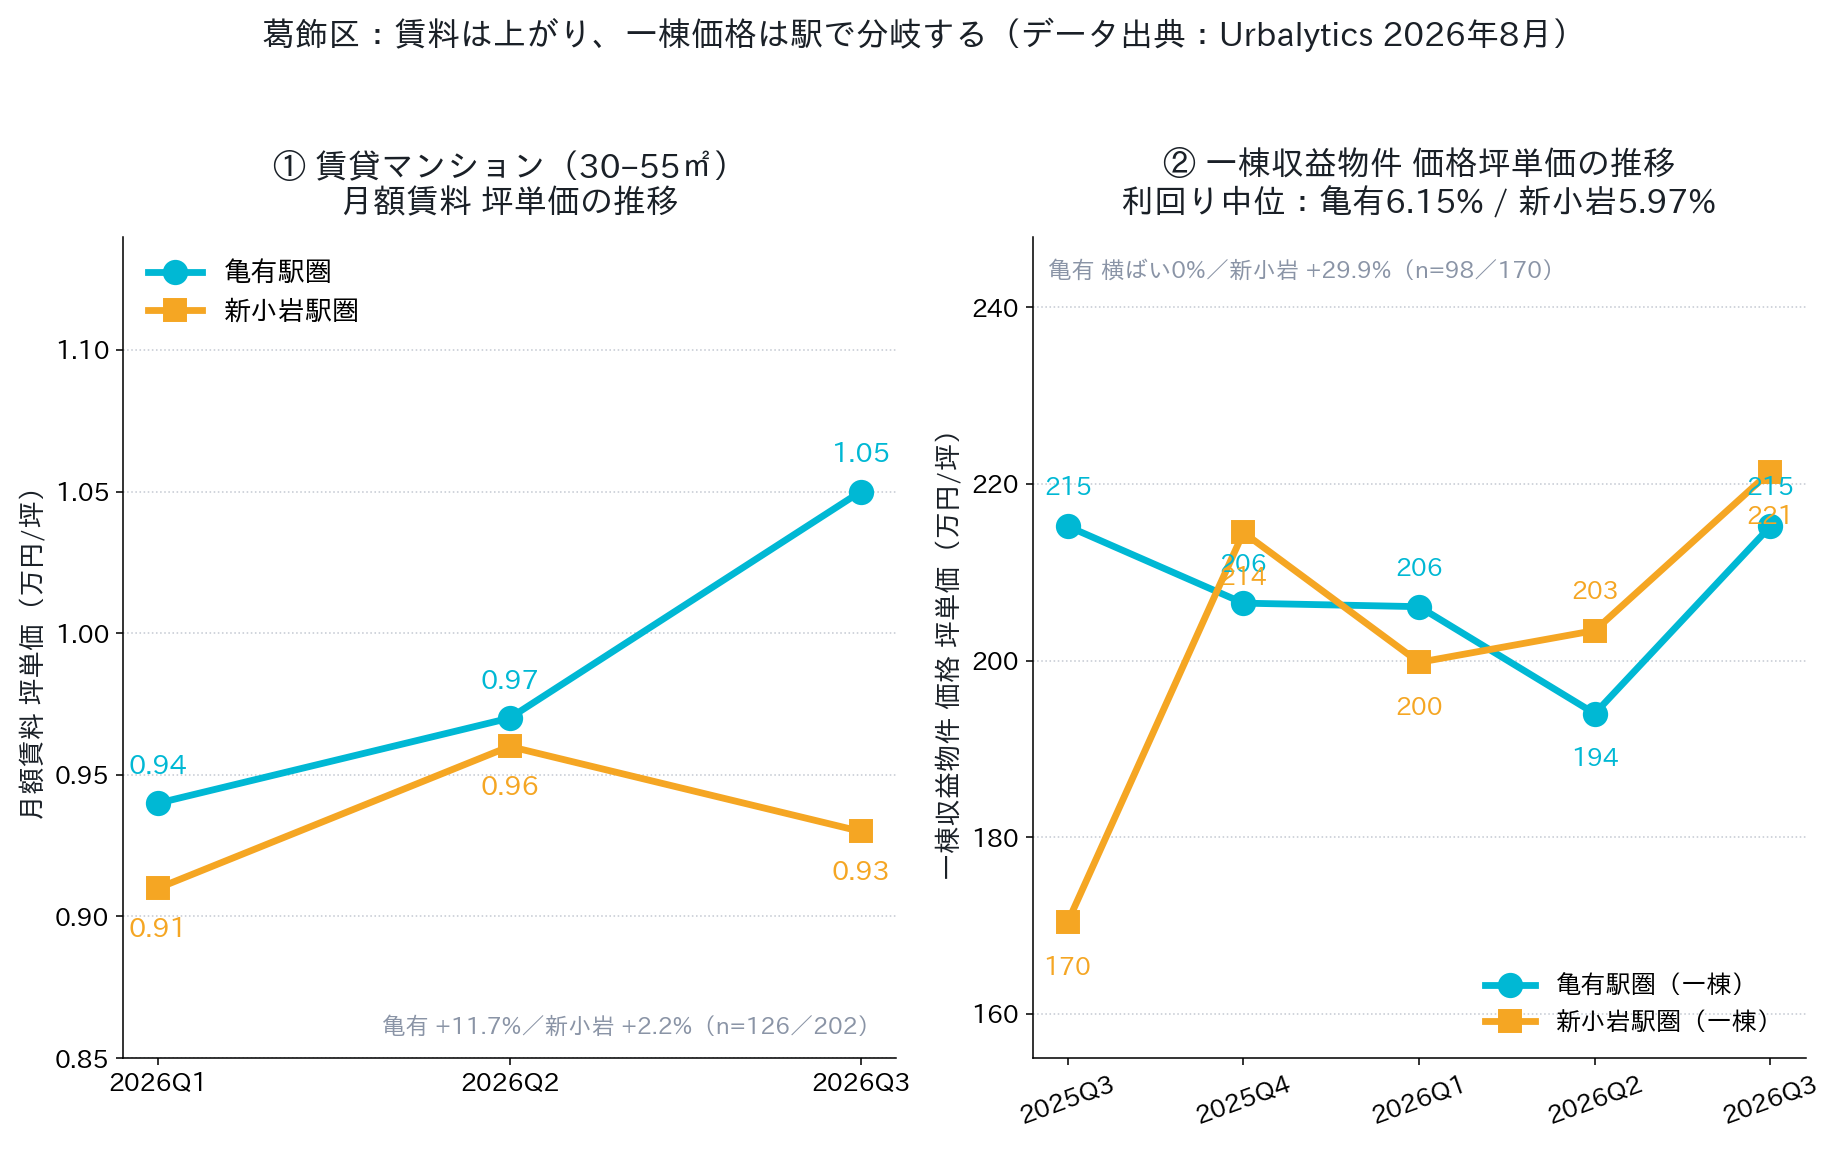
Urbalytics Insight Juxtaposing two internal datasets sharpens the view: Kameari’s monthly rent per tsubo rose from 0.94 man-yen in 2026 Q1 to 1.05 man-yen in Q3—an 11.7% increase in three quarters; yet one-building income asset pricing per tsubo in the same area was essentially flat year over year (215 man-yen/tsubo in both 2025 Q3 and 2026 Q3). Rents are rising while prices aren’t, meaning this year’s yield improvement is entirely rent-driven, not a function of “buying cheap.”
Same ward, two stations: Why Kameari is more attractive than Shin-Koiwa
Data-driven judgment can’t stop at a coarse “Katsushika rents are rising.” Comparing Kameari with another major station in the ward, Shin-Koiwa, reveals immediate divergence.
In Shin-Koiwa, 30–55 m² rentals average JPY 118,600 per month—almost identical to Kameari—but the average size is 41.13 m²; the median unit rent computes to just JPY 2,760 per m² per month, about 12% below Kameari. More importantly, the trend differs: Kameari’s rent per tsubo climbed 11.7% over three quarters, while Shin-Koiwa rose only about 2.2%, slipping from 0.96 to 0.93 man-yen in Q3.
The sales side diverges in the opposite way. In Shin-Koiwa, one-building income asset pricing rose from 170 man-yen/tsubo in 2025 Q3 to 221 man-yen/tsubo in 2026 Q3, a 29.9% annual gain; Kameari was flat over the same period. The result: Shin-Koiwa’s median gross yield compressed to 5.97%, now below Kameari’s 6.15%.
These data support two practical takeaways for acquirers:
First, Shin-Koiwa is already fully priced by capital; rent growth is lagging price growth, so new entrants must accept lower yields in a market with weaker rent momentum.
Second, Kameari is the reverse—prices have moved sideways for a year while rents are accelerating. This “prices haven’t caught up with rents” window is exactly where value-add operators capable of lifting in-place rents should focus.
Treat renovation as capex: How much asset value did JPY 3.6M create?
Retail investors often view renovation as an expense; professionals treat it as capital expenditure and use a capitalization rate to translate income gains into value. This conversion is the most underrated step in the entire case.
Per unit, a JPY 600,000 annual uplift capitalized at Kameari’s median one-building gross yield of 6.15% implies a value increase of roughly JPY 9.76 million—turning a JPY 3.6 million outlay into nearly 3x in asset value. The investor himself offered similar math: a JPY 30,000 monthly increase equals JPY 360,000 annually, worth JPY 3.6 million at a 10% market yield and JPY 7.2 million at a 5% yield.
At the property level, the numbers are even more compelling. Of 12 units, six have been renovated; including roof waterproofing and major repairs, total capex is about JPY 35 million. Annual rent is up about JPY 2.7 million since acquisition, reaching JPY 12.7 million. On acquisition price plus capex (about JPY 145 million), the current gross yield is roughly 8.7%.
Capitalizing that JPY 12.7 million at the Kameari station-area median gross yield of 6.15% implies a theoretical asset value of about JPY 206.5 million—versus JPY 145 million invested, a paper gain of ~JPY 61.5 million, over 40%. Another realized example cited by the investor supports this path: a Fuchu apartment bought for JPY 35 million in 2015 and sold for JPY 83.6 million in 2023.
What’s replicable—and what isn’t
The real lesson here isn’t “spend more,” but three portable practices.
On budget discipline, he sets a per-unit capex ceiling at “within two years of the new rent.” At JPY 110,000 new rent, the cap would be about JPY 2.64 million—this case’s JPY 3.6 million exceeds it due to material inflation plus full MEP replacement. In other words, this was a deliberate rule-bend—a conviction bet, not the standard playbook.
On execution, he split works between a finishes contractor and an equipment/MEP contractor; towel bars, lighting, and similar items were owner-supplied to reduce cost without downgrading materials. Wallpaper was standardized to six SKUs in the higher-grade “1000 series” (about 1.5x mass-market). Doors were wrapped with Di-Noc and Reatec films, at JPY 30,000–50,000 per leaf. For communication, he used the Scaniverse app on iPhone to 3D-scan entire rooms and shared spec sheets via LINE with drawings and photos—pragmatic given older trades on site where text-only instructions can drift.
Risk warning This approach has clear boundaries—cross-border investors, take note: it presupposes you bought “at roughly land value.” On a 500 m² site within Tokyo’s 23 wards—even with bus feeder access and less-than-ideal convenience—the land provides a value floor. Copying “over-renovation” in areas with weak land-value support risks turning capex into a sunk cost. Also, Kenbiya’s April–June 2026 buyer report shows over 80% of closings were by experienced investors, indicating buyer concentration among veterans; for newcomers using high leverage, the margin for error on this playbook is shrinking.
Conclusion: On Tokyo’s 23-ward periphery, the mispricing is operational
Also on August 13, 2026, Money Post WEB cited analyst Toshio Nakayama noting signs of price adjustment across Tokyo’s six central wards. A Kenbiya column discussed how the first coordinated intervention in 28 years and consumption tax cuts nudging rates higher could pressure real estate prices. As core-area price elasticity compresses and the rate outlook turns uncertain, the “buy-and-it-rises” capital gains window is closing.
The remaining alpha has shifted to operations in the outer wards. This case sends a clear signal: for an older building in Tokyo’s 23 wards, the discount need not be construction age but operational inertia that holds rents to half of market—a discount buyers can actively eliminate through renovation and repricing.
For acquisition teams, the screening logic becomes actionable: prioritize station areas where rent per tsubo is rising while one-building price per tsubo is flat; then target assets with in-place rents far below the station-area median. That intersection is exactly what Urbalytics’ rent statistics and one-building yield distributions can jointly surface—and it offers far higher hit rates than chasing fully priced core assets.
#TokyoRealEstate #Katsushika #Kameari #ShinKoiwa #Tokyo23Wards #OneBuildingIncomeAsset #AgingAssets #ValueAddRenovation #RentGrowth #GrossYield #CapRate #RealEstateInvestment #LandValue #Urbalytics #JapanProperty
References
- Rakumachi News (Editorial Team), “Despite 40-year age, rent up by JPY 50,000: A contrarian renovation that rejects ‘don’t overdo it,’” 2026, https://www.rakumachi.jp/news/column/404565
- Kenbiya, “Over 80% of closed buyers have prior experience — ‘Real Estate Investment Buyer Trends Report, Apr–Jun 2026’ released,” 2026, https://www.kenbiya.com/ar/ns/research/r_other/10420.html
- Kenbiya (Okamoto column), “Will real estate prices fall as coordinated intervention (first in 28 years) and a consumption tax cut push rates higher?” 2026, https://www.kenbiya.com/ar/cl/okamoto/192.html
- Money Post WEB, “The true face of price ‘anomalies’ in existing condos across Tokyo’s 23 wards: Signs of adjustment in the six central wards vs. data suggesting strong latent end-user demand,” 2026, https://news.yahoo.co.jp/articles/4853482b6bed5d0193f81a23d6443f9a2537364b
- Urbalytics Rent Statistics & One-Building Yield Statistics (Kameari/Shin-Koiwa station areas), 2026, https://www.urbalytics.jp/