Words: 1398 | Estimated Reading Time: 7 minutes | Views: 255
After peaking in April, secondary-market prices in Tokyo’s Core Six have fallen for two straight months. Interest rates are the true switch; Japan’s property market is shifting from a trend-driven market to a stock-picking market.
A turning point obscured by market sentiment
In the first half of 2026, the average price of newly built for-sale condominiums in Greater Tokyo (新築分譲マンション) surpassed the ¥100 million mark for the first time, reaching ¥100,135,000. This figure has been repeatedly cited by the media as the strongest proof that “Japan’s housing market is still rising.”
But what investors should really watch is the directional shift in the secondary market over the same period. According to Tokyo Kantei (東京カンテイ), prices for second-hand condominiums in the Core Six—Chiyoda, Chuo, Minato, Shinjuku, Bunkyo, and Shibuya—hit a historic peak of ¥188,220,000 in April 2026 before turning down.
May came in at ¥187,480,000, down 0.4% m/m; June was ¥185,120,000, a further 1.3% m/m decline. Two consecutive monthly drops, with the decline widening—for investors who profit from price spreads, this signal matters more than the new-build average breaking through ¥100 million.
At this juncture, Forbes JAPAN interviewed Shogo Tanaka, Senior Executive Managing Director at Mitsubishi UFJ Trust and Banking, who has spent 35 years on the real estate front line. His view is blunt: the logic behind this upcycle remains, but the window where you could “buy anything and make money” has closed.
“This is not a bubble” — three reasons from a practitioner
Tanaka does not equate today’s price levels with the late-Showa bubble. His core case is that no matter how high prices go, there are buyers, and transactions are not clearing below institutions’ own valuation expectations. In other words, market clearing is real; it’s not a musical-chairs game propped up by credit illusions.
He breaks the rationale into three parts:
First, developers’ ability to create value has tangibly improved. Today’s high-end condos routinely offer biometric access control, residents-only dining, gyms, cafes, even pools; there are many cases of Showa-era buildings being refurbished into products that surpass new builds, thereby lifting rents and asset values.
Second, the financialization of real estate has taken firm root after a quarter century. Since the late 1990s, securitization and liquidity have greatly increased asset transparency and significantly expanded the pool of willing capital.
Third, from a global perspective, Japanese real estate remains “relatively inexpensive.” As overseas investors put it: among developed markets where inflation pressure is modest and yields exceed interest rates, allowing leverage via loans, Japan is the only one left; a super-weak yen has further reinforced that view.
Urbalytics internal data: core-area whole-building yields are hugging the 3% line
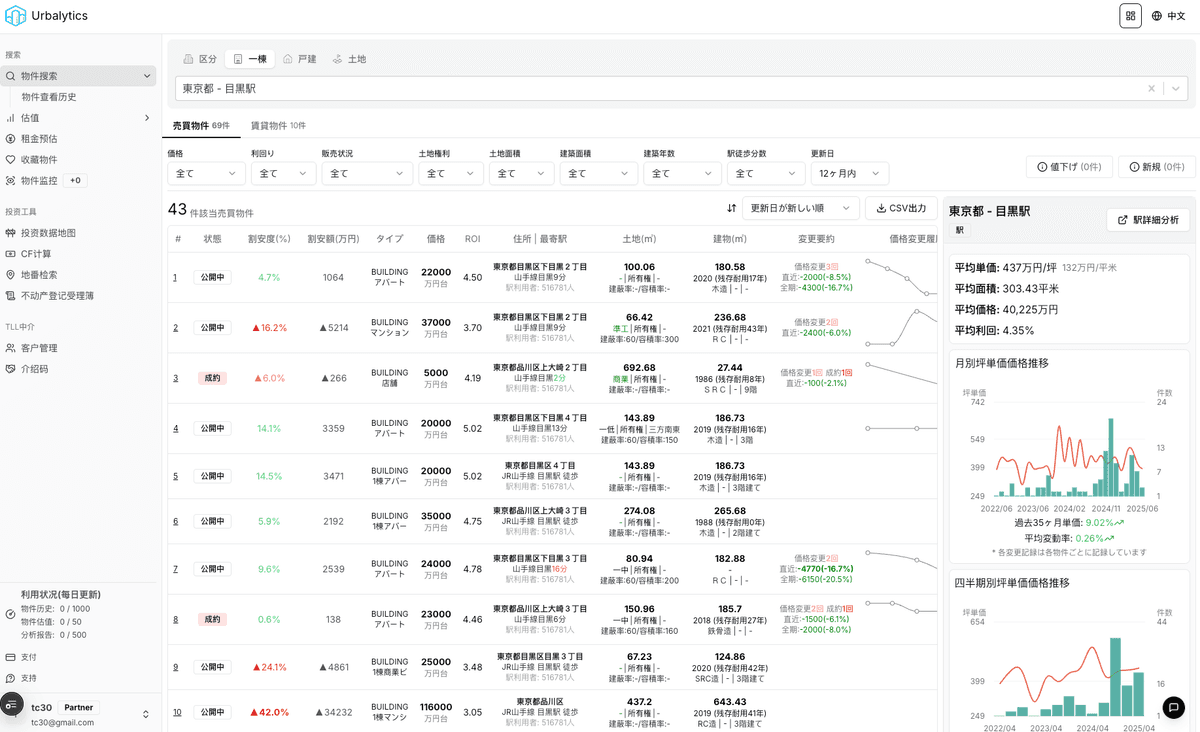
Tanaka’s macro take aligns closely with our own closed and active data. Using the Urbalytics platform to map yield distributions for whole buildings (一棟) on the market around major core stations reveals a clear stratification.
In the Shibuya station area (55 samples), the median gross yield (表面利回り) is 3.40%, with an average asking price of roughly ¥846 million; in the Roppongi station area (19 samples), the median is 3.45% with an average price as high as ¥1.521 billion. In these two core business and prime residential districts, yields are transacting almost right on the 3% line.
Across 31 Shinjuku-area samples, the median is 4.27%, noticeably above the first two. The gap does not mean Shinjuku is “cheap”; it reflects the prevalence of Showa-era stock around Kabukicho—assets completed in the 1960s–1980s account for a substantial share, and the yield embeds compensation for building age and redevelopment costs.
On the rent side, we see a different picture. Across 436 rental-apartment samples in the Shibuya station area, average monthly rent per tsubo fell back from ¥24,200 in Q4 2025 and then stabilized at ¥20,200 in Q2 and Q3 2026, moving sideways for two consecutive quarters. Prices are churning near highs while rents have stopped rising—arithmetically, that is what has compressed yields toward ~3%.
Urbalytics Insight The value of Urbalytics’ internal data is that it’s not media-rehashed regional averages but the real-time aggregation of individual active-for-sale and for-lease records. Tanaka’s industry sense that “effective yields on newly built rental apartments in the Core Three are below 3%” is quantitatively corroborated in our samples: Shibuya 3.40%, Roppongi 3.45%—their medians sit less than 50 bps above 3.0%. For quarters with very small samples (e.g., n=3), we flag them as reference values to avoid misleading judgments from single-digit data.
Interest rates are the real switch
Why hasn’t core-area pricing cracked after two years of a rising-rate macro narrative? Tanaka points to expectations: the Bank of Japan has moved only 25 bps at a time, at a gentle pace, and consensus at home and abroad expects no sharp hikes—so the market remains willing to take on high-priced assets with low funding costs.
But he also drew the boundary where this assumption fails. If the BoJ advances faster than expected, or strings together 25 bp hikes in quick succession, ultimately lifting rates toward other developed markets, then at today’s cap rates (キャップレート) the math simply won’t work.
In fact, newly built rental apartments in prime locations across the Core Three now often trade at sub-3% effective yields. If Japanese interest rates reach 3% or even 5%, that’s a full inversion—only equity-rich buyers could keep transacting, and they will then ask: with higher-yielding financial products available, why lock capital in real estate?
Risk alert Translating the above into an owner’s action list, the risks are very concrete: core assets bought at just over 3% yields with floating-rate leverage are extremely sensitive to rate moves. Every 10 bps of additional yield compression thins valuation headroom; and with rents flat, relying on rent growth to offset rising interest costs is not a near-term option.

Data sources and current market conditions
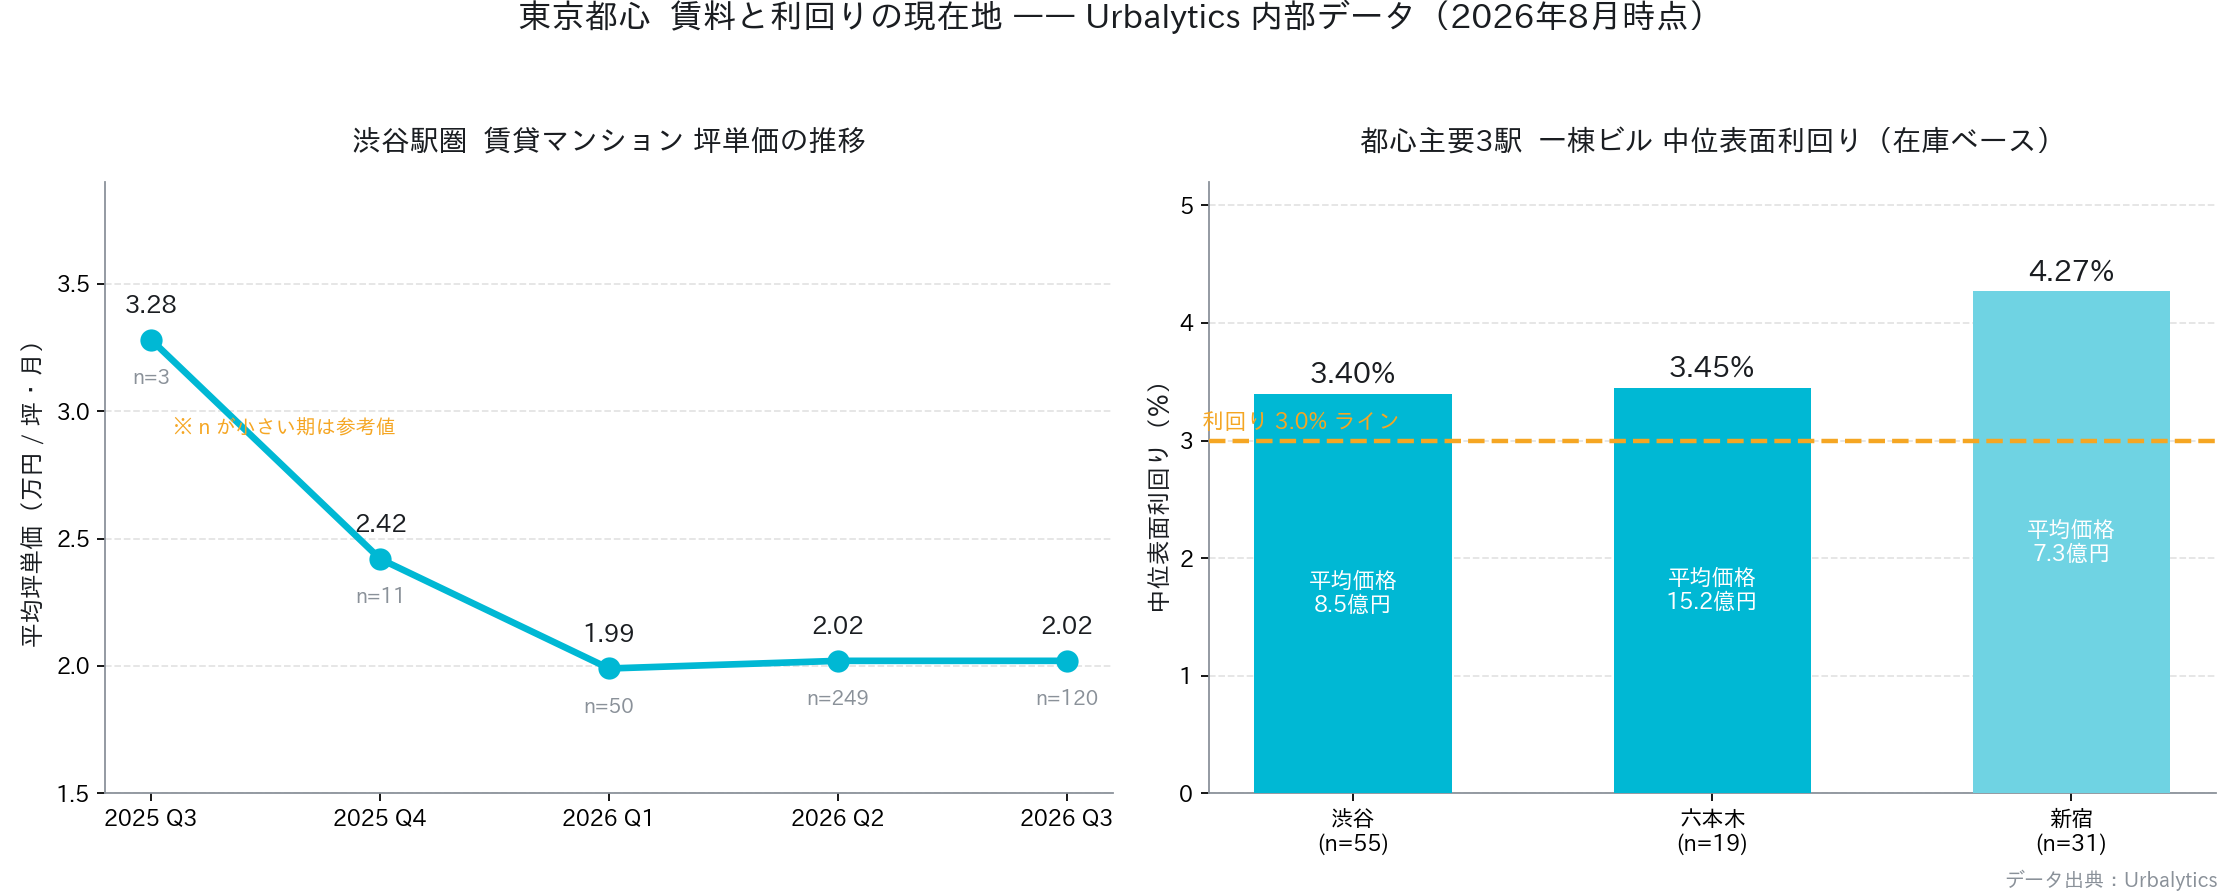
The chart on the left shows the quarterly trend in per‑tsubo rents for Shibuya-area rentals; the right plots median gross yields and average asking prices for whole buildings across three core station areas. Viewed together, the takeaway is clearer than any market soundbite: asset prices are holding near highs, rents no longer provide fresh upside, and the yield cushion is thinning.
Note that the yields on the right are gross yields based on listed-inventory samples and exclude management fees, repair costs, and vacancy losses; effective yields are a notch lower. This is why Tanaka’s “below 3%” and our “3.4% median” actually describe the same reality.
After the “buy anything and make money” phase, what should individual investors do?
Tanaka is not pessimistic about the future, but he keeps returning to one premise: from here on, returns come from selection skill (目利き) and value creation, not from a rising market tide. He groups successful wealthy investors into three types—those with professional-grade research capability, those with deep capital who can go contrarian, and those with top-tier advisors.
For newcomers, his advice is surprisingly conservative. If you don’t insist on physical assets, J‑REITs and the still‑nascent real estate security token (セキュリティ・トークン) market offer lower entry thresholds and more controllable volatility—options that fit low-risk/low-return or medium-risk/medium-return profiles.
If you must buy physical assets, he suggests starting with a studio-type condo you’d personally be happy to live in and that you judge can command higher rent today. For instance, if you enjoy interior design, redo the finishes and adjust the layout at tenant turnover so the next tenant pays more—that’s how value is created.
This logic is identical for individual investors and foreign funds managing hundreds of billions of yen: all returns ultimately collapse to one question—what value did you add to this asset? In a trend market you could ignore that question; in a selection market, it’s the only one.
For investors evaluating core-area assets, rather than arguing about whether “this is the top,” first benchmark your target’s yield within the area’s distribution. Urbalytics’ yield statistics and rent benchmarking tools can do this in minutes.
#TokyoCoreSix #Shibuya #Roppongi #Shinjuku #JapanRealEstate #ResaleCondo #表面利回り #WholeBuildingInvestment #BoJRateHikes #キャップレート #MitsubishiUFJTrust #JapanPropertyInvestment #TokyoHomePrices #RentBenchmarking #Urbalytics
References
- Forbes JAPAN, 2026, 「不動産投資、『何を買っても儲かる時代』の終わり 三菱UFJ信託銀行専務が語る次の視点」 https://news.yahoo.co.jp/articles/27096f43ce8042d7a1df723cdd067a3da6caeec3
- 東洋経済オンライン, 2026, 「住宅ローンの超長期化『40年・50年』が常識になる日…銀行は『年収倍率』より『返済比率』を重視」 https://toyokeizai.net/articles/-/953551?display=b
- 不動産経済研究所, 2026, 首都圏新築分譲マンション市場動向(2026年上半期) https://www.fudousankeizai.co.jp/mansion
- 東京カンテイ, 2026, 中古マンション価格月別動向(都心6区) https://www.kantei.ne.jp/report/
- Urbalytics, 2026, 一棟ビル利回り統計・賃料統計(渋谷/六本木/新宿 駅圏・2026年8月時点) https://www.urbalytics.jp