Words: 1300 | Estimated Reading Time: 7 minutes | Views: 33
Tokyo’s 23 wards saw their first price decline in 26 months, but the real early warning wasn’t price—it was transaction turnover at the station level.
I. The first crack in the price myth
Over the past two years, Tokyo real estate could almost be summed up in one line: still rising. That line stopped working in June 2026.
According to real estate research firm Tokyo Kantei (東京カンテイ), in June 2026 the Tokyo metro’s resale condominium price (70 m² equivalent) across Tokyo, Kanagawa, Saitama, and Chiba was JPY 74.54 million, marking 23 consecutive months of gains; but the 23 wards posted their first decline in 26 months.
The 23-ward average is still JPY 127.41 million—seemingly in the “100-million club.” What matters is the structure: declines are widening in the six central wards, meaning the very submarkets that led on the way up are now dragging on the aggregate.
This isn’t a crash signal, but it does mean one thing: the crude logic of “buy anywhere and it goes up” is failing. The market is relearning to separate demand-backed areas from those lifted by sentiment.
II. The metric professionals actually watch isn’t price
Weekly Post, working with real estate big-data AI firm Estate Technologies, compiled “days on market (販売日数)” for resale condos by station—the time from listing to closing—then compared year over year to rank the 100 worst stations in the metro by pace of deterioration.
Why days on market rather than price? The firm’s CMO, Saori Fukunaga, gives a practical answer: acquirers watch inventory changes and DOM as a read on “marketability”; where marketability worsens, they hesitate to buy.
She also points to a plainer phenomenon: some brokerages and purchase-and-resale operators report seller mandates have doubled year over year. When mandates double while sales velocity slows, together they signal a loosening seller’s market.
Price is a lagging indicator, because sellers are the last to cut; DOM is a leading indicator—it records buyers voting with their feet. When listings swell and closings slow, price cuts are usually only a matter of time.
III. The list is full of names that “shouldn’t be there”
What really makes the ranking provocative are the stations on it. No surprise at No. 1 Hongo-sanchome or No. 100 Asakadai in Saitama. The oddities sit in the middle.
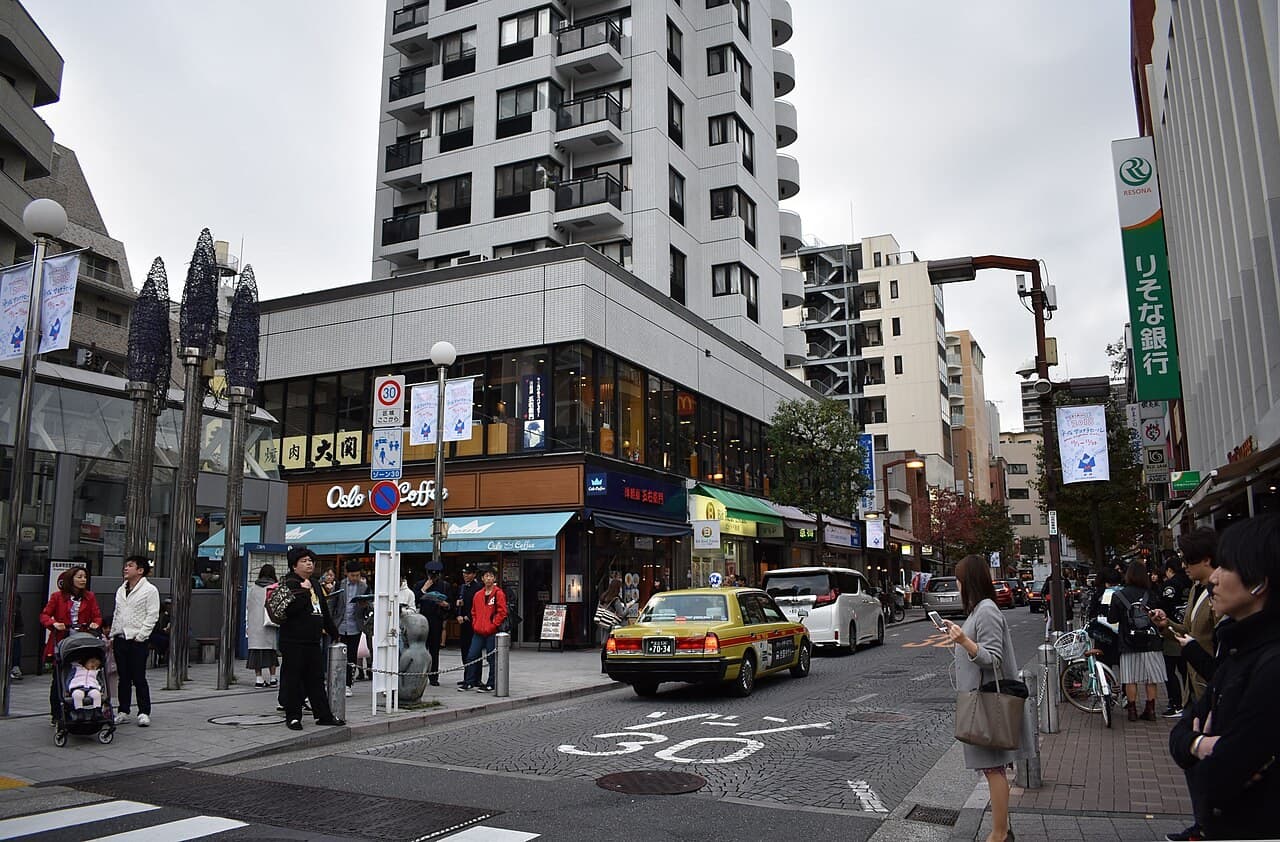
Azabu-Juban comes in 28th. Housing commentator Yukio Sakurai notes the station only opened in 2000; before that it was a “landlocked island,” leaving many Showa-era, mass-market apartments. In recent years even 30+ year-old stock dared to ask aggressive prices; now they finally aren’t moving: discounts are evident, yet DOM keeps lengthening.
Tamachi (47th) and Shinagawa (59th) are “unexpected,” says property adviser and Sakura Office president Naoya Yamamoto. The area has a full suite of long-run tailwinds: Takanawa Gateway’s opening, the broader Shinagawa-area redevelopment, and the Linear Chuo Shinkansen breaking ground.
Bayfront Kachidoki (62nd) is likewise unexpected. Yamamoto’s explanation points to the same mechanism: these areas cluster large towers, so listing inventory is heavy by design; demand can’t keep pace with supply, and with prices elevated, near-term absorption slows.
In short, the reason they made the list isn’t that “these places are bad,” but that “their strengths were priced in ahead of time.”
IV. Zooming in: four stations in Urbalytics data
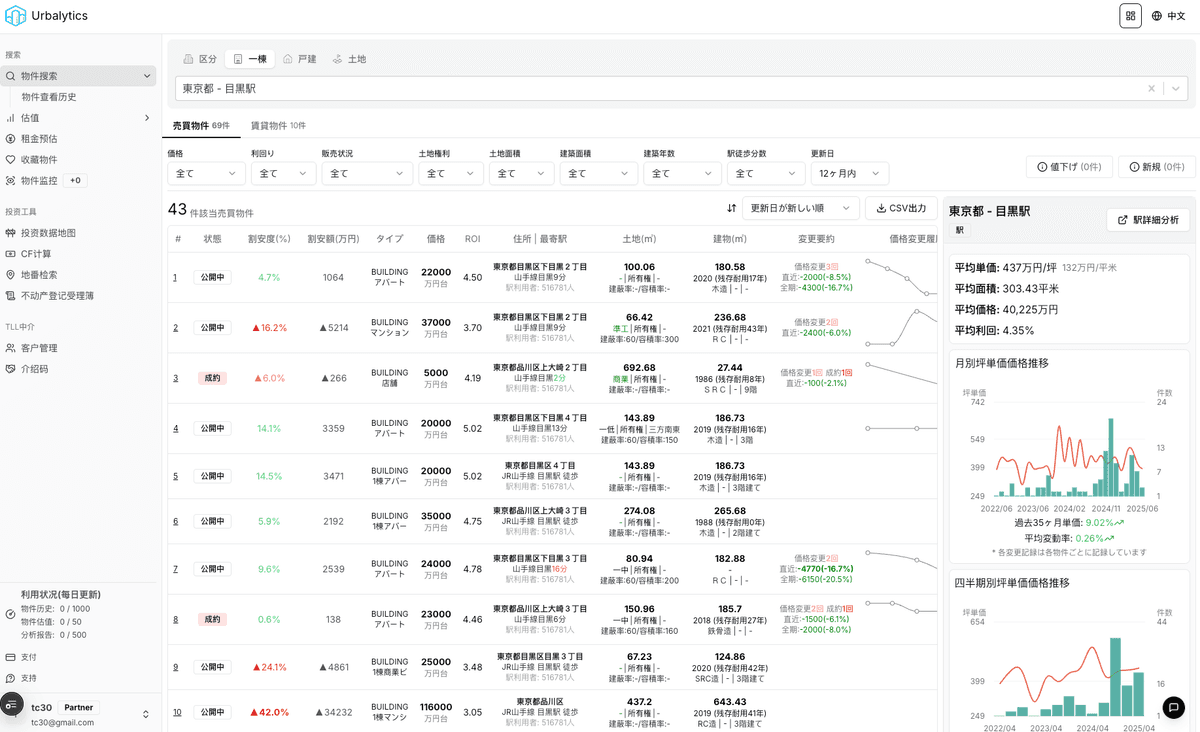
Rankings are headlines, not investment theses. Using Urbalytics’ area data, we separate rental fundamentals and yield for the four stations; the picture is more nuanced than “not selling.”
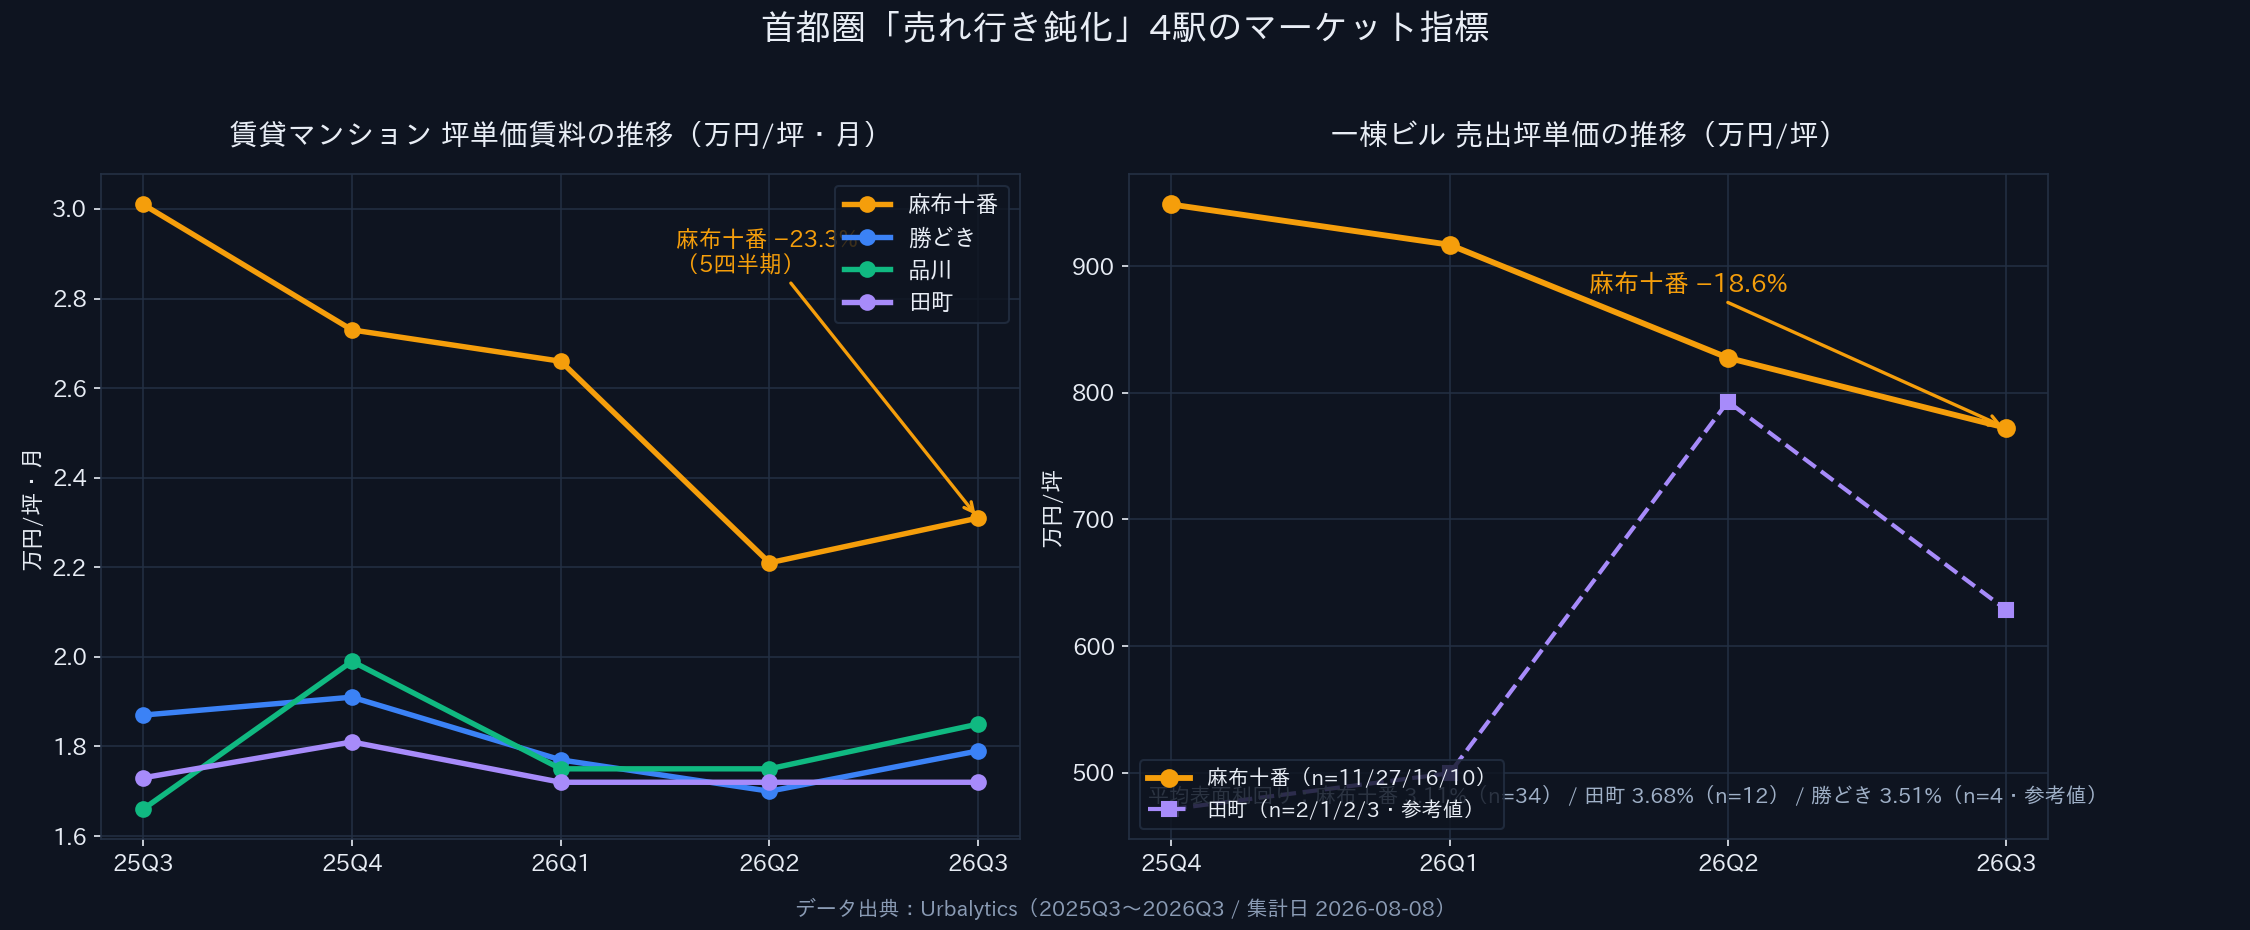
Rents first. Azabu-Juban’s rental apartment asking rent per tsubo fell from JPY 30,100/tsubo·month in 2025 Q3 to JPY 23,100/tsubo·month in 2026 Q3—down 23.3% over five quarters. Over the same period, Kachidoki fell just 4.3%, Tamachi was nearly flat (-0.6%), while Shinagawa rose 11.5%.
That contrast matters: Azabu-Juban is weakening on both rents and for-sale activity, whereas Shinagawa is slower on transactions but rents remain firm. The former suggests repricing; the latter looks like inventory digestion.
Whole-building assets next. Urbalytics data show Azabu-Juban’s asking price per tsubo for entire buildings fell from JPY 9.48 million/tsubo in 2025 Q4 to JPY 7.72 million/tsubo in 2026 Q3—an 18.6% retreat in three quarters; the average gross yield is only 3.11% (n=34).
Urbalytics Insight Internal Urbalytics data show average gross yields for whole-building assets at 3.11% for Azabu-Juban, 3.68% for Tamachi, and 3.51% for Kachidoki (only four samples—indicative only). With the policy rate back at 0.75%, gross yields just over 3% leave razor-thin leverage spreads—precisely why acquisition appetite is fading and deal cycles are stretching.
V. Drivers and outlook
Taken together, the slowdown isn’t mysterious—three distinct but reinforcing threads:
First, pricing rigidity. Sellers’ anchors remain at 2024–2025 highs, while buyers’ budgets are constrained by rates and incomes, leaving a gap that only time can bridge; DOM is the time cost of that gap.
Second, concentrated release of tower inventory. In areas like Kachidoki, Tamachi, and Shinagawa, large towers have delivered in clusters in recent years; dozens of units from the same building list simultaneously, giving buyers ample room to comparison-shop. The units that move quickly are always the softest-priced few.
Third, funding costs. For the first time in 30 years the policy rate is back at 0.75%, eroding the financing leg of the “low yield but will appreciate” story. Assets with gross yields just over 3% are hard to make work with leverage.
Over the next 12 months, a realistic view is that nominal prices in the six central wards will likely trade sideways with a soft bias, while dispersion widens at the station level. Areas where rents remain firm (e.g., Shinagawa) are more likely to be “slow but not falling,” whereas areas where both rents and sale prices are slipping (e.g., portions of Azabu-Juban’s older stock) warrant caution about true repricing.
Risk disclosure Note that the station ranking cited here is based on the “year-over-year deterioration rate in days on market,” which measures speed of change rather than absolute level—a station that was extremely fast may still be faster than the market average even after worsening. Equating deterioration with “this area will fall” is a common misread. In addition, whole-building yield sample sizes for Kachidoki and Tamachi are small (4 and 12 respectively) and should be treated as reference only.
Conclusion: from “where it will rise” to “where it will sell”
The real value of this ranking is not in telling you which stations are risky, but in signaling a shift in thinking: in an up-cycle, investors ask “where will it rise”; in a consolidation, the sharper question is “where will it sell.”
Liquidity is never free. When twenty sellers in the same tower are waiting for the same buyer, a pretty notional price doesn’t mean you can exit when you need to.
For investors planning to enter or exit at this stage, the job isn’t top- or bottom-calling, but lining up station-level rent trends, whole-building yield distributions, and real listing turnover on a single sheet for comparison. Urbalytics’ area data and yield-statistics tools are built for exactly this.
#TokyoRealEstate #AzabuJuban #Tamachi #Shinagawa #Kachidoki #GreaterTokyoResaleCondos #DaysOnMarket #Tokyo23WardsPrices #CentralSixWards #TowerInvesting #GrossYield #JapanPropertyInvestment #TokyoKantei #PolicyRate #Urbalytics
References
- Money Post WEB (Weekly Post Aug 14/21, 2026 issue), 2026, “Why in some of the metro’s most popular areas?” Azabu-Juban, Tamachi, Shinagawa, Kachidoki… AI analysis of big real estate data reveals the reasons for “slower resale-condo sales,” https://news.yahoo.co.jp/articles/b6e1c6eb418c641bc90d1bc6039204bde68c6ccb
- Money Post WEB, 2026, [“Risky stations” ranking for real estate prices in the Tokyo metro] — the 100 worst stations for “slowing resale-condo sales,” https://www.moneypost.jp/1430277
- Tokyo Kantei, 2026, 70 m²-equivalent prices for resale condominiums (June 2026 — Greater Tokyo / Tokyo’s 23 wards), https://www.kantei.ne.jp/
- Urbalytics, 2026, Rent statistics and whole-building yield statistics (Azabu-Juban / Tamachi / Shinagawa / Kachidoki, 2025Q3–2026Q3), https://www.urbalytics.jp/