Words: 1439 | Estimated Reading Time: 8 minutes | Views: 38
Against the backdrop of Japan losing 3.10 million people over five years, the TX corridor’s demographic dividend is real, but it is materializing at only a handful of stations; rents around the others are quietly moving in the opposite direction.
Only two prefectures are growing nationwide, yet the winners cluster along a few lines
The 2025 National Census (国勢調査) preliminary results just delivered a hard-to-stomach figure: as of 2025, Japan’s total population was 123,049,313, down about 3,097,000 from 2020, a 2.45% decline. The drop is roughly equivalent to an entire government-designated city disappearing.
More important for investors is the distribution. At the prefectural level, only Tokyo Metropolis (+1.41%) and Okinawa Prefecture (+0.05%) posted positive growth; the other 45 prefectures all turned negative. But drop the granularity to Japan’s 1,892 municipalities and the picture changes—only 242 municipalities, about 13%, grew, creating stark spatial polarization versus the 1,649 that declined.
Giken Shoji International(技研商事インターナショナル)put it crisply in an analysis released on August 20, 2026: population growth is not spreading as a “surface”; it is distributed along transport “lines” and at specific “points.” Kanagawa, Saitama, Chiba, and Ibaraki are negative overall, yet each hides some of the fastest-growing cities in Japan.
The driver is the normalization of telework(テレワーク). It hasn’t truly pushed people into the countryside; it changed the residential choice criterion from “as-the-crow-flies distance” to “door-to-door time and transfer burden”—making Greater Tokyo’s near suburbs the biggest beneficiaries.
Two of the nation’s top three growth cities are in Chiba
Ranking cities with populations over 100,000 by growth rate, the top three are neighbors along one line: Tsukuba City, Ibaraki, had 268,991 people in 2025, up 11.31% in five years, No. 1 nationwide; Nagareyama City, Chiba, 215,130 people, up 7.65%, No. 2; Inzai City, Chiba, 110,400 people, up 7.59%, No. 3.
Further down, Asaka City, Saitama (+4.27%); Ebina City, Kanagawa (+3.77%); Tachikawa City, Tokyo (+3.03%); Yamato City, Kanagawa (+2.97%); and Yachiyo City, Chiba (+2.78%) are likewise mid-sized commuter cities directly tied into trunk rail networks. The conclusion is clear: the winners aren’t “the suburbs,” but “rail-served suburbs.”
Running in parallel is a return to the urban core. Tokyo’s Koto Ward grew 5.54%, but its absolute increase of 29,048 people was the largest in Japan; Taito Ward grew 8.01%, with a population density of 22,590.5 people per km², third highest nationwide.
The same census exposed an easily overlooked gap: while total population fell, the number of households rose 2.32% from 2020 to 57,124,347, and average household size fell from about 2.26 to about 2.15. Finer household segmentation means—even if population declines, housing demand will not fall in lockstep.
What matters isn’t the line alone—it’s the lockstep fit of “rail × development”
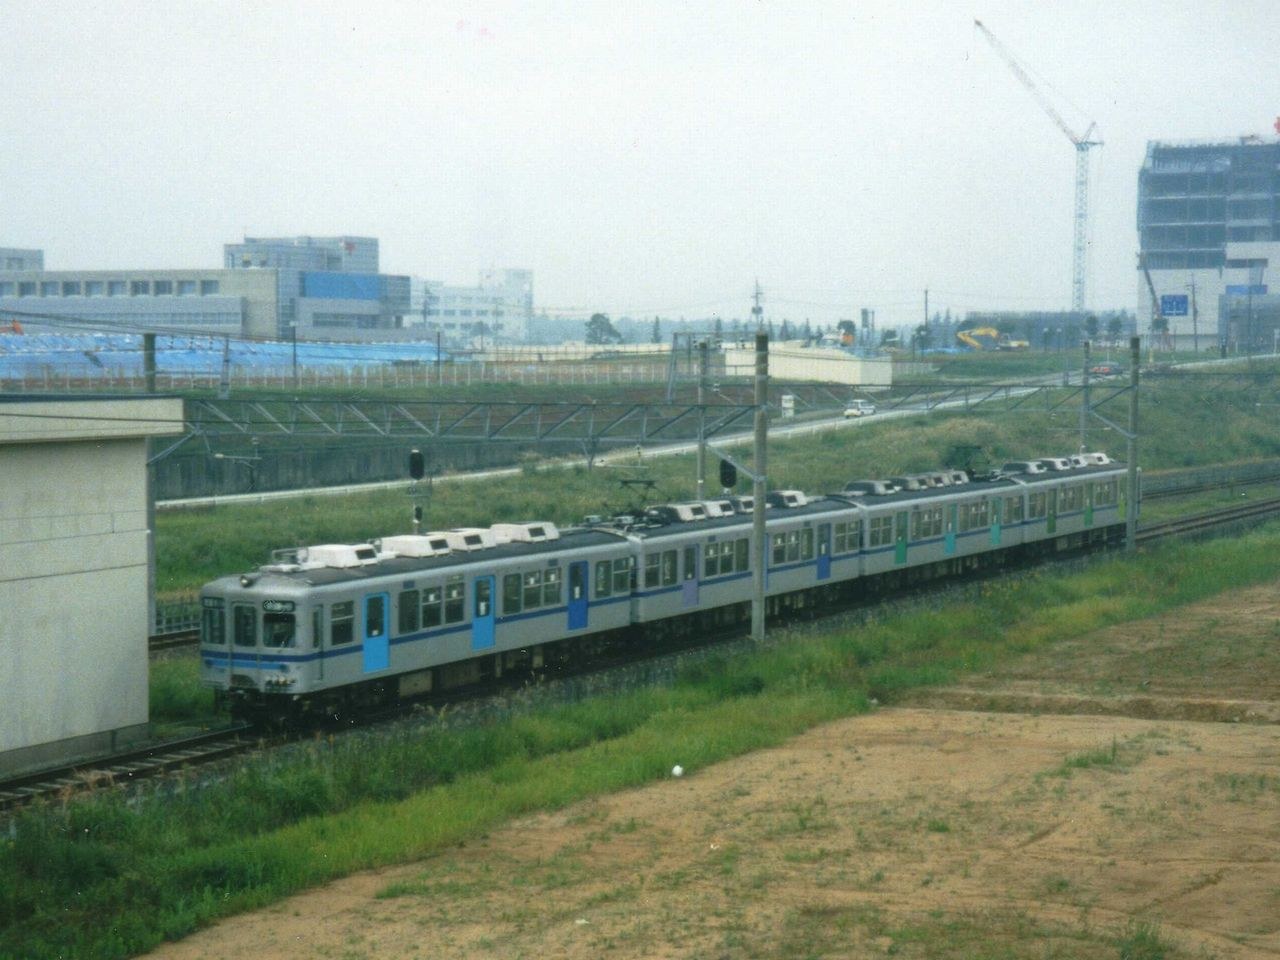
The Tsukuba Express(つくばエクスプレス, TX)opened in 2005, using DC–AC switching dead sections(デッドセクション)and Automatic Train Operation(ATO), with a top speed of 130 km/h and scheduled speed up to 112.4 km/h on some segments; Akihabara to Tsukuba takes as little as 45 minutes. Speed does compress space, but treating speed as the conclusion leads to misjudgment.
The original report had it right: the focus should be on integrated station-area development and housing supply, not the line itself. Tsukuba tops the nation because large-scale residential development overlapped with the clustering of research institutes—creating both a Tokyo-bound commuter flow and a reverse Tsukuba-bound business flow. Bidirectional volumes support both transport efficiency and destination pull.
The result of this alignment shows up in ridership: TX’s average daily passengers exceeded 400,000 in FY2024, far above projections at opening; morning peak crowding topped 150%, prompting a linewide shift to 8-car trainsets now underway, targeted for service in the early 2030s. Concepts to extend to Tokyo Station and plans to extend toward Tsuchiura on the Ibaraki side are also under substantive discussion.
Nagareyama and Inzai have, in fact, taken two different paths:
First, Nagareyama relies on rigorous, transit-oriented development (TOD)—compressing daily services into the station walkshed, then using dedicated shuttle buses between station-front pick-up/drop-off childcare stations(送迎保育ステーション)and individual daycare centers to knit trunk rail to the most tedious daily segment, directly easing commute friction for dual-income households.
Second, Inzai leverages topography and industry—flat, firm bedrock has attracted data centers and logistics facilities, and 2022 fare cuts by Hokuso Railway(北総鉄道)further boosted in-migration, turning the past “poor access” weakness into a strength as a new industry hub.
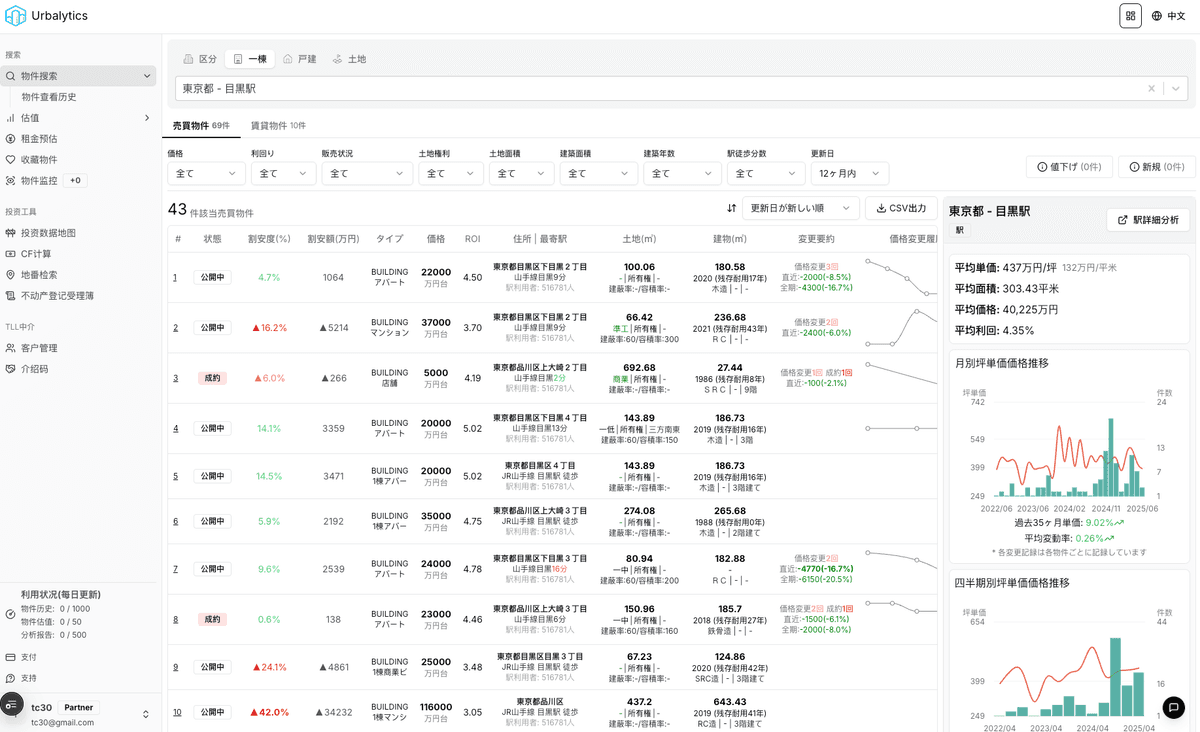
Urbalytics data: On the same line, rents are moving in two directions
Does population growth automatically turn into rent growth? We normalized a cross-section using Urbalytics’ rental statistics, and the answer is—no, and the degree of divergence is larger than intuition suggests.
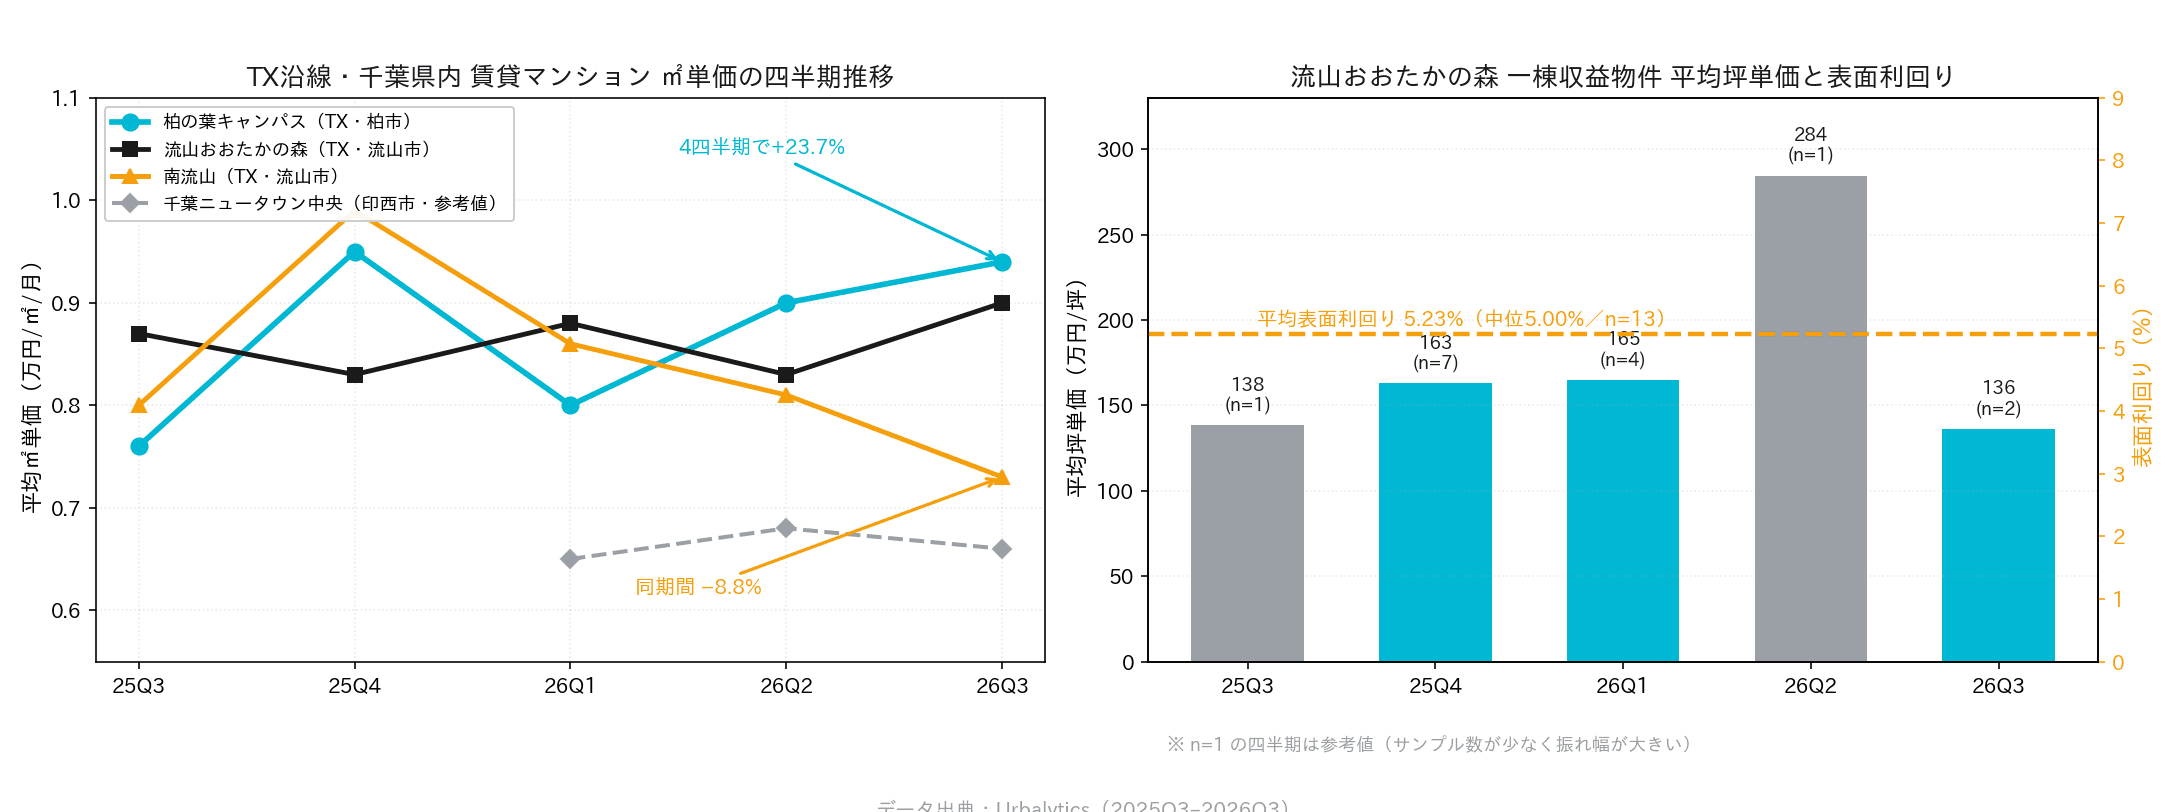
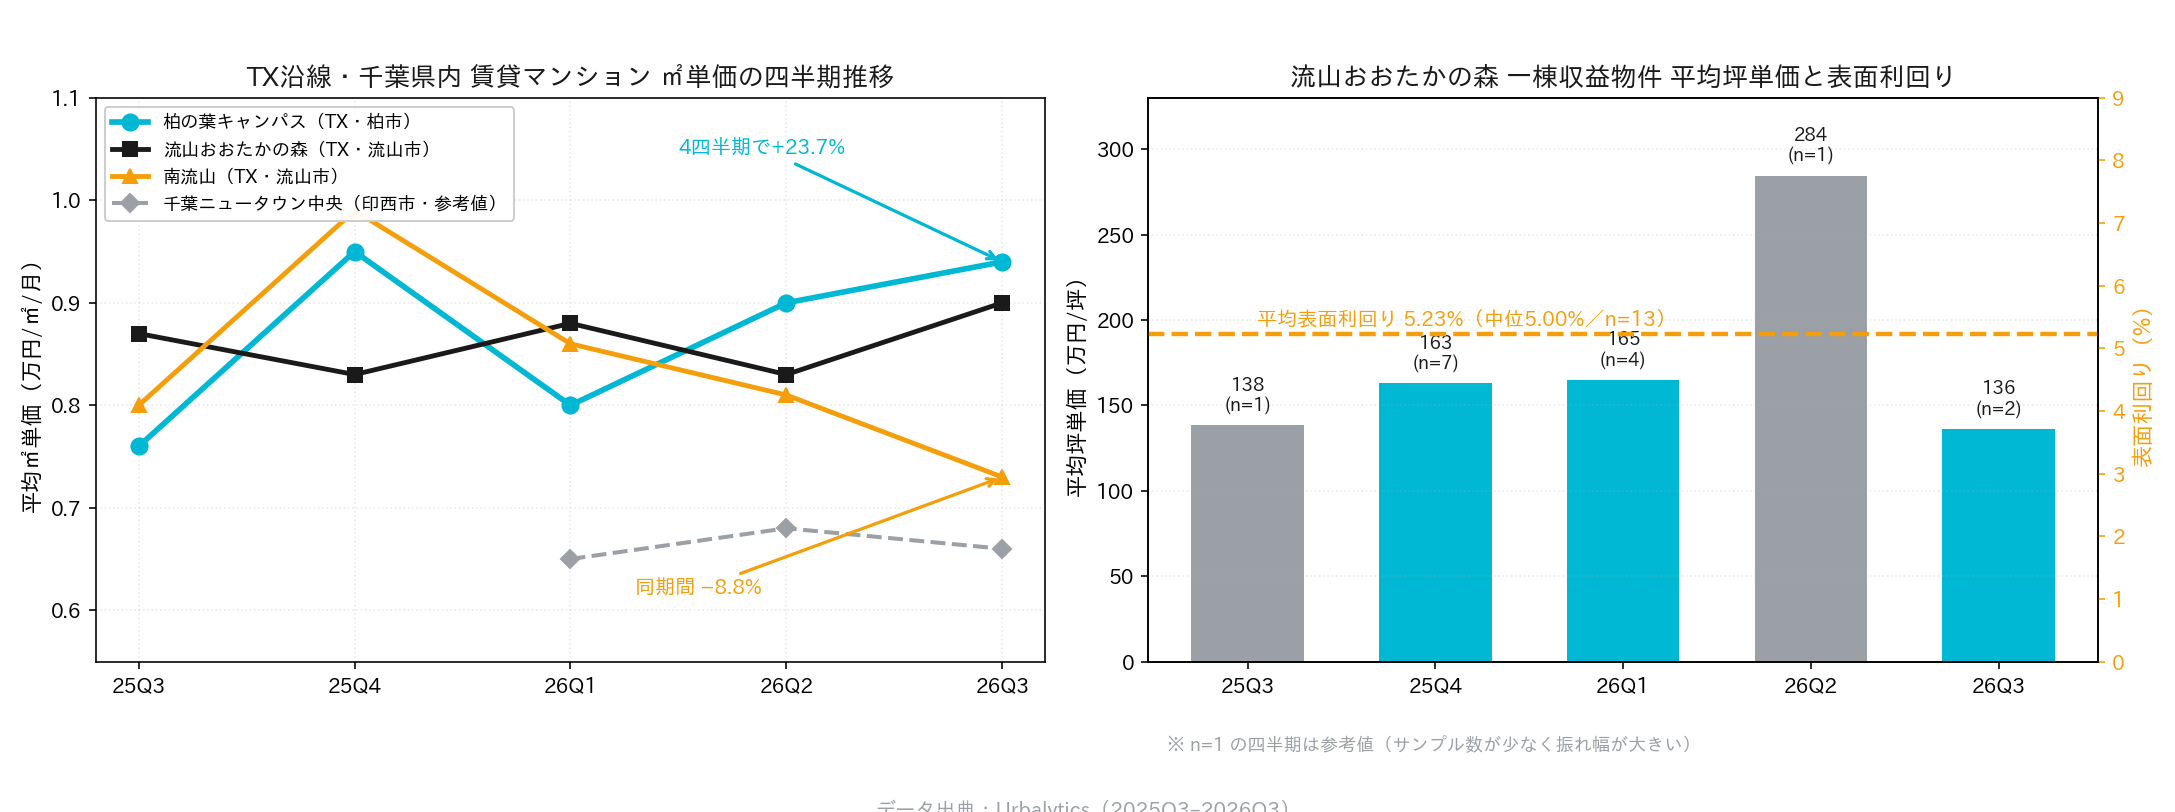
On a monthly rent per square meter basis (JPY 10,000/㎡/month), Kashiwanoha-campus(柏の葉キャンパス)is 0.274 (n=166; average rent ¥142,000 for 52.4㎡), Nagareyama-Otakanomori(流山おおたかの森)is 0.262 (n=172), Minami-Nagareyama is 0.247 (n=315), and Chiba New Town Chuo(千葉ニュータウン中央)in Inzai is 0.204 (n=13; indicative).
More critical is the four-quarter trend. Per-㎡ rents at Kashiwanoha-campus rose a cumulative 23.7%; Nagareyama-Otakanomori inched up 3.5%; while Minami-Nagareyama fell 8.8% over the same period. On the same line—indeed within the same Nagareyama City—two stations’ rents are moving in opposite directions.
Urbalytics Insight Urbalytics’ internal data can see this split because it works at the “station × asset class × quarter” granularity instead of stopping at city averages. The census tells you Nagareyama grew 7.65%, but only station-level rental samples reveal that the increment was absorbed mainly by for-sale condominiums(分譲); the rental side did not benefit in step. For investors valuing rent cash flows, the latter is the true pricing basis.
Pricing of whole-building income properties confirms this. Around Nagareyama-Otakanomori, sample average gross yield(表面利回り)is 5.23%, median 5.00%, with a 2.34%–7.30% range; the average total price is about ¥147.54 million and average annual rent ¥6.98 million. A 5% median in Chiba’s near suburbs is not cheap—signaling that the “population growth story” is already priced in.
Three calibrations for investment decisions
First calibration: treat “population growth” and “rent growth” as two different things. This cycle’s increment is centered on child-rearing owner-occupier households whose first choice is newly built for-sale units, not rentals. Hence, even where the population curve looks great, rental prices may not follow; Minami-Nagareyama is a ready counterexample.
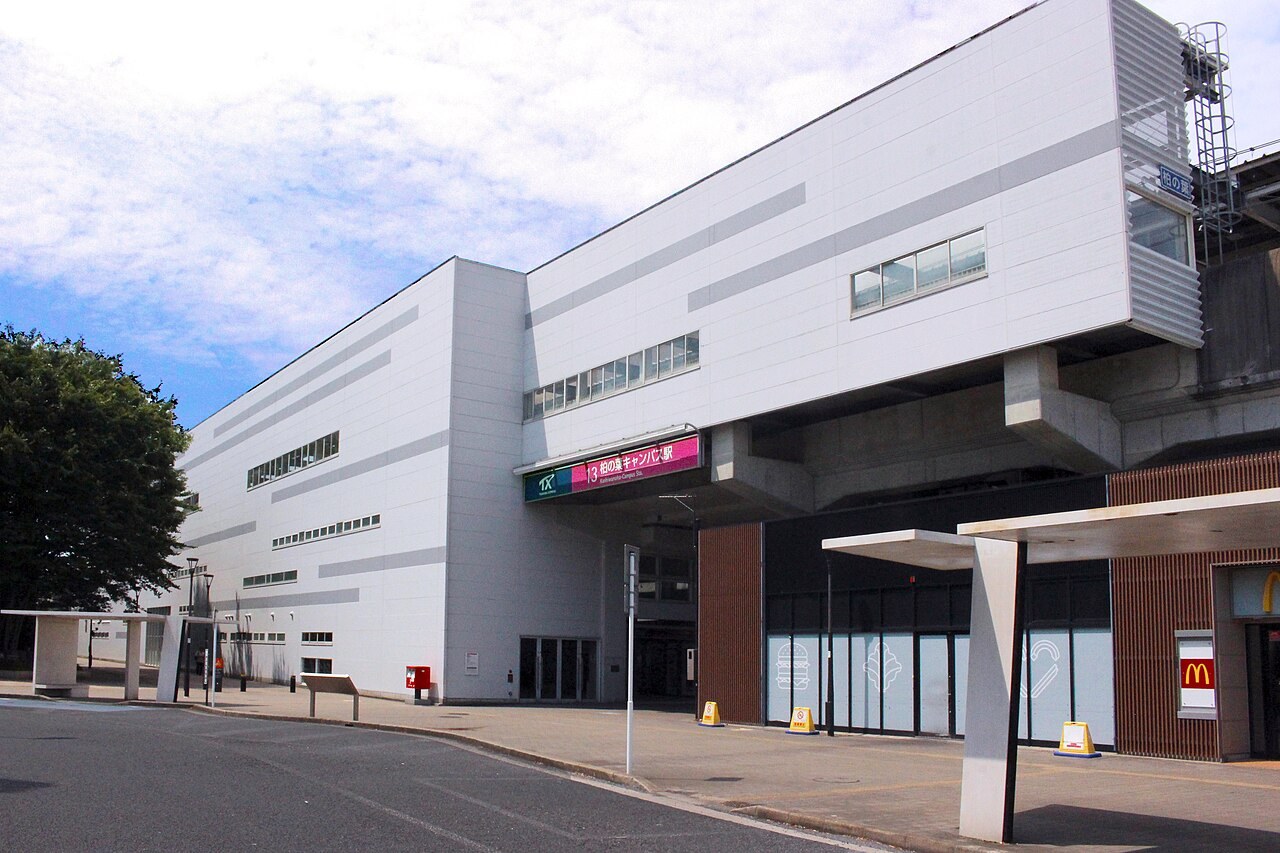
Second calibration: station-level siting precision. Kashiwanoha-campus’s 23.7% rise reflects a mix of universities and research institutes, smart-city projects, and tower-type rental supply, skewing tenant profiles toward higher-income singles and small families; Minami-Nagareyama, though an interchange between TX and JR Musashino Line, has abundant aging stock, and its largest sample size (315) implies the fiercest competition. Along this line, gaps between stations already exceed gaps between cities.
Third calibration: think about exit. A 5% median gross yield, plus the ongoing shift to 8-car trainsets and the Tokyo Station extension concept, suggests that future upside will come more from delivery of infrastructure catalysts than from organic rent growth today.
Risk disclosure Risks along this corridor concentrate in two areas: (1) yields have already been compressed by the “growth narrative,” with low-end samples like 2.34% indicating evident chasing; (2) if the rent–population divergence persists, valuation assumptions will distort—using city-level population growth to forecast rent growth can easily overestimate future cash flows. We recommend using station-level actual rental samples—not city-level population data—as inputs to return models.
Conclusion
The census’s “surface–line–point” map is, at its core, a map of who has reduced mobility friction. The TX corridor is growing against the tide not because it is fast, but because rail, housing, childcare services, and industry truly mesh at a few stations.
For investors, the right use of this map is not to buy whatever tops the growth table, but to push granularity further down—to the station, the asset class, and the quarter. When the population and rent curves part ways, only the latter offers true pricing. To test whether a station’s rents and yields have already priced in growth expectations, pull that station’s rental samples and whole-building yield distribution side by side on Urbalytics.
#JapanRealEstate #TXCorridor #TsukubaExpress #Nagareyama #Inzai #KashiwanohaCampus #MinamiNagareyama #ChibaInvestment #2025NationalCensus #PopulationDynamics #GrossYield(表面利回り) #RentMarket #WholeBuildingIncomeProperties #GreaterTokyoSuburbs #Urbalytics
References
- Merkmal (via Yahoo! News), “Why are populations growing along the Tsukuba Express corridor? In a Japan that declined by 3.10 million people, conditions for ‘cities that attract people’ seen in Tsukuba, Nagareyama, and Inzai”, 2026, https://news.yahoo.co.jp/articles/faed91e3c1bc13bb3f03c8b4f14dd77bb2829e38
- Statistics Bureau, Ministry of Internal Affairs and Communications, “2025 National Census Preliminary Tabulation”, 2026, https://www.stat.go.jp/data/kokusei/2025/
- Giken Shoji International, “2025 Census Preliminary: Population Increase/Decrease Analysis”, 2026, https://www.giken.co.jp/
- Metropolitan Intercity Railway Company(Tsukuba Express), Transport Results / 8-car Train Formation Project, 2026, https://www.mir.co.jp/
- City of Nagareyama, Pick-up/Drop-off Childcare Station Program, 2026, https://www.city.nagareyama.chiba.jp/
- City of Inzai, Corporate Location / Data Center Cluster, 2026, https://www.city.inzai.lg.jp/
- Urbalytics, Rent Statistics(rent_stats)/Whole-building Gross Yield Statistics(building_cap_rate_stats), 2026, https://www.urbalytics.jp/