Words: 1596 | Estimated Reading Time: 8 minutes | Views: 22
Sumitomo Realty & Development is holding the line on primary-market pricing, but four resale listings in the same building have already been discounted, with the largest cut at 13.2%.
One Building, Two Price Regimes
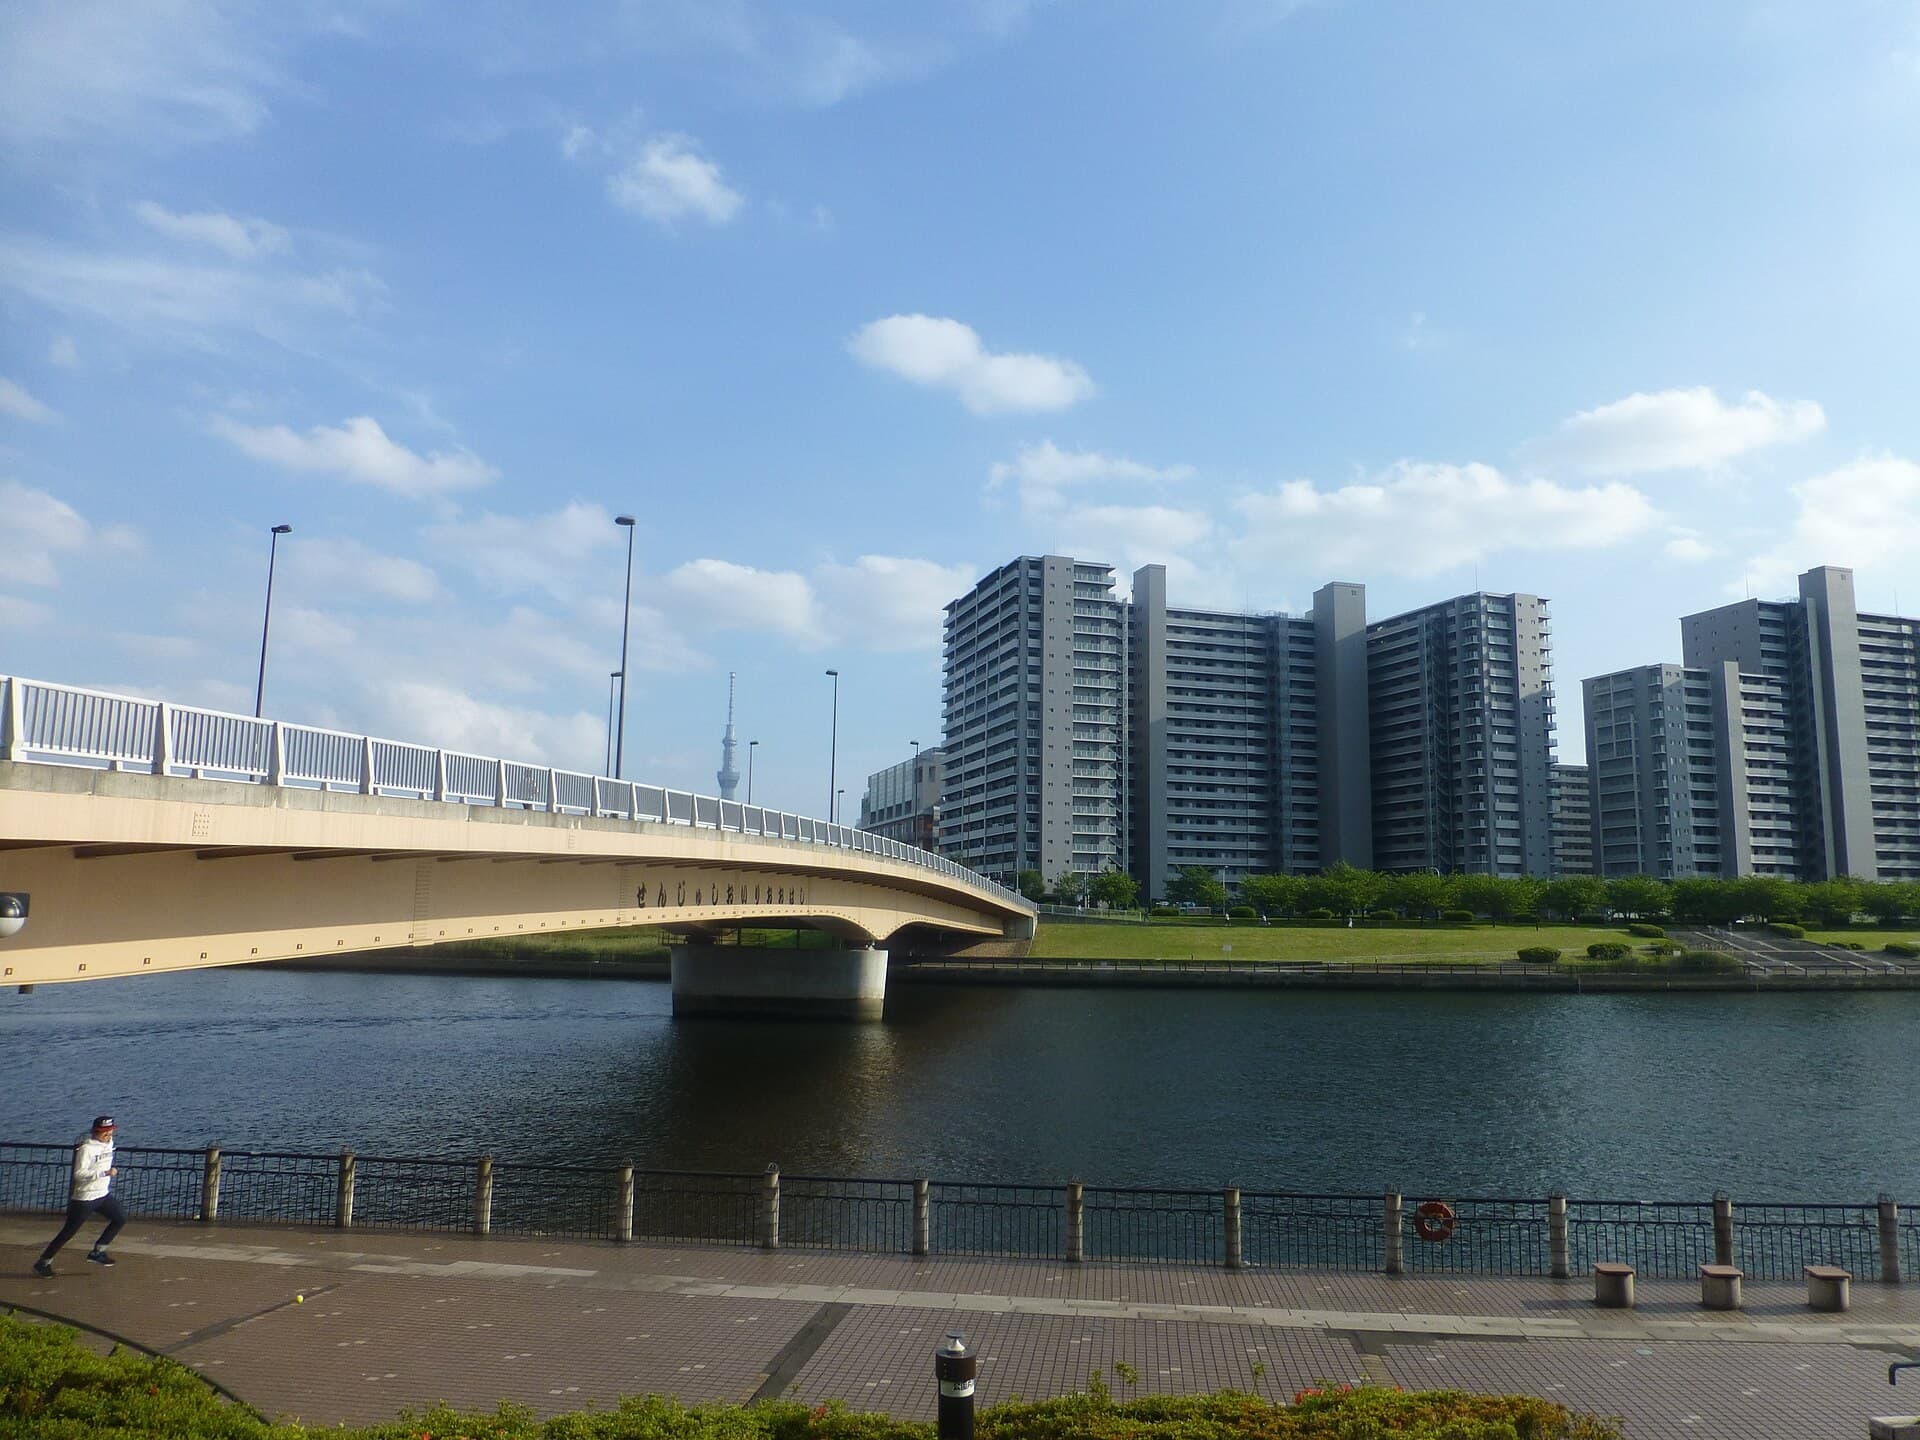
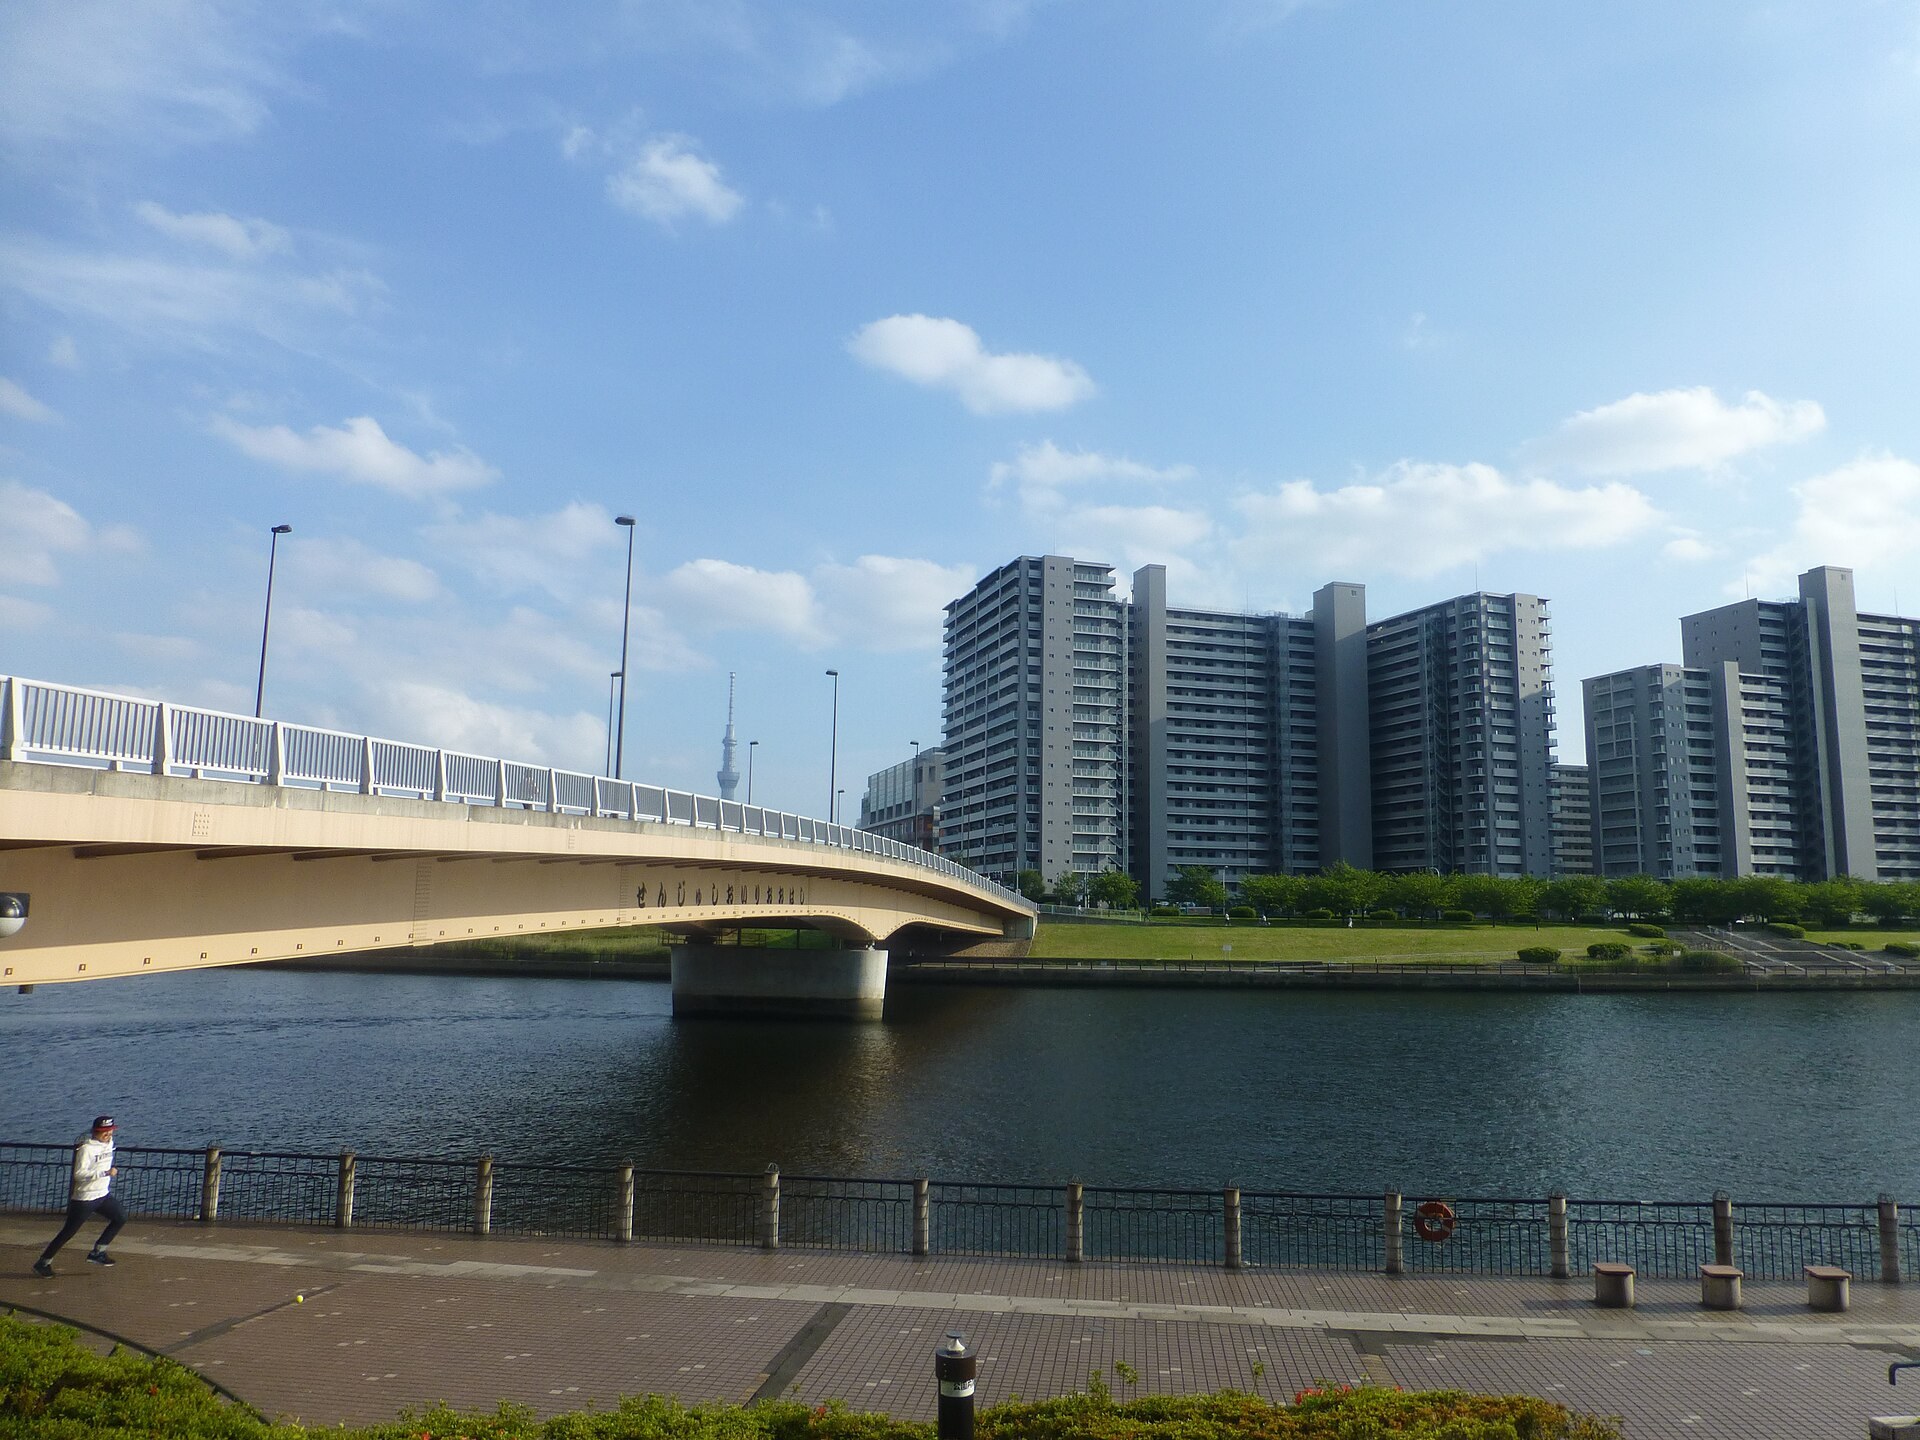
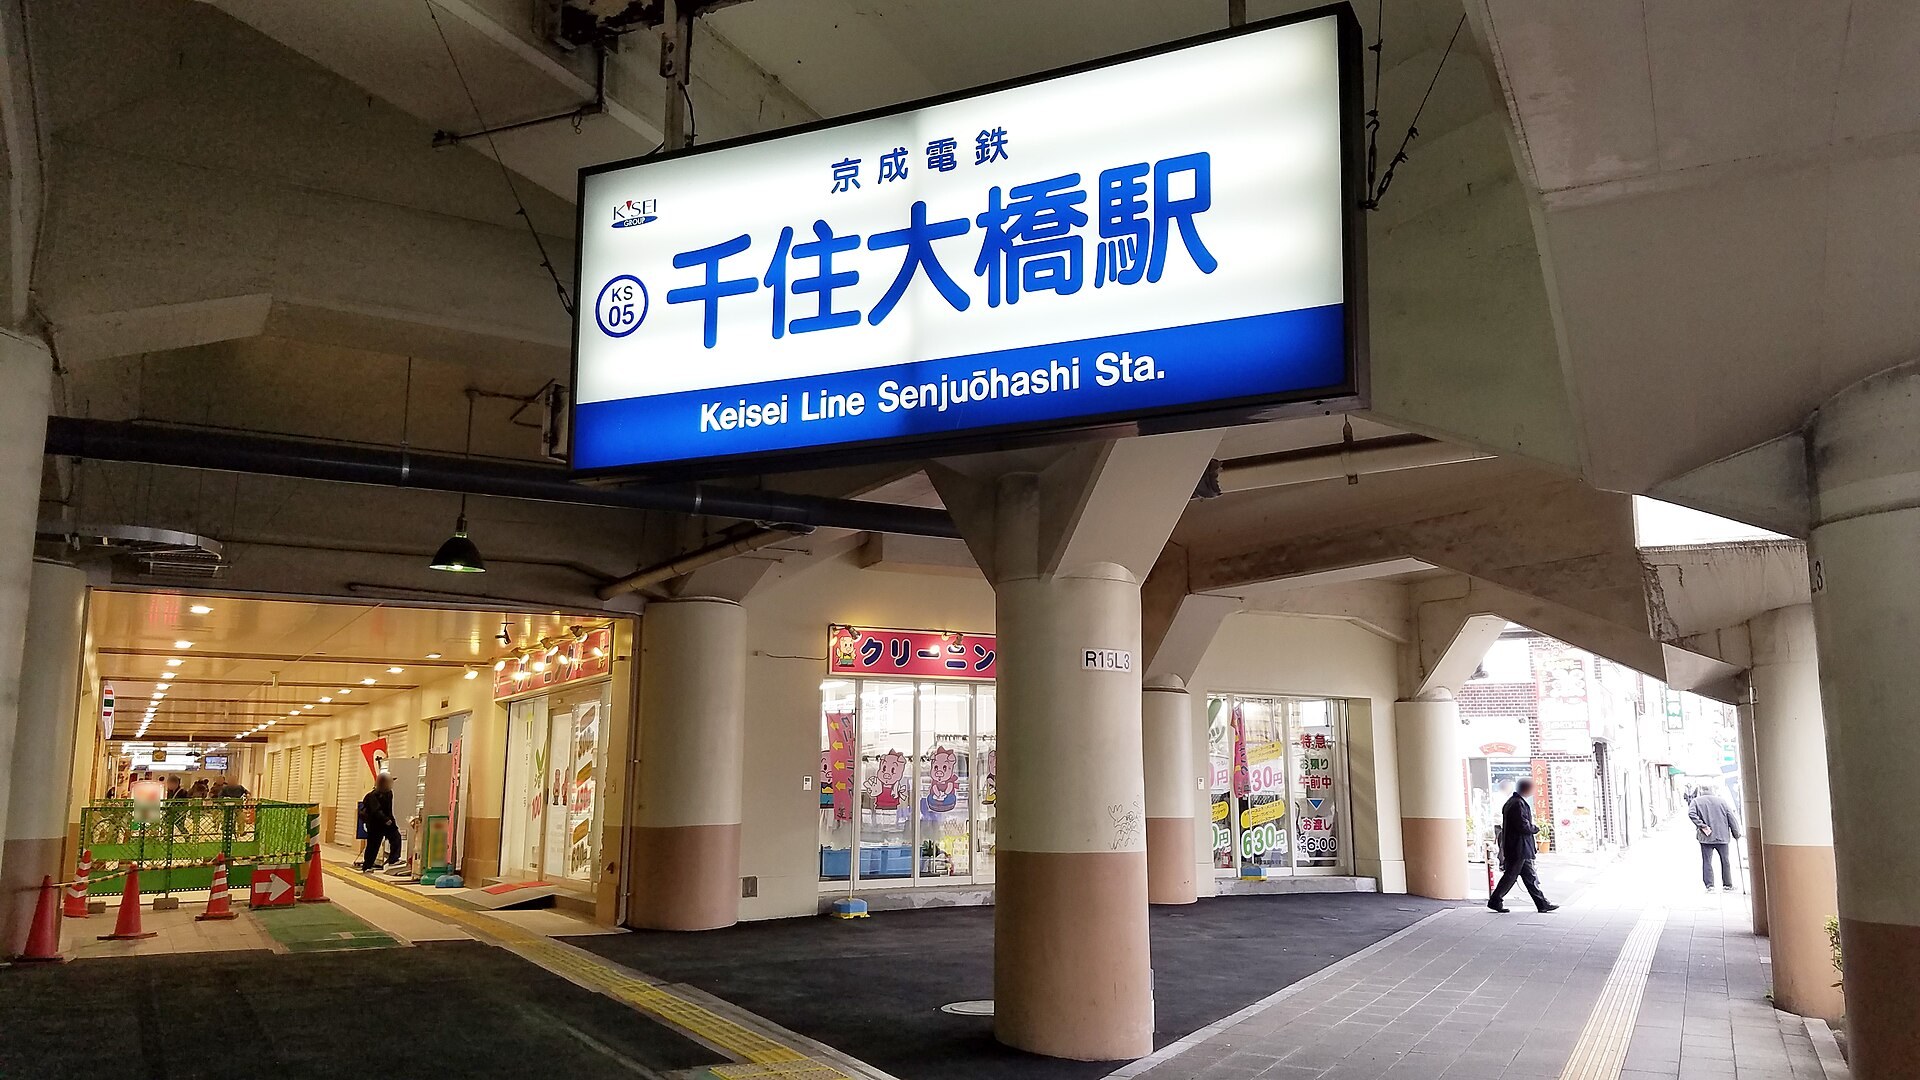
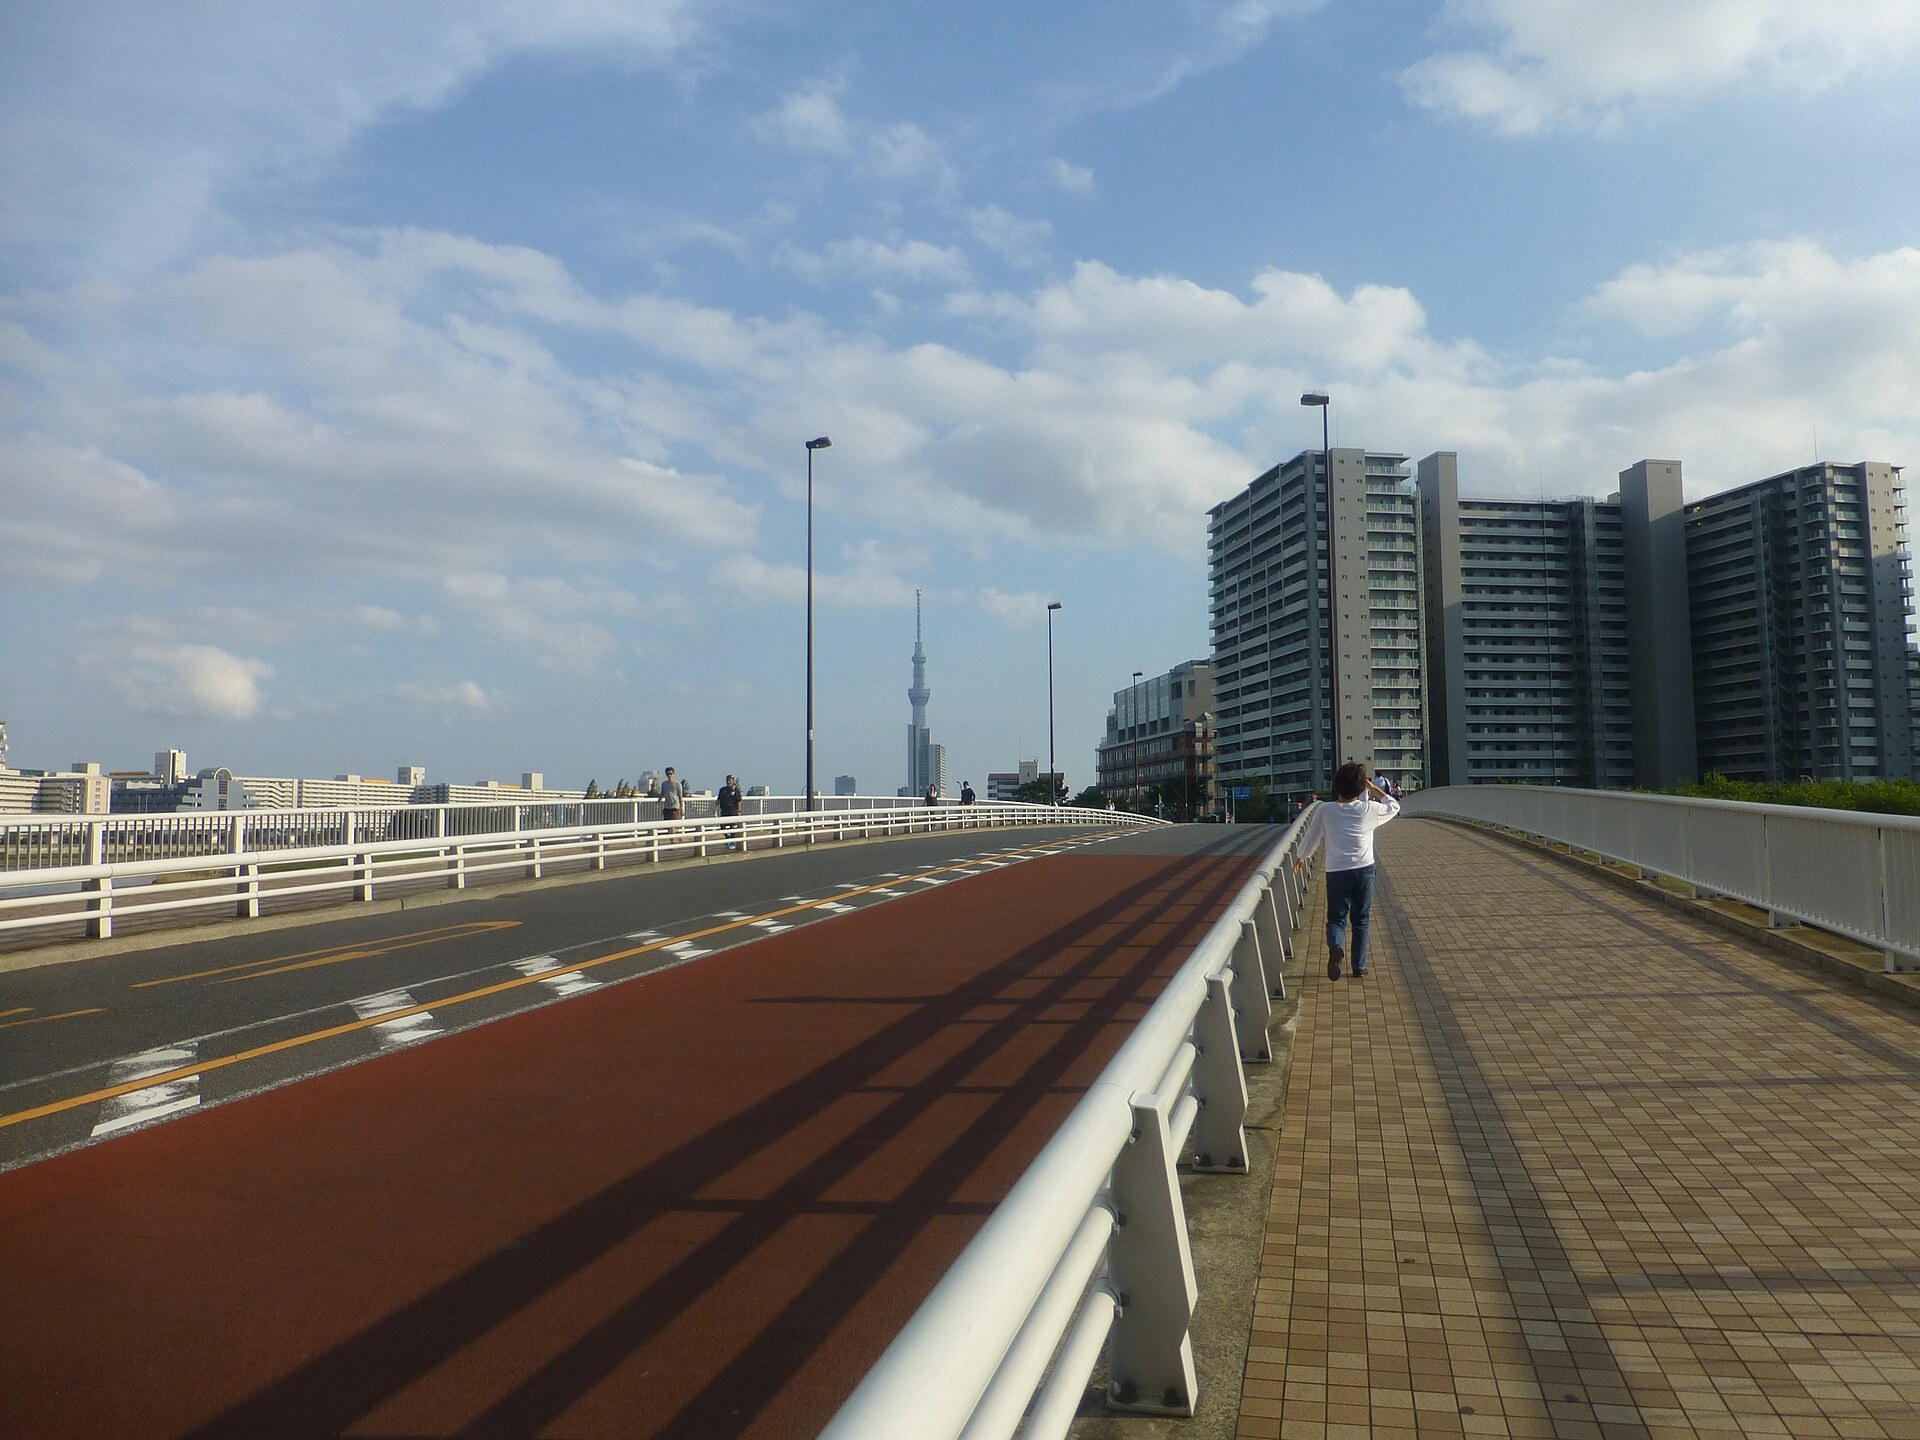
From Nippori Station in Tokyo, take the Keisei Main Line north; as you cross the Sumida River, a 42-story tower appears on the right against the Skytree backdrop. This is the tallest building in Adachi Ward, Sumitomo Realty & Development’s “City Tower Senju-Ohashi (シティタワー千住大橋),” a 5-minute walk from Senju-Ohashi Station.
The site itself is interesting. The Senju-Ohashi bridge over the Sumida River is where Matsuo Bashō set off on ‘The Narrow Road to the Deep North’—a waypoint that signifies “departure” in Japanese literature, now woven into the tower’s sales narrative.
Toyokeizai’s on-site report on August 21 provides the basics: 462 units in total, typical sizes 55–75 m², asking prices JPY 89 million to JPY 132 million. On a per-tsubo basis, primary-market pricing works out to roughly JPY 5.35–5.82 million.
More telling is the last point: the building was completed in May 2025, yet many units, including the 42nd floor, still haven’t been released. Sumitomo says it is monitoring market conditions. In other words, finished product is being held as inventory rather than rushed to monetize—the tactical foundation of “no discounts.”
The Secondary-Market Reality: Seven Listings, Four Price Cuts
Primary-market discipline cannot mask secondary-market selling pressure. Using Urbalytics’ search_mansion_activity to pull the past six months of resale listings for this building (source: REINS), we see clear cracks in the “no discounts” narrative.
Over six months there were 7 resale listings, of which 4 were reduced. The most extreme was a 65.25 m², 29th-floor 3LDK: listed at JPY 123.0 million on March 30, then cut to 114.8 million and 109.8 million, and down to 106.8 million on August 1—an aggregate reduction of JPY 16.2 million, or 13.2%.
The other three reductions were milder but pointed the same way: 140.0 million to 134.8 million (−3.7%), 119.8 million to 114.8 million (−4.2%), and 107.0 million to 104.9 million (−2.0%). Notably, the last one is flagged in the data as “KEIBAI_SUMITOMO,” i.e., via Sumitomo’s own sales channel.
On a per-tsubo basis, the seven listings span JPY 5.13–7.21 million. Versus the primary market’s JPY 5.35–5.82 million, the secondary-market floor has already undercut the new-build low by roughly 4%, while the top end is 24% above the new-build high—price dispersion so wide it reads like two different markets within one tower.
Urbalytics Insight This is where Urbalytics’ internal data adds value: media can report the developer’s line, but not the unit-by-unit price-change trails. REINS-level priceChanges carry dates and statuses (on market / under offer), allowing you to reconstruct “which unit, when, by whom, and by how much.” The primary-market list price is a point; secondary-market selling pressure is a curve—focusing only on the former systematically understates holding costs.
Rents vs. Pricing: 20% Brand Premium, Yields About Half of Whole-Building Deals
Whether pricing holds ultimately depends on rent. The tower currently has one rental listing: a 75.68 m², 17th-floor 3LDK at a monthly rent of JPY 369,000, with two months’ key money and one month’s deposit—equivalent to JPY 16,100 per tsubo per month.
Where does that sit in the area? Urbalytics’ rent_stats show 138 rental apartment samples in the Senju-Ohashi station area, with average monthly rent of JPY 124,400 and average size of 32.29 m²—about JPY 13,200 per tsubo. In other words, the tower commands roughly a 20% rent-per-tsubo premium over the area average—its brand/tower premium is real.
Area rents themselves are rising. Quarterly, rent per tsubo went from JPY 12,500 in 2026 Q1 to 13,100 in Q2 and 13,400 in Q3, up 7.2% cumulatively. Note that Q1 had only seven samples and should be treated as directional; Q2 and Q3 had 79 and 50 samples respectively, making the trend credible.
The issue is on the yield side. At JPY 369,000 per month, annual rent is about JPY 4.428 million:
First, buying at a comparable scale listing of JPY 165.0 million implies a gross yield of 2.68%—a level that leaves little room for financing arbitrage.
Second, buying at the reduced JPY 134.8 million lifts gross yield to 3.28%; scaled to the JPY 114.8 million unit (by area), it only reaches 3.67%.
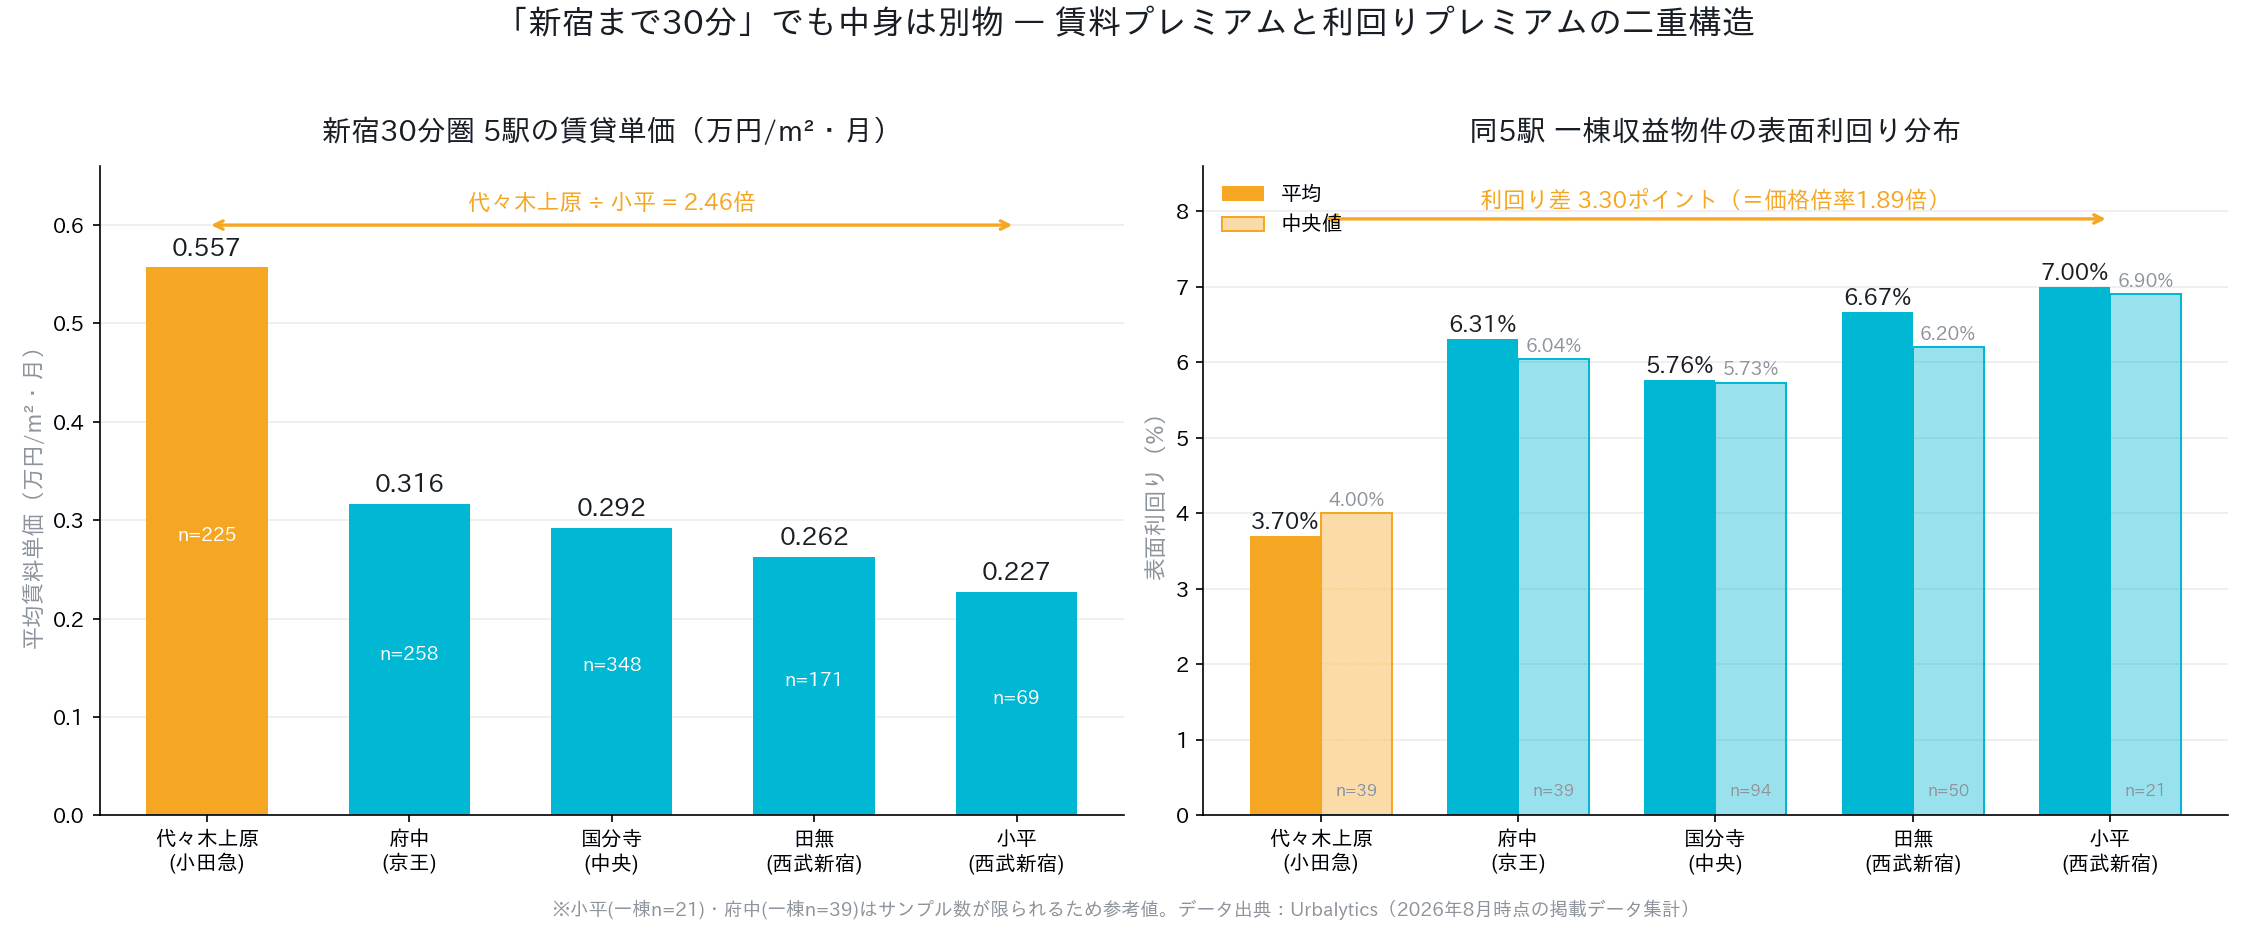
What about whole-building income assets in the same station area? building_cap_rate_stats across 39 samples shows an average gross yield of 5.62%, a median of 5.76%, and a high of 7.99%. Between tower units and whole buildings lies a 2–3 percentage point yield gap.
Three Curves in the Urbalytics Data
The chart below juxtaposes three series: the area’s rising rent-per-tsubo, the jump in per-tsubo pricing for whole-building assets, and the price-cut trajectory of resale listings in this tower.
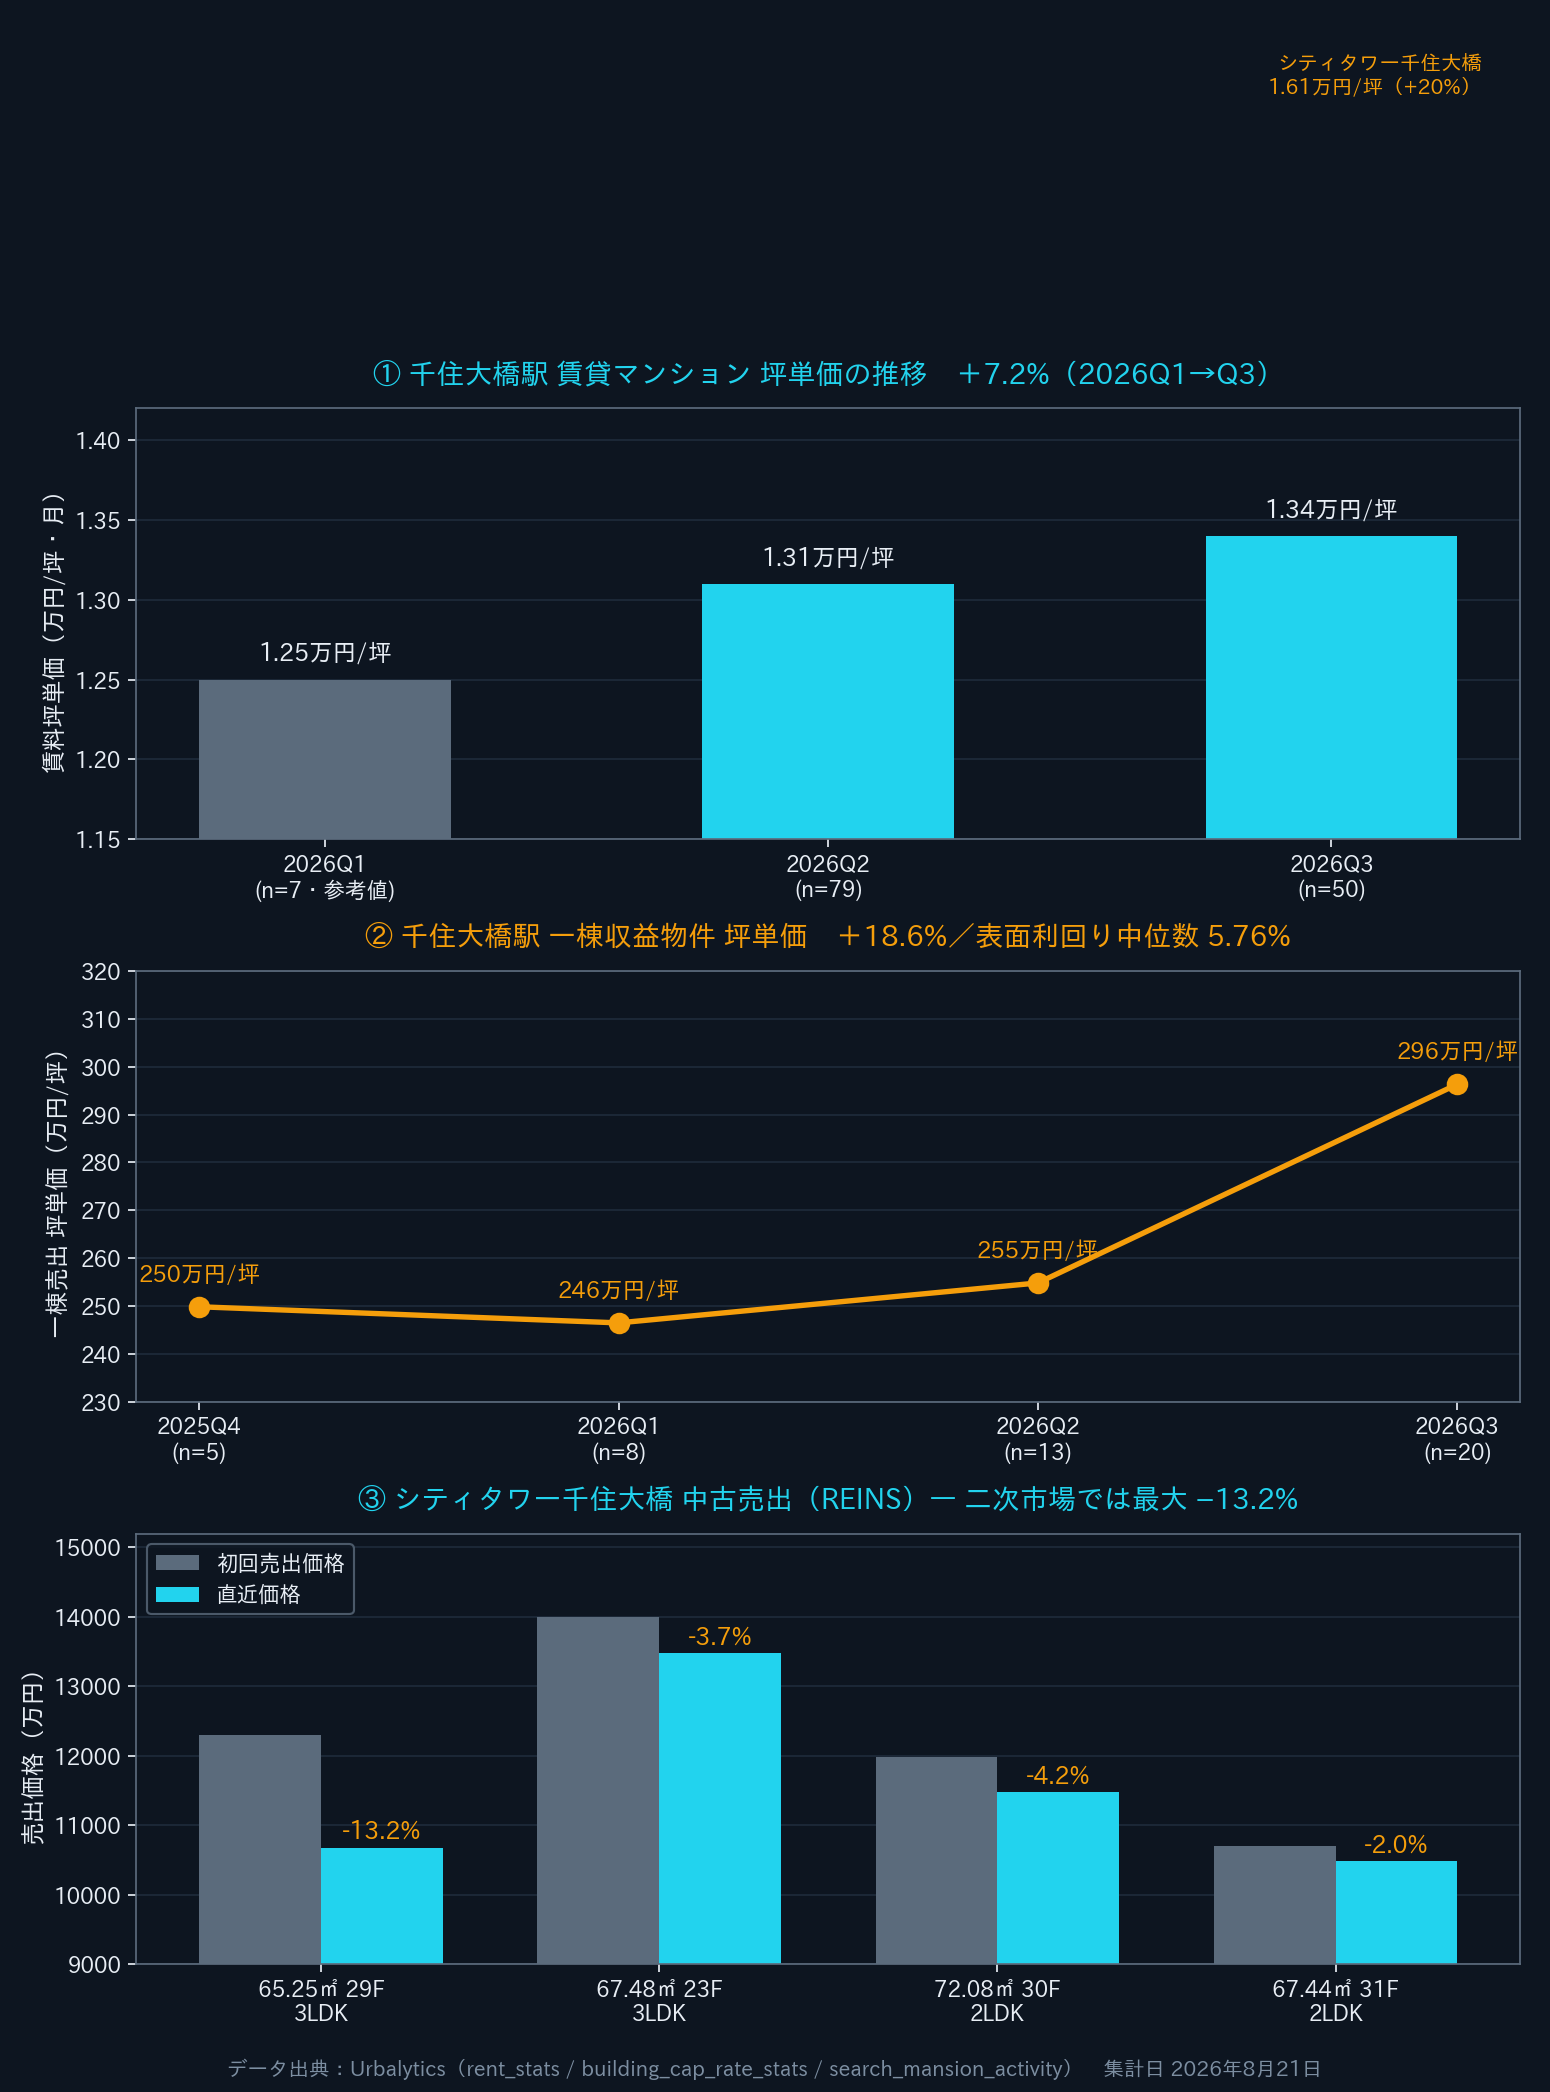
The whole-building line is especially notable. Per tsubo, prices rose from JPY 2.4983 million in 2025 Q4 to 2.9632 million in 2026 Q3, up 18.6%, while samples increased from five to twenty—prices are rising even as supply expands, suggesting buyers can absorb inventory at these levels. The area’s average closing price is around JPY 192 million, with annual rent of roughly JPY 9.49 million.
Viewed together, the logic is clear: area rental fundamentals are improving; whole-building assets are being repriced; and high unit-price tower condos are being squeezed. Within a single station area, different asset classes are diverging.
Mitsui’s Different Path: Kashiwanoha as a District-Scale Play
On the same day, Toyokeizai published a report on Mitsui Fudosan that offers a useful contrast.
In Kashiwa City, Chiba Prefecture, the Kashiwa Golf Club (opened 1961) closed in 2001 for the Tsukuba Express (TX) project. The site became “Kashiwanoha Smart City,” with a development area of about 2.73 million m²—roughly 63 Tokyo Domes. Mitsui, together with Chiba Prefecture, the University of Tokyo, and Chiba University, has been city-building from scratch.
It’s about 30 minutes from Akihabara to Kashiwanoha-campus Station. A 43-story base-isolated tower, “Park Tower Kashiwanoha Campus,” is under construction for July 2027 completion, and the first 224 units sold out on day one. With nearby retail, dining streets, a hospital, and an international school, daily life and child-rearing can be contained within the district.
The timeline matters. When Ichibangai was completed in 2008, LaLaport was the only large retail at the station. The district gained depth after Gate Square opened in 2014. In other words, Mitsui spent sixteen years to make the “surface” real—the premium stems from accumulated neighborhood maturity, not the specs of a single building.
The strategic split is clear: Sumitomo plays a station-core “point” game—high-spec single towers, firm inventory hold, no discounts; Mitsui plays a suburban “area” game—build the district first, then let homes appreciate with it. Toyokeizai’s same-day “exclusive” uses Tokyo Kantei data to map the past-decade supply footprints of seven major developers—the geographic patterning reflects these two approaches.
Three Takeaways for Cross-Border Investors
Back to investment decisions. The real value here is not “should you buy Senju-Ohashi,” but the methodology it reveals: a developer’s pricing discipline is not your exit price.
First, the primary-market list price is not your valuation anchor. In the same building, the secondary-market per-tsubo floor is 4% below the new-build floor. Comforting yourself with “the developer won’t cut” at purchase, you will face the REINS price-cut curve at sale.
Second, tower condos and whole-building assets are different businesses. 2.7%–3.7% versus 5.76%—if your cost of capital is above 2%, tower-condo cash flows have almost no cushion; returns must come from capital gains, which are precisely the least controllable.
Third, the rental side is the only relatively certain piece in this case. Area rent per tsubo rose 7.2% over three quarters, and the tower itself commands a 20% brand premium—if your thesis is rent-driven rather than resale-driven, your decision framework is far more robust.
Risk Disclosure Two layers of risk to highlight. First is financing: Kenbiya reports that with rising rates and elevated entry prices, more individual landlords are facing “negative equity (zan-sai ware)”—list prices below outstanding loan balances, effectively sealing the exit; Toyokeizai likewise notes 40- and 50-year mortgages are spreading, with banks shifting screening from income multiples to repayment ratios. Second is data scope: the resale data cited here are asking, not closing prices; actual trades typically clear lower, so the yield illustrations above should be treated as an upper bound, not the midpoint.
Divergences like “primary-market narrative vs. secondary-market trajectory” are invisible in single news hits. Urbalytics puts REINS unit-level price changes, area rent statistics, and whole-building yield distributions on one screen so investors can, before they commit, see the curve they will eventually face.
#TokyoRealEstate #AdachiWard #SenjuOhashi #SumitomoRealty #MitsuiFudosan #TowerCondoInvestment #KashiwanohaSmartCity #ResaleCondo #GrossYield #WholeBuildingIncomeProperty #REINS #NegativeEquity #GreaterTokyoInvestment #CrossBorderRealEstate #Urbalytics
References
- Toyokeizai Online, 2026, “Completed properties are ‘assets’—the winning pattern of Sumitomo Realty’s no-discount sales strategy as seen in City Tower Senju-Ohashi,” https://toyokeizai.net/articles/-/955320?display=b
- Toyokeizai Online, 2026, “Mitsui Fudosan’s city-building and ‘condominiums that improve with age’… how it keeps winning large-scale projects,” https://toyokeizai.net/articles/-/955389?display=b
- Toyokeizai Online, 2026, “[Exclusive] Where the seven major condo developers have built over the past ten years—their ‘power map’ unveiled,” https://toyokeizai.net/articles/-/955390?display=b
- Kenbiya, 2026, “‘Want to sell but can’t’ landlords on the rise? The quiet crisis of ‘negative equity’ amid rising rates and soaring property prices,” https://www.kenbiya.com/ar/ns/jiji/purchase_know_how/10439.html
- Yomiuri Shimbun, 2026, “Kansai’s new-build condos up 3.1% to an average JPY 60.96 million—high-priced towers are pushing prices higher,” https://www.yomiuri.co.jp/local/kansai/news/20260821-GYO1T00001/
- Urbalytics platform data (rent_stats / building_cap_rate_stats / search_mansion_activity), aggregated August 21, 2026, https://www.urbalytics.jp