Words: 1531 | Estimated Reading Time: 8 minutes | Views: 41
Even as Tokyo rents hit fresh record highs, the gains are not distributed automatically.In practice, only the 56.7% of landlords who proactively raised rents captured them; the rest merely watched the numbers rise.
In last week’s release of average rents for rental apartments in Tokyo’s 23 wards, units for singles reached the ¥114,000 range, setting a new all-time high for the 25th consecutive month. Two-person units for couples also rose for the 13th straight month. At first glance, these look like good numbers for every landlord.
But another survey released the same week added a very different footnote. According to a survey of 1,000 whole-building rental owners in Tokyo and the three surrounding prefectures by Teikoku Real Estate(帝国不動産), only 56.7% actually raised rents over the past two years. In other words, just over four in ten landlords have not added a single yen of income in this historic market phase. A rising market does not automatically lift your cash flow.
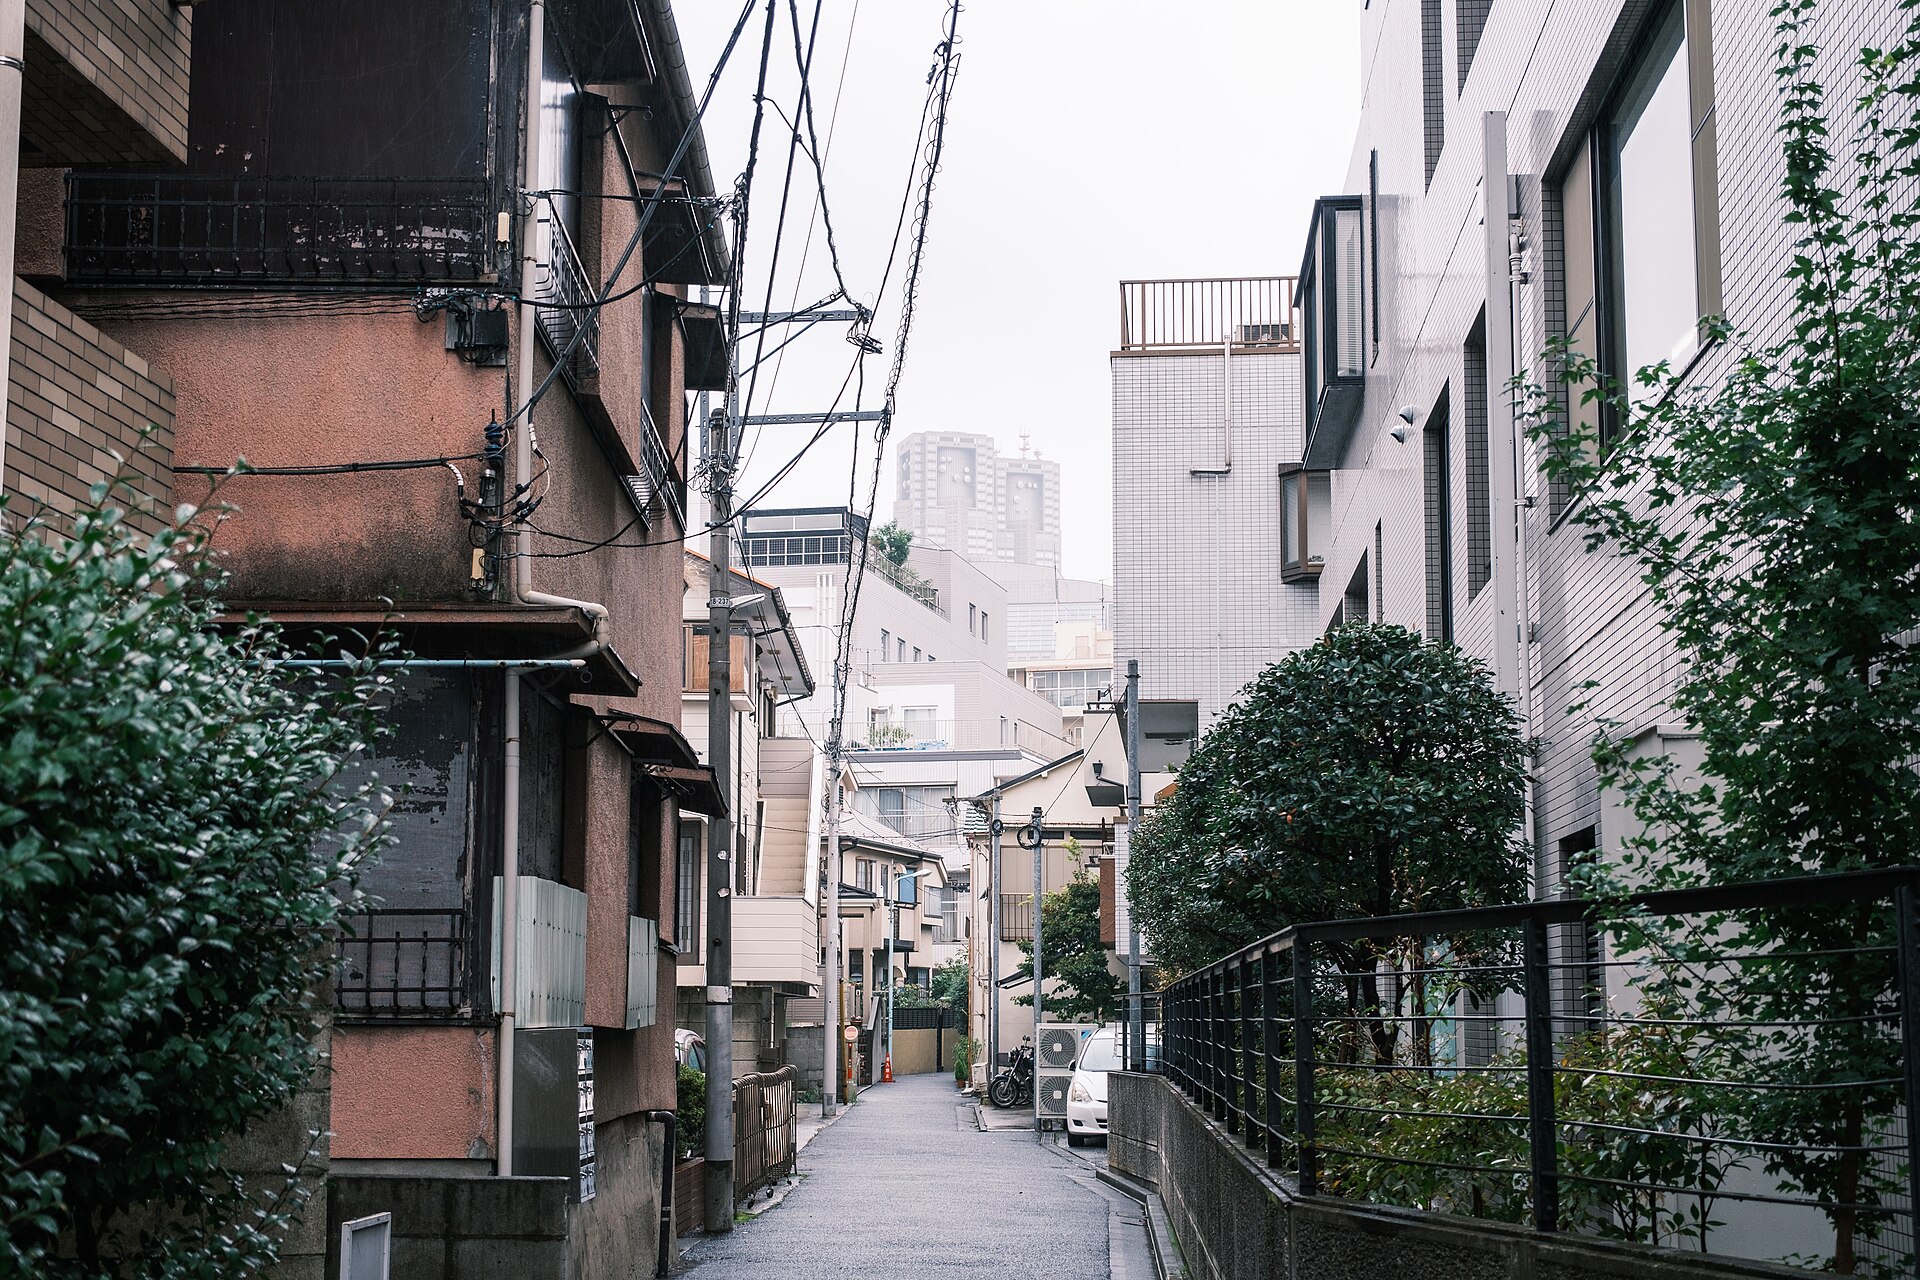
Behind record rents, an izakaya forced to close
TBS footage shows both ends of this rent-hike phase. A couple in their 20s searched for a place to live together, but even with a ¥120,000 budget including building fees they couldn’t find a unit that fit their criteria and ultimately had to raise their budget by ¥20,000.
Mr. Doi, president of brokerage AINS HOME, offered a more intuitive comparison: a 1LDK that used to be rentable around ¥100,000 is now more readily found in the ¥110,000–¥120,000 range. This isn’t a mirage—higher construction costs embedded in new-build pricing have flowed through to end rents.
The spillover isn’t limited to housing. The izakaya Cheke(ちぇけ), which carries over 600 types of alcohol, operates on the 1st and 3rd floors of the same building, with the 1st floor a cheaper standing-bar format. At renewal, the landlord sent notice of a rent increase of more than ¥50,000 for the 1st floor.
With food and utility costs also rising, the owner, 豊田千木良, closed the 1st floor on 7月31日 and kept only the 3rd floor. Commercial tenants’ ability to pay is becoming the first string to snap in this rent-hike phase—investors operating mixed-use, whole-building assets should watch this closely.
56.7% is the real dividing line among landlords
The value of the Teikoku Real Estate(帝国不動産) survey lies not in the self-evident “rents are rising,” but in segmenting landlords by action. Of the 1,000 surveyed, 56.7% implemented rent hikes over the past two years. In the five central wards (Chiyoda, Chuo, Minato, Shibuya, Shinjuku), that ratio jumps to 73.2%.
More important is the magnitude. In the five central wards, 23.2% of landlords implemented rent hikes of over 10%, the highest among all areas. At the same time, these two Tokyo areas recorded the lowest share answering “we leave everything to the management company”—3.6% in the five central wards and 4.5% in the rest of the 23 wards.
Outcomes follow behavior almost mechanically. Among the 563 effective samples that raised rents, 32.1% reported earnings “improved” over the past two years, while 18.1% reported “deteriorated.” Among the 40 “unknown/all left to the management company” effective samples, only 7.5% reported “improved,” and 25.0% reported “deteriorated.”
Urbalytics Insight: Internal rental data corroborate this divide from a pricing angle. As of 2026年8月6日, the median unit rent for rental apartments around Shibuya Station is ¥5,903 per m² (n=422), Shinjuku ¥5,504 (n=116), Ikebukuro ¥4,519 (n=500), Yokohama ¥3,973 (n=368), and Omiya ¥2,857 (n=500). The unit-price slope almost perfectly matches the ranking of rent-hike rates—the higher the unit price, the stronger the landlord’s pricing power.
Two datasets, the same ranking
Median unit rent near major stations (yen/m²/month): 5,903 Shibuya 5,504 Shinjuku 4,519 Ikebukuro 3,973 Yokohama 2,857 Omiya (Saitama). Source: Urbalytics rent_stats (MANSION・2026年8月6日取得) Share of landlords who raised rents in the past two years (%): overall 56.7% 73.2% five central wards 62.2% Tokyo Tama 54.7% Chiba Prefecture 54.5% rest of the 23 wards 47.5% Kanagawa Prefecture 44.6% Saitama Prefecture. Source: Teikoku Real Estate(帝国不動産) “Survey on actual management of whole-building rental owners” (2026年7月・Tokyo and the three surrounding prefectures n=1,000)
Location sets the ceiling on pricing power
Layering the two datasets makes the logic of spatial differentiation clear. The rent-hike rate declines from 73.2% in the five central wards to 62.2% in Tokyo’s Tama area, 54.7% in Chiba Prefecture, 54.5% in the 23 wards (excluding the five central wards), 47.5% in Kanagawa Prefecture, and bottoms at 44.6% in Saitama Prefecture.
Against Urbalytics’ median unit rents, Shibuya is 2.07 times Omiya. This multiple means more than just “expensive.” In the five central wards, even if a landlord proposes a 10% rent hike, the switching cost to a unit with comparable commuting conditions remains high. In Saitama, moving just two stations farther out can uncover much cheaper substitutes.
This is why Saitama and Kanagawa post rent-hike rates below 50%. Pricing power is not a product of negotiating skill but a function of locational scarcity. For cross-border investors, this conclusion is more actionable than “Tokyo rents are rising.” The locations worth paying a premium for are commutable zones where, even after a rent hike, tenants are less likely to slip into the substitute trap.
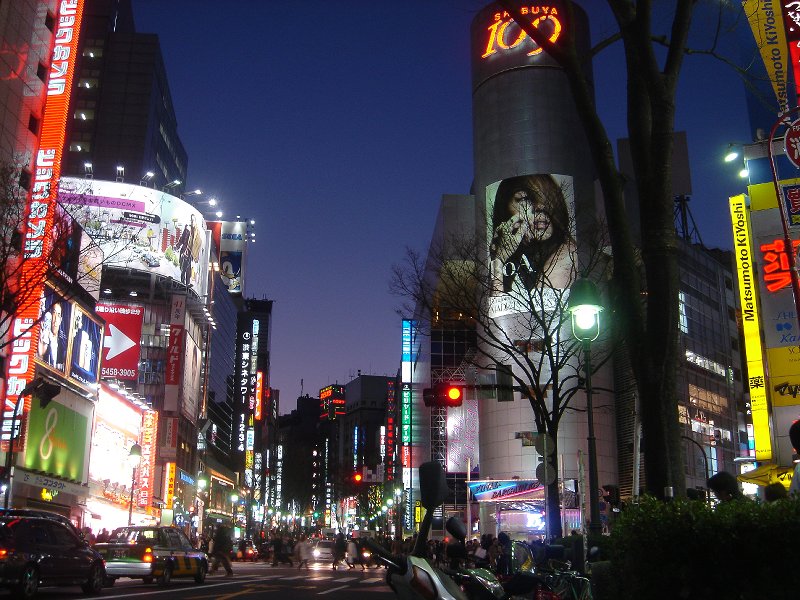
What stands in the way of rent hikes is, in fact, the lease contract
Why did just over 40% of landlords sit out despite recognizing market gains? The primary constraint is contracts, not the market. 35.8% selected “Under ordinary leases, it is hard to broach a rent increase at renewal,” and 30.0% answered “We fear move-outs and can’t pull the trigger.”
Japan’s ordinary lease regime is institutionally tilted toward tenants. Unless the tenant agrees, asserting a rent increase at renewal rarely succeeds, and mediation or litigation often consume more time and money than the hike is worth. By contrast, fixed-term leases do not auto-renew at expiry, allowing landlords to re-lease at the prevailing market.
The survey’s awareness gap is also telling. While awareness of fixed-term leases reaches 76.4%, intent to adopt is only 58.7%. The gap stems from a concern—39.0% of landlords believe rents “fall” when offered as fixed-term leases, whereas only 8.8% think they are “easier to raise.”
However, the data do not fully support this concern.
First, in Teikoku Real Estate(帝国不動産)’s operating track record, the achieved rent-to-target for renewable fixed-term leases is 103.1%. In other words, with proper compliance design, fixed-term leases are not necessarily a discount factor.
Second, awareness and intent to adopt are strongly correlated—among those who “understand very well,” adoption intent is 78.3%; among those who “do not understand,” it is just 9.2%. This suggests resistance arises from information gaps rather than the economics of the system.
Risk note: Cross-border investors seeking to apply this approach as-is should first model two points. Compliance requirements for fixed-term leases are far higher than for ordinary leases. Procedural defects around written disclosures or notarization can lead to the lease being deemed ordinary—lots of work for little gain. Also, incorporate vacancy risk from rent hikes into your cash-flow model. Especially in areas with abundant substitutes such as Saitama and Kanagawa, a failed rent hike can wipe out 2–3 months’ rent.
The next 12 months: rent hikes will stratify, not lift all boats
From a driver perspective, today’s rent growth reflects constrained new supply due to elevated construction costs layered on top of growth in single and two-person households in the core. Neither variable shows signs of reversing over the next year, so the rent index is highly likely to keep rising.
However, even if the index rises, not all owners will benefit. The survey shows that over the next three years, about 40% of landlords plan ongoing repairs/renovations (26.1%), consider redevelopment (8.9%), or make additional acquisitions (4.6%)—this cohort will further widen the gap with passive holders.
The investment takeaway is clear. In buying a whole-building rental in Tokyo, the fact that “rents are rising” is no longer, by itself, an acquisition reason. Converting the uplift into actual cash flow depends on three factors: the elasticity of substitutes at the location, the lease structure, and the activeness of operations.
The Urbalytics platform’s area rent benchmarks and whole-building gross cap rate distribution tools are designed to visualize these three factors pre-bid—the current median gross cap rate for whole-building assets around Shinjuku Station is 4.27% (n=31). At this level, scope for future earnings improvement depends less on waiting for price appreciation and more on proactive rent management.
#TokyoRents #Tokyo23Wards #WholeBuildingRentals #FixedTermLease #OrdinaryLease #FiveCentralWards #JapanRealEstateInvestment #RentGrowth #GrossCapRate #Shibuya #Shinjuku #Saitama #Kanagawa #CrossBorderInvestment #Urbalytics
References
TBS NEWS DIG Powered by JNN, 2026, “In Tokyo’s 23 wards, rents hit record highs; couples struggle to find homes, and izakayas face painful decisions amid rent hikes…”, https://news.yahoo.co.jp/articles/b4f2234a07d2ec3fc8f82a72bb0279474fd4cbbb
Kenbiya (survey lead: Teikoku Real Estate Co., Ltd.(帝国不動産株式会社)), 2026, “56.7% of owners raised rents, over 70% in the five central wards—Survey of 1,000 whole-building rental owners in Tokyo and the three surrounding prefectures: actual rental management”, https://www.kenbiya.com/ar/ns/research/chintai_market/10400.html
Urbalytics, 2026, Rent statistics (rent_stats・MANSION/Shibuya, Shinjuku, Ikebukuro, Yokohama, Omiya/2026年8月6日取得), https://www.urbalytics.jp/
Urbalytics, 2026, Whole-building gross cap rate statistics (building_cap_rate_stats・Shinjuku/2026年8月6日取得), https://www.urbalytics.jp/
Toyo Keizai Online, 2026, “Over a quarter century, how ‘one-oku’ condos have changed… What ¥100 million buys has shifted from ‘Minato Ward, 102 m²’ to ‘outside the 23 wards, 66 m²’”, https://toyokeizai.net/articles/-/952968?display=b
Copyright: This article is original content by the author. Please do not reproduce, copy, or quote without permission. For usage requests, please contact the author or this site.