Words: 1377 | Estimated Reading Time: 7 minutes | Views: 25
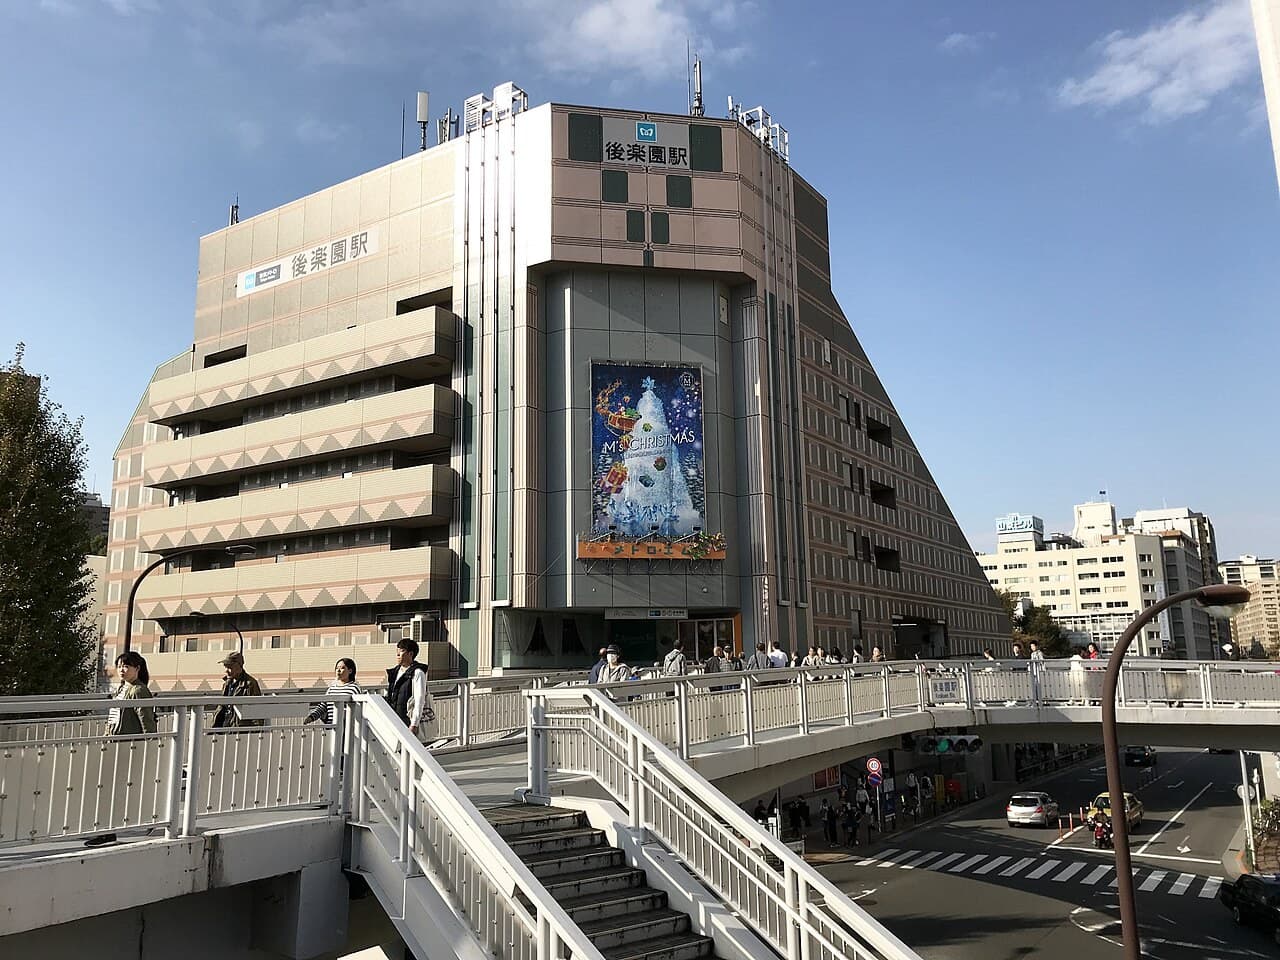
In July 2026, the average contracted price of newly built condominiums in Tokyo’s 23 wards reached a record high of ¥265.2 million, nearly doubling year-on-year. Meanwhile, over the same period in Azabu-Juban (麻布十番), the asking per tsubo (3.3 m²) price for whole-building income properties fell for four consecutive quarters by 16.87%—the for-sale and income-property markets are diverging in opposite directions.
Data released on August 20 by the Real Estate Economic Institute (不動産経済研究所) pushed a long-running debate to an extreme. In July 2026, the average price per unit for newly built condominiums in the 23 wards was ¥265.2 million, YoY +96.0%, nearly doubling.
This surpassed the previous peak of ¥217.5 million set in March 2023, marking the first time the 23-ward average entered the upper-¥200 million range. In the six central wards (Chiyoda, Chuo, Minato, Shinjuku, Bunkyo, Shibuya), the average price rose even more sharply to ¥436.99 million, more than doubling year-on-year.
What investors should pause to consider is not the “new record” headline itself, but the mechanism that pushed prices to this level.
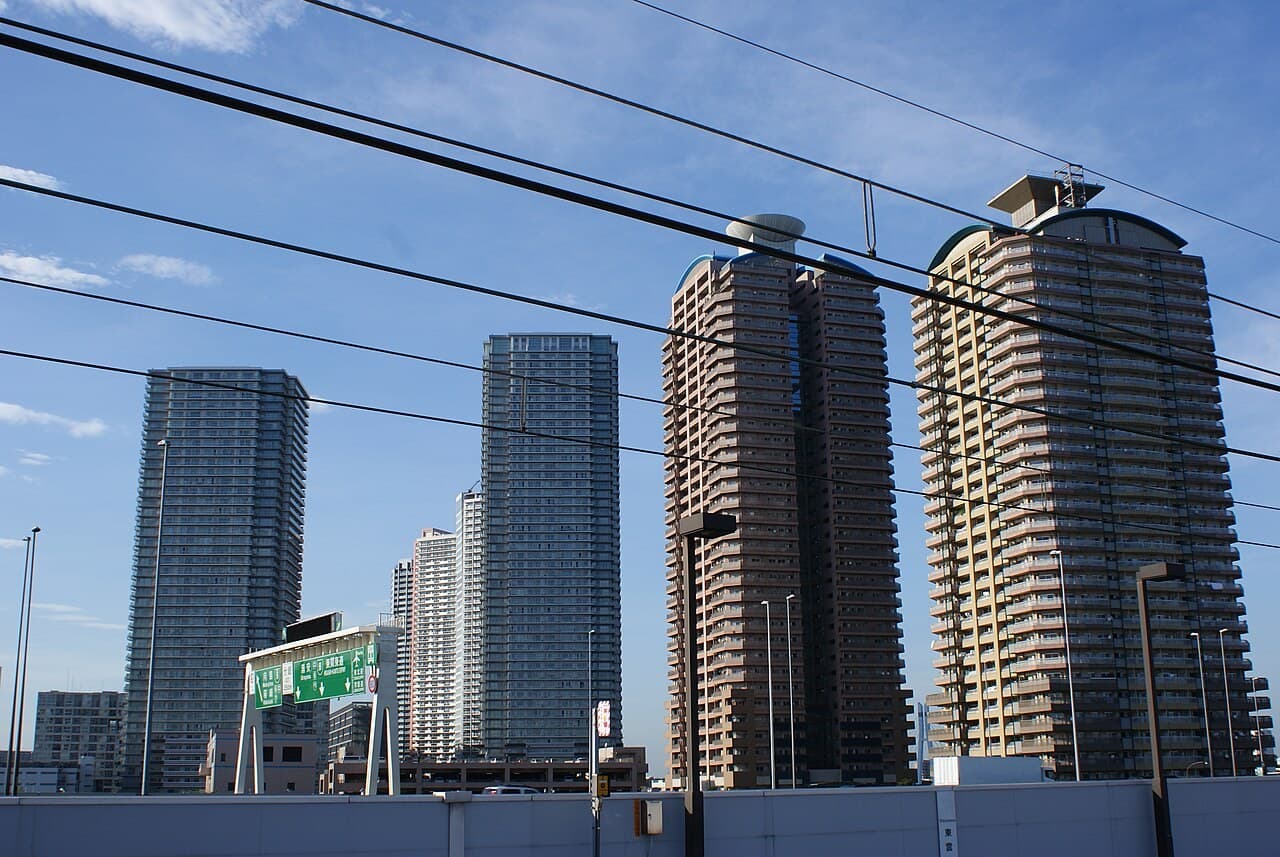
The institute itself points to the answer. In Minato, a cluster of high-ticket projects averaging around ¥500 million per unit came to market, “lifting” the 23-ward average. According to FNN, the specific driver was a group of large-scale tower projects newly supplied in the Azabu-Juban area of Minato. Greater Tokyo’s July average also hit a record ¥164.93 million, YoY +63.7%. That backdrop is structural: projects in the 23 wards accounted for about half of Greater Tokyo’s supply, and a large-scale project in Tokyo’s Kita Ward averaging around ¥150 million per unit further raised the overall figure.
Put differently, this record is a record of supply mix, not of price level. Only 2,145 units were sold across Greater Tokyo in July (YoY +6.9%). With such a small denominator, just a few ultra-expensive towers can move the statistical average anywhere. One more notable point in the same dataset: outside the 23 wards (e.g., Tama), the average price in the rest of Tokyo Prefecture rose YoY +87.9% to ¥105.59 million, exceeding ¥100 million for the first time. This indicates that higher pricing is not confined to the urban core but is rippling outward along the supply chain.
So what does this record mean from an income-property investor’s standpoint? Focusing on the same area—Minato, Azabu-Juban—let’s check prevailing rents and realized income-property pricing.
Urbalytics’ rent statistics and whole-building yield (gross yield) distribution tools show a picture quite unlike the “average new-build price doubled” headline. In the Azabu-Juban Station area sample of rental apartments, the average monthly rent is about ¥382,000, with an average unit size of 48.5 m², which translates into an average unit rent of about ¥6,800/m². Over the past five quarters, unit rents edged up only from ¥22,900/m² to ¥23,500/m², a cumulative increase of +2.62%, or less than 0.7% per quarter.
Across 34 whole-building income properties currently listed in the same station area, the average asking price is ¥882.71 million, average annual rental income ¥27.88 million, and average gross yield 3.11% (median also 3.11%). The average asking price per tsubo fell from ¥9.4876 million/tsubo in Q4 2025 to ¥7.8871 million/tsubo in Q3 2026, a four-quarter cumulative decline of -16.87%.
With rents barely moving, asking prices for income properties are clearly retreating. Plot the two curves on the same chart and the most realistic price structure in Tokyo’s core today comes into view.
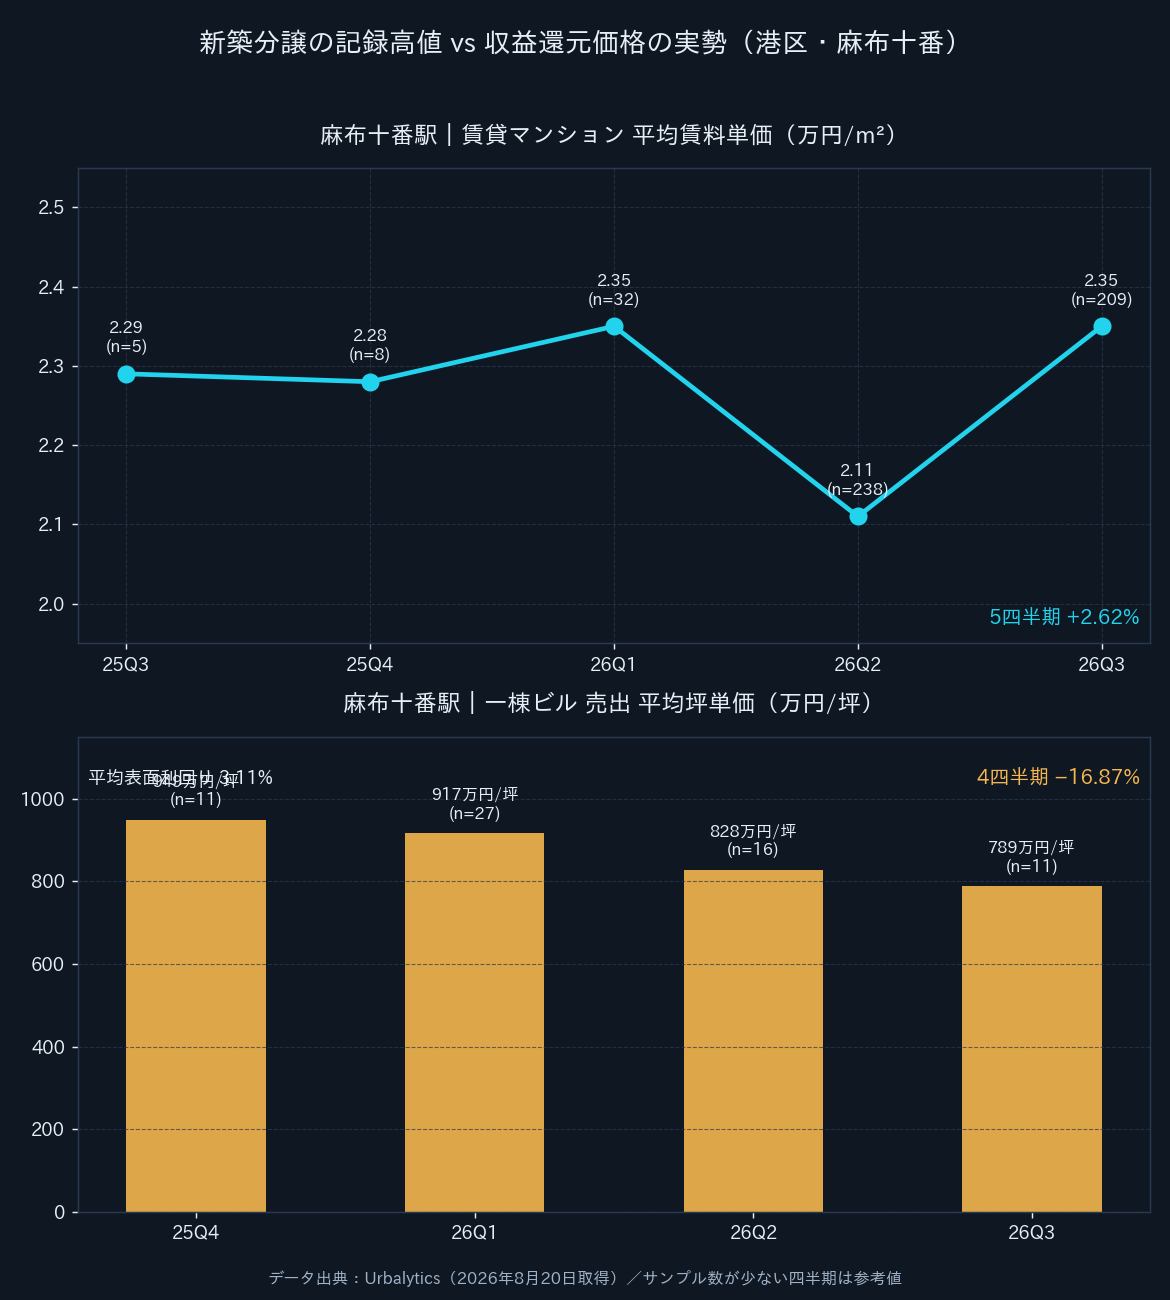
Urbalytics Insight What Urbalytics’ internal data highlight in this contrast is that under an extreme supply mix, the “average price” metric loses reference value. For-sale prices are determined by developers’ product strategies and land costs, while income-property prices are set by the division rent ÷ yield. If rents have risen just +2.62% over five quarters and rising funding costs are pushing up buyers’ required yields, fair value for income properties can only go down—even if a brand-new unit across the street sells for ¥500 million.
The drivers behind this divergence aren’t obscure. Three forces are acting at once:
1) Cost-push price rigidity. Tadashi Matsuda, Senior Chief Researcher at the Real Estate Economic Institute, notes that land and materials costs continue to rise and states that the upward price trend will persist. Once developers have acquired land and locked in construction costs, cutting prices themselves is almost impossible; they can only protect margins by pacing supply and focusing on the high-net-worth segment.
2) A materially tighter funding environment. Diamond Real Estate Research Institute projects the Flat 35 mortgage rate will rise to 3.420% in September 2026, nearing the 3.5% threshold—high enough to change the pricing equation for income properties. When funding costs reach around 3%, an asset with a 3.11% gross yield produces little to no positive cash flow on a leveraged basis. Buyers’ remedy is simply to lower the purchase price.
3) Demand-side stratification. The ¥500 million price tier is supported by high-net-worth buyers purchasing with cash, prioritizing wealth preservation and scarcity, and showing very low rate sensitivity. Income-property buyers, by contrast, rely on financing and cash flow underwriting and are highly rate-sensitive. Even within the same area, the two cohorts’ bidding power is diverging rapidly, producing the seemingly contradictory phenomenon that “new builds get pricier while income properties get cheaper.”
Risk note Note that the quarterly sample size for whole-building data in Azabu-Juban is small (only 11 cases in 2026 Q3), so the four-quarter decline in per-tsubo prices should be treated as a reference value, not a precise conclusion. Also, swings in total asking amounts in the ¥150–200 million range partly reflect shifts in the mix of deal sizes coming to market, not purely downward price revisions. For a view of prevailing levels, one must ultimately return to closed-comparable analysis for individual assets.
What about the outlook? In my view, “records” on average for-sale prices will keep appearing, while their meaning as a market thermometer will diminish further. As long as ultra-expensive core projects are introduced in batches and total supply remains at a low monthly level of around 2,000 units, a single project can rewrite the monthly average. The Real Estate Economic Institute also states the boundary condition for this view—Matsuda warned in the same release that “if rate increases accelerate, the market could cool.”
For income-property investors, the real opportunity lies within this very divergence. While media attention is fixed on the ¥265 million headline, per-tsubo prices for whole buildings within the same ward and station area are adjusting at a pace of over 5% per quarter, with rent fundamentals barely deteriorating. This window has been rare in the city center over the past three years.
Of course, a window is not the same as safety. The keys to judging whether this adjustment is a “chance” or “the start of a trend” are twofold. First, can rents hold or edge up in a rising-rate environment? Second, can you lock in an entry yield with a sufficient margin over funding costs? Statistical averages cannot answer these two questions—only by returning to rents and closed samples for specific station areas and asset types can you draw your own baseline. That is why we integrate rent levels, yield distributions, and price history on a single screen in Urbalytics.
#TokyoRealEstate #23Wards #NewCondominium #Minato #AzabuJuban #NewBuildCondo #GrossYield #TsuboPrice #GreaterTokyoPropertyPrices #JapanRealEstateInvestment #IncomeProperty #WholeBuilding #Flat35 #JapanMortgageRates #Urbalytics
References
- Yomiuri Shimbun Online, 2026, “Average price of new condominiums in July hits a record ¥265.2 million in Tokyo’s 23 wards… Minato lifted prices,” https://www.yomiuri.co.jp/economy/20260820-GYT1T00268/
- Jiji Press, 2026, “New condos in Tokyo’s 23 wards hit a record ¥260 million—high-priced units in Minato lift overall average (July),” https://news.yahoo.co.jp/articles/e97b0984e5cc74a7efeed56465be4f1b7c592417
- FNN Prime Online, 2026, “Average price of new condos sold in Tokyo’s 23 wards in July was ¥265.2 million, a new record high,” https://news.yahoo.co.jp/articles/cd832db910f6abfff4f5a139f1b9f7d8cb7331b5
- Diamond Real Estate Research Institute (ダイヤモンド不動産研究所), 2026, “Will Flat 35 rates rise further in September to near 3.5%?! Forecasts for mortgage rates (floating and 10-year fixed)!” https://news.yahoo.co.jp/articles/ef76a04bde13ec5f38350d85ad72d82e6afb62b8
- Real Estate Economic Institute (不動産経済研究所), 2026, “Greater Tokyo Condominium Market Trends (July 2026),” https://www.fudousankeizai.co.jp/
- Urbalytics platform internal data (Azabu-Juban Station area rent statistics and whole-building yield statistics), retrieved August 20, 2026, https://www.urbalytics.jp/
Copyright: This article is original content by the author. Please do not reproduce, copy, or quote without permission. For usage requests, please contact the author or this site.