Words: 1279 | Estimated Reading Time: 7 minutes | Views: 24
Homebuyer demand priced out of the city center has only pushed to the edge of the 23 wards—at Ukima-Funado, average single-building price per tsubo jumped 71.7% over five quarters, while in the likewise “suburban” Higashiyamato City it fell by nearly 10%.
The central six wards cool first as demand shifts outward
On September 3, 2026, two seemingly unrelated headlines landed the same day. One quoted housing commentator Yukio Sakurai saying households earning around ¥5 million a year can still buy a 3LDK in Tokyo; the other reported at home’s July data showing the average price of resale condominiums in Tokyo’s 23 wards rose to ¥88.84 million, marking a 24th straight record.
The signal only emerges when you read them together. Even as prices hit new highs, the month-on-month increase has narrowed to 0.2%, the third consecutive month of deceleration.
More importantly, the 23 wards are diverging internally. Splitting the 23 wards into three buckets, at home reports July 2026 m/m changes of: the six central wards (Chiyoda, Chuo, Minato, Shinjuku, Bunkyo, Shibuya) −1.8%; the six southern and western wards +1.2%; and the eleven northern and eastern wards +1.8%.
In other words, this isn’t “the 23 wards weakening across the board,” but rather the former leaders turning first. at home Lab’s executive director, 磐前淳子, frames it as “a pause after a sharp run-up, entering an adjustment phase of slower gains,” not an outright downturn.
Average prices in the central six are already near ¥140 million. At that level, even dual-income high-earning “power couples” (パワーカップル) struggle to transact, and the domestic and foreign investors who underpinned the central rally have turned cautious. That displaced demand needs a new home.
Urbalytics data: Two “suburban” directions diverge completely
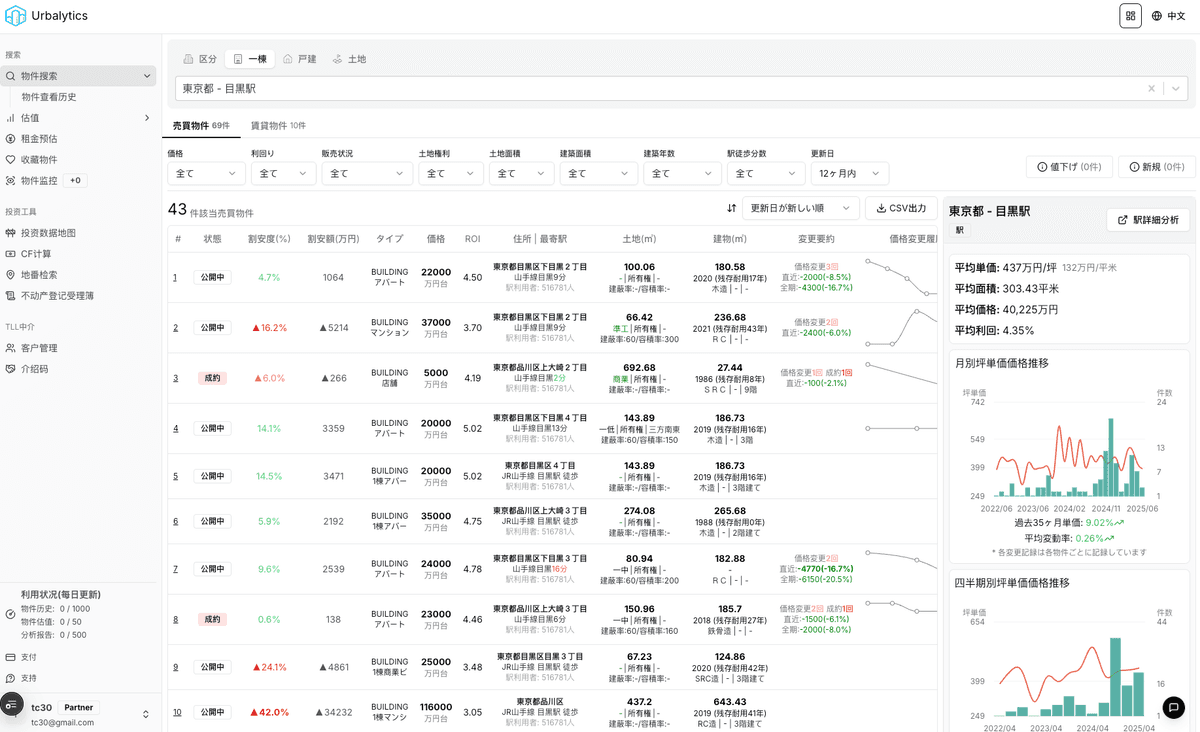
The question is: where did that overflow demand actually go? Using Urbalytics’ station-catchment statistics, we placed the two areas Sakurai named—JR Saikyo Line’s Ukima-Funado Station and Seibu Haijima Line’s Higashi-Yamatoshi Station—on the same chart. The picture isn’t as simple as “the suburbs rise together.”
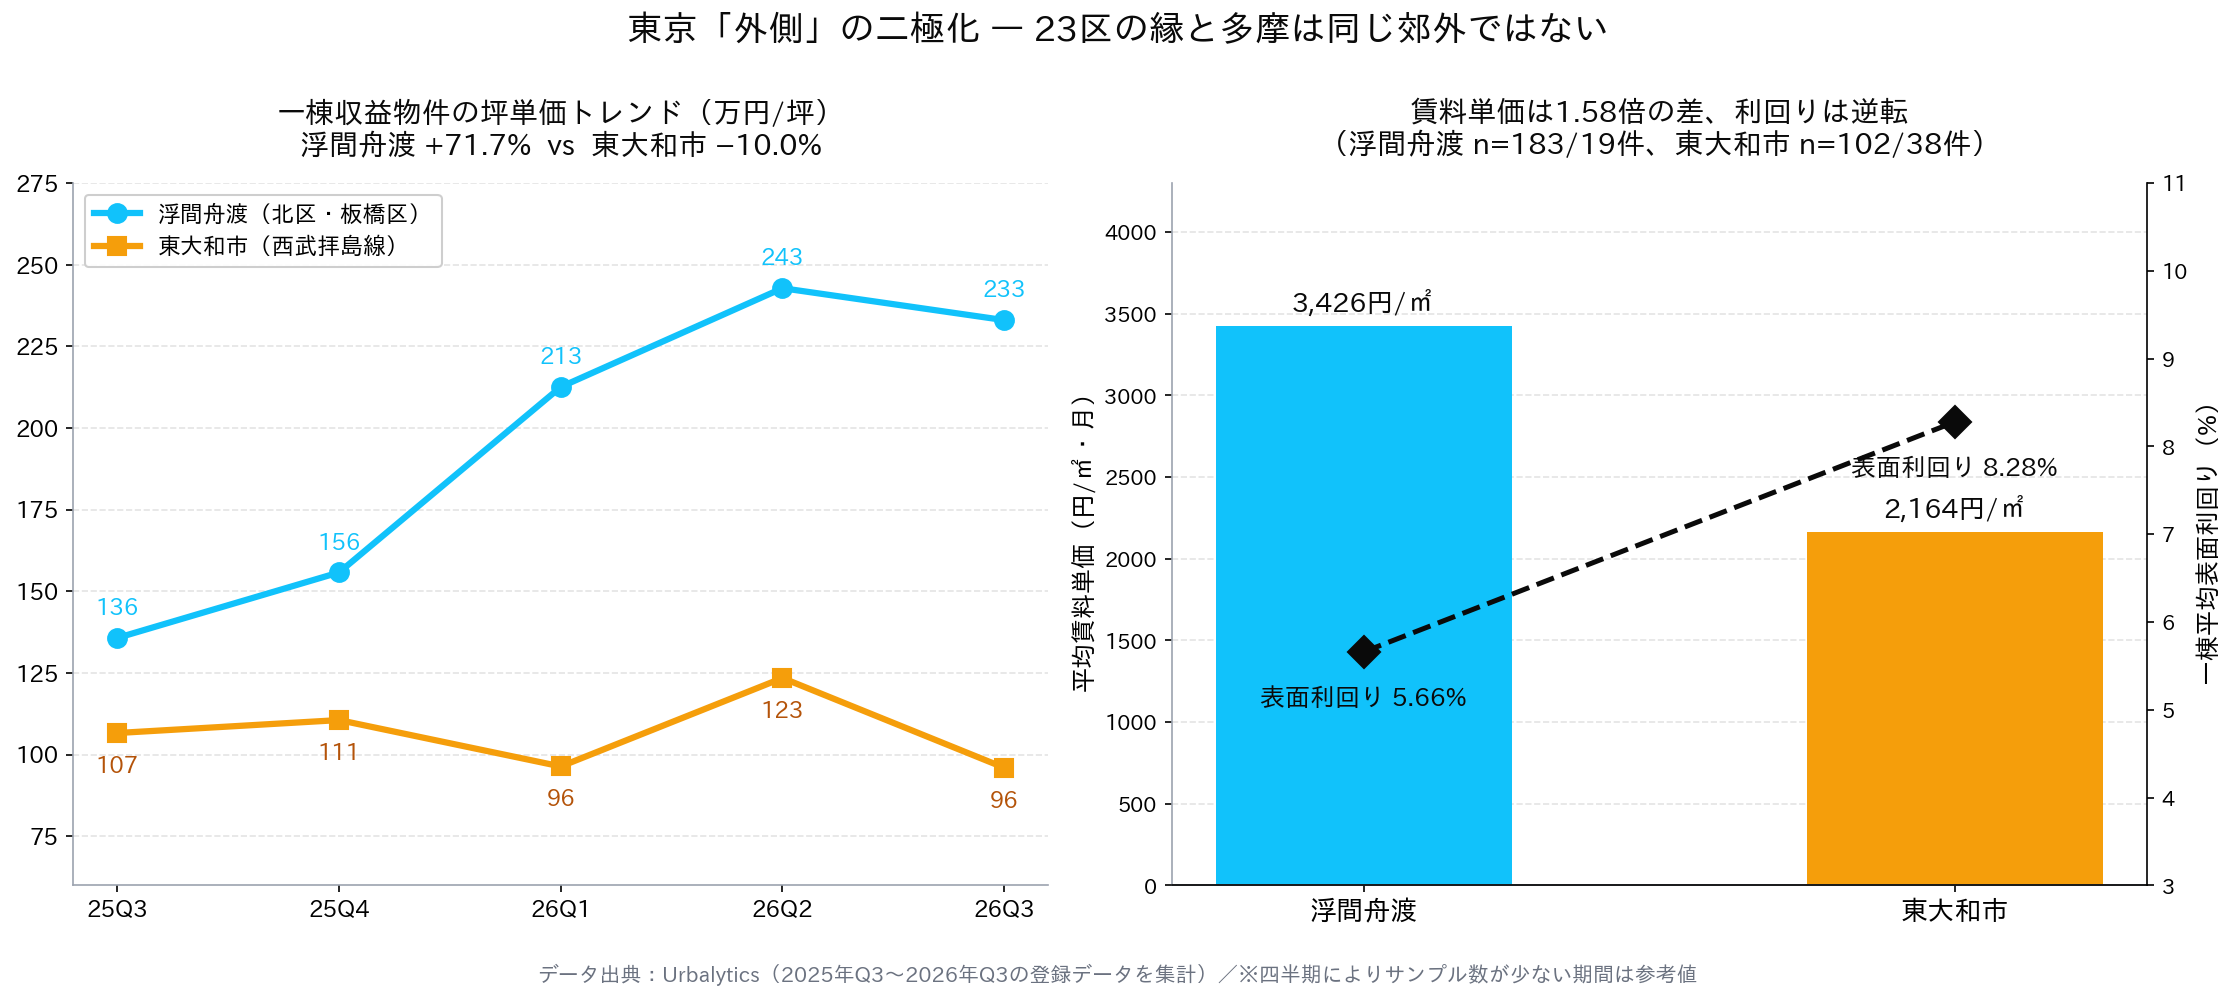
In the Ukima-Funado station catchment, average price per tsubo for single-building income properties (一棟収益物件) rose from ¥1.3577 million in 2025 Q3 to ¥2.3307 million in 2026 Q3—an aggregate five-quarter gain of 71.7%. Over the same period, the Higashi-Yamatoshi catchment retreated from ¥1.0665 million to ¥0.9602 million, a −9.97% decline.
The rent side tells the same story. Across 183 active rental listings in Ukima-Funado’s catchment, the average asking rent is ¥3,426 per m²; in Higashi-Yamatoshi’s 102 samples it’s just ¥2,164—the former is 1.58× the latter.
Urbalytics Insight Internal Urbalytics data show the gross yields (表面利回り) invert: among 19 single-building samples in Ukima-Funado, the average yield is 5.66% (median 5.32%); in Higashi-Yamatoshi’s 38 samples it’s as high as 8.28% (median 7.35%). Where prices run fast, yields compress; where prices fall, yields still sit above 8%—a clear expression of how capital is pricing the two locations.
Note that quarterly sample sizes are uneven—single-building samples in 2025 Q3–Q4 are in the single digits and should be treated as indicative only. But in 2026 Q2–Q3, Ukima-Funado has 9 and 25 samples, while Higashi-Yamatoshi has 9 and 35, respectively; the directional trend holds.
¥35 million vs ¥50 million: Two paths to a 3LDK
Sakurai’s affordability rule of thumb is simple: a reasonable home price is roughly 7–8× household annual income. For households earning ¥5–6 million, that puts the ceiling around ¥50 million.
Within that budget, he pointed to two specific options.
First, Kodaira City and neighboring Higashiyamato City in western Tokyo. Near Seibu Haijima Line’s Higashi-Yamatoshi Station, 3LDK condos built in 2014 and within a 10-minute walk sometimes list for around ¥35 million. Sakurai notes that recent new-build supply here has been heavy; when new supply is abundant, resale units struggle to command strong prices.
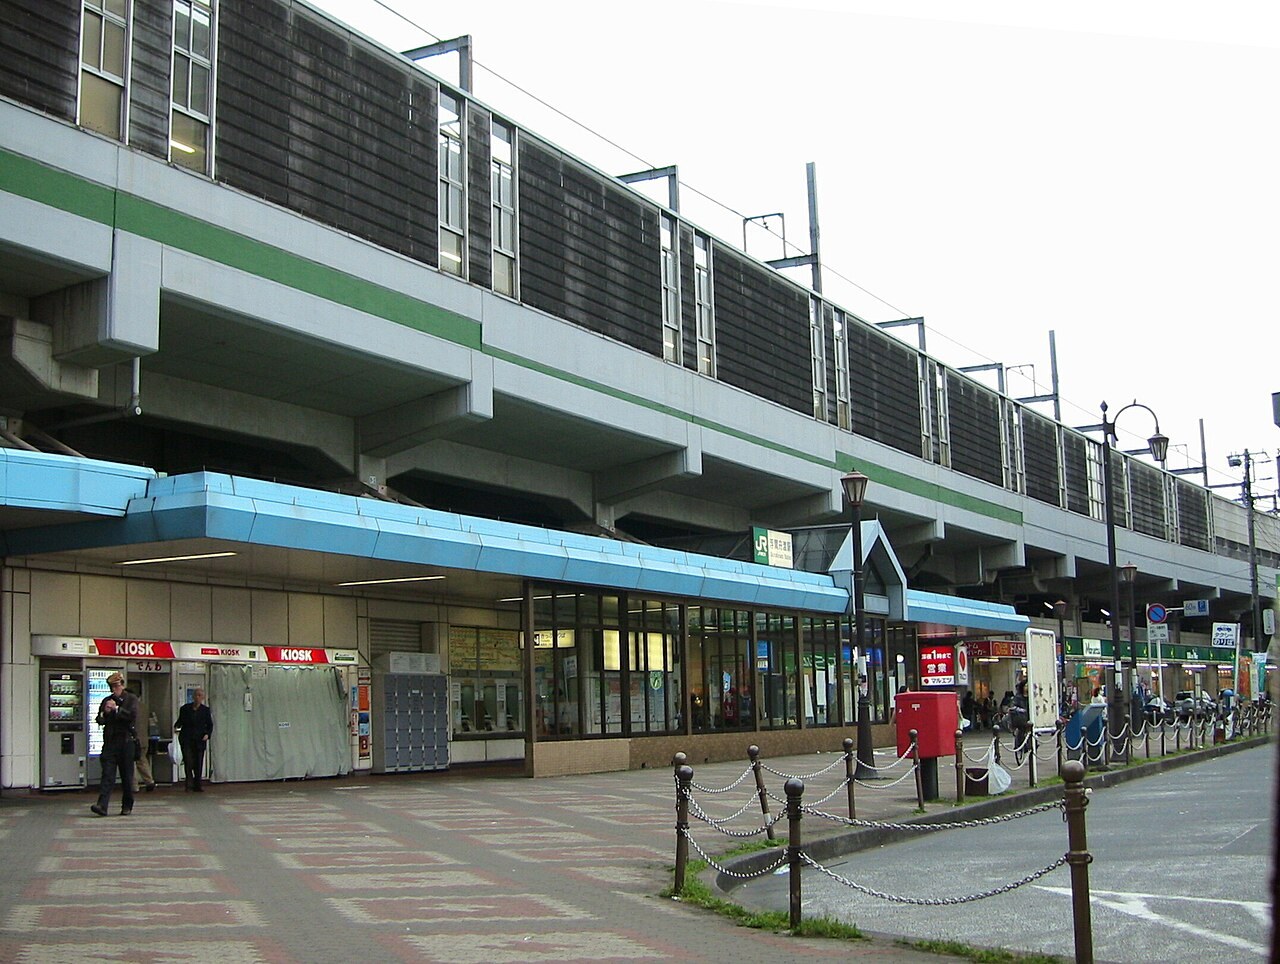
Second, Ukima-Funado Station on the JR Saikyo Line within the 23 wards. Similar layouts run about ¥50 million. Sakurai is blunt: it’s a station with low name recognition but genuinely attractive pricing; across the Arakawa River lies Saitama Prefecture, and there are no large shopping malls nearby—factors that cap prices.
Overlaying these paths with the earlier data clarifies the trade: the extra ¥15 million isn’t buying more space; it’s buying the fact of remaining inside the 23-ward administrative boundary. And the market has already priced that boundary: +71.7% versus −9.97% in price per tsubo.
What this means for investors
For overseas buy-and-hold investors, this dataset overturns a common simplification—“if the core is too expensive, go to the suburbs.” What’s really rising is the ring within the 23 wards that has not yet been fully priced.
磐前 also notes that end-users leaving the core aren’t necessarily compromising. With the same budget, they can buy larger space, higher-spec buildings, or better education/childcare environments in the periphery—turning “settling for less” into an active choice. This is genuine end-user demand, not speculation, and it supports rents.
On the sell side, the market is pivoting in tandem. On-the-ground feedback from agencies clusters around three themes: longer marketing periods, list prices failing to clear and being cut in stages, and inventories beginning to build.
Risk warning The issue with nodes like Ukima-Funado is the speed of the move: after +71.7% over five quarters, average gross yield has compressed to 5.66%, and average single-building ticket size here is around ¥188 million. Buying the rip leaves a visibly thinner margin of safety. In Higashiyamatoshi, yields are still above 8%, but with price per tsubo trending lower, exit-liquidity risk warrants a separate assessment.
Before making a specific decision, two checks are worth doing first.
First, use Urbalytics’ station-catchment yield and rent statistics to locate the current asking price within the past five quarters’ price-per-tsubo percentiles—so you know where today’s quote sits in its historical range, rather than relying only on agents’ headline figures.
Second, factor in interest-rate changes. 磐前’s reminder is plain: if mortgage rates rise while you wait for prices to fall, the higher interest burden could more than offset the decline in principal.
Conclusion
Tokyo in summer 2026 is switching from “everything is rising” to “know exactly where it’s rising.” The central six wards have fallen for three straight months, while the northern and eastern wards are still at +1.8%—that demarcation itself is the year’s key signal.
For long-term holders, the opportunity lies in 23-ward edge stations with solid rent support and manageable ticket sizes; the risk is that these nodes have already run hard, yields have compressed, and the margin for error is shrinking.
If you want to pinpoint where a given station now sits on this curve, Urbalytics’ station-catchment rent and gross-yield statistics provide a direct read.
#TokyoRealEstate #ResaleCondos23Wards #UkimaFunado #HigashiYamatoshi #Kodaira #SaikyoLine #SeibuHaijimaLine #KitaWardInvestment #ItabashiWard #GrossYield #SingleBuildingIncomeProperties #TokyoHousingPrices #JapanRealEstateInvestment #RentalMarketLevels #Urbalytics
References
- MONEY POST WEB, 2026, “Can households with annual income in the ¥5 million range still buy a 3LDK in Tokyo!? Housing commentator Yukio Sakurai explains notable areas along the Seibu Haijima Line and JR Saikyo Line”, https://news.yahoo.co.jp/articles/b4182bafe9d3ab70f05d711ea53707231d51daa0
- LIMO, 2026, “Resale condo prices in Tokyo’s 23 wards hit a record for the 24th consecutive month, but gains are slowing. The stance of buyers and sellers is also changing.”, https://news.yahoo.co.jp/articles/5588c1fedef00aef17c2efa8e4a99241ee375e01
- at home Co., Ltd., 2026, “Price trends for ‘resale condominiums’ in the Tokyo metropolitan area, July 2026”, https://athome-inc.jp/
- Tokyo Kantei, 2026, “Price of pre-owned condominiums converted to 70 m² (July 2026)”, https://www.kantei.ne.jp/
- Urbalytics, 2026, “Station-catchment rent statistics and single-building gross yield statistics (2025 Q3–2026 Q3)”, https://www.urbalytics.jp/