Words: 1870 | Estimated Reading Time: 10 minutes | Views: 1635
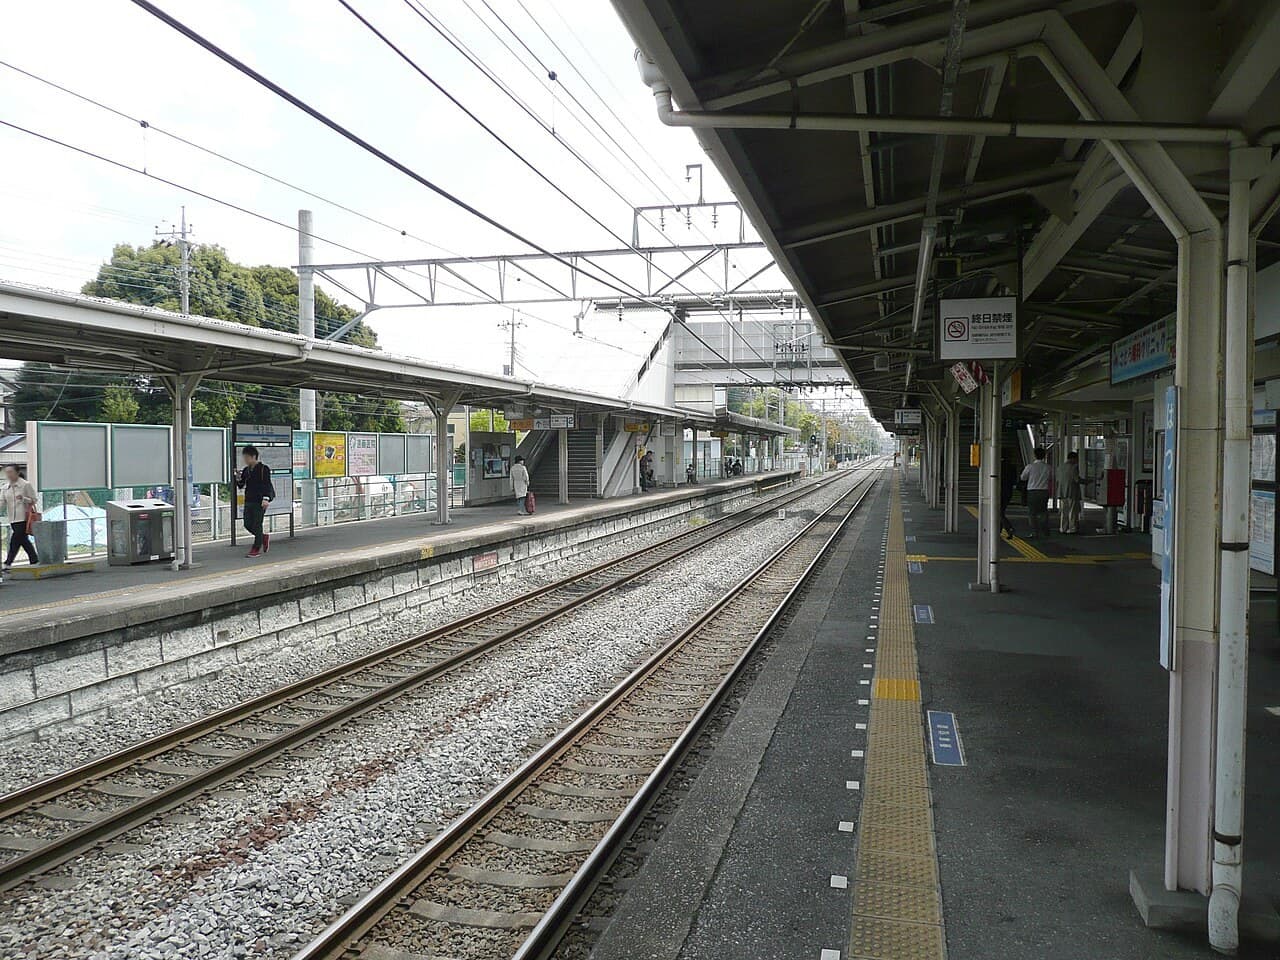
The fastest-rising residential land price in Greater Tokyo wasn’t in the city core but at a small stop with just one supermarket—Hatsuishi. Its surge was pushed up by spillover from the next station.
On July 1, 2026, Japan’s National Tax Agency released the new rosenka (roadside land value for inheritance/gift tax). The national peak remained in front of Kyukyodo, Ginza 5-chome, Chuo Ward, Tokyo, at JPY 53.36 million per m², up 11.0% y/y, topping the list for 41 consecutive years. But the numbers investors should really study sit at the other end of the ranking.
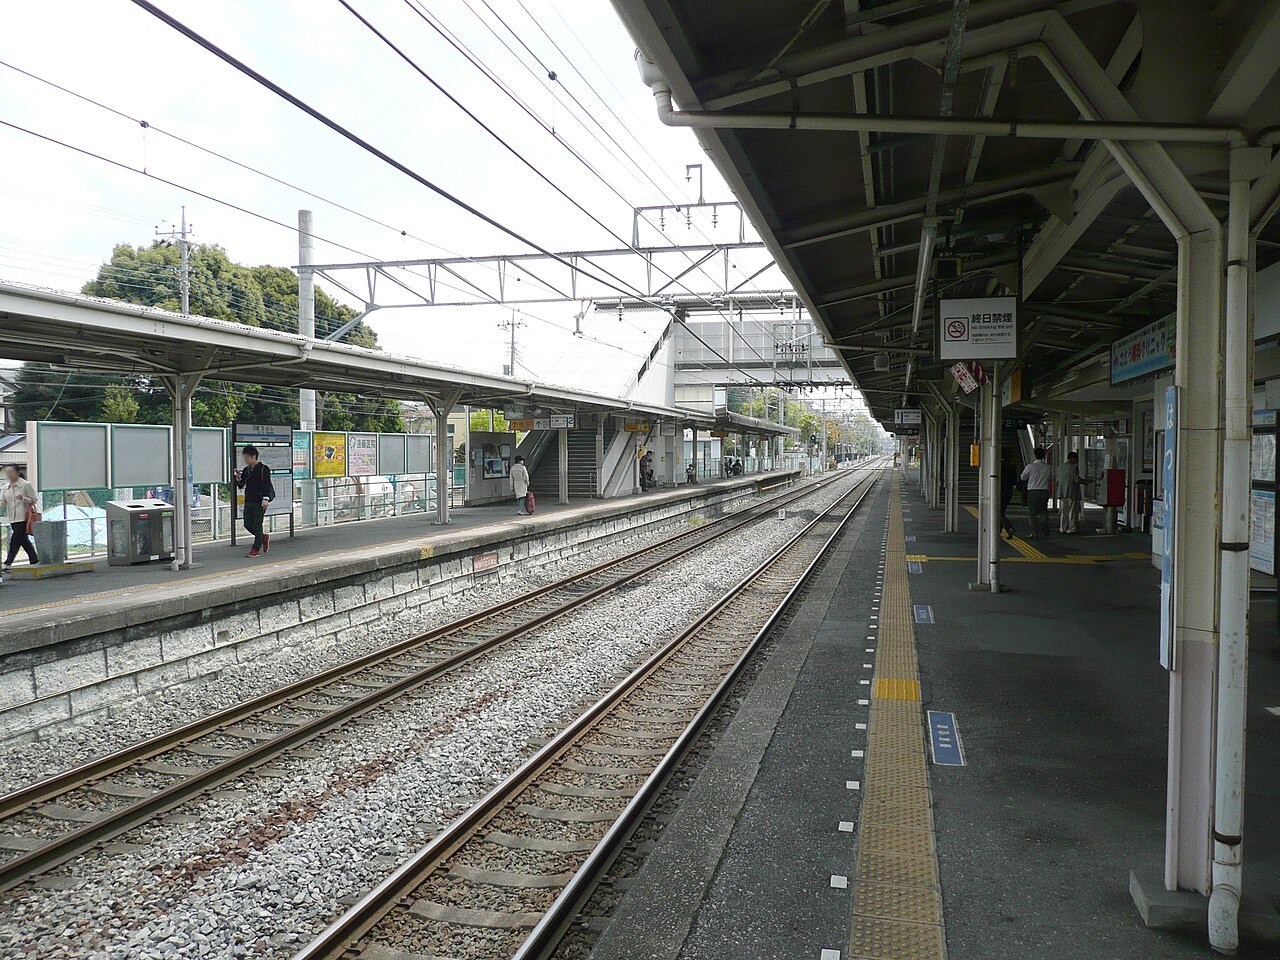
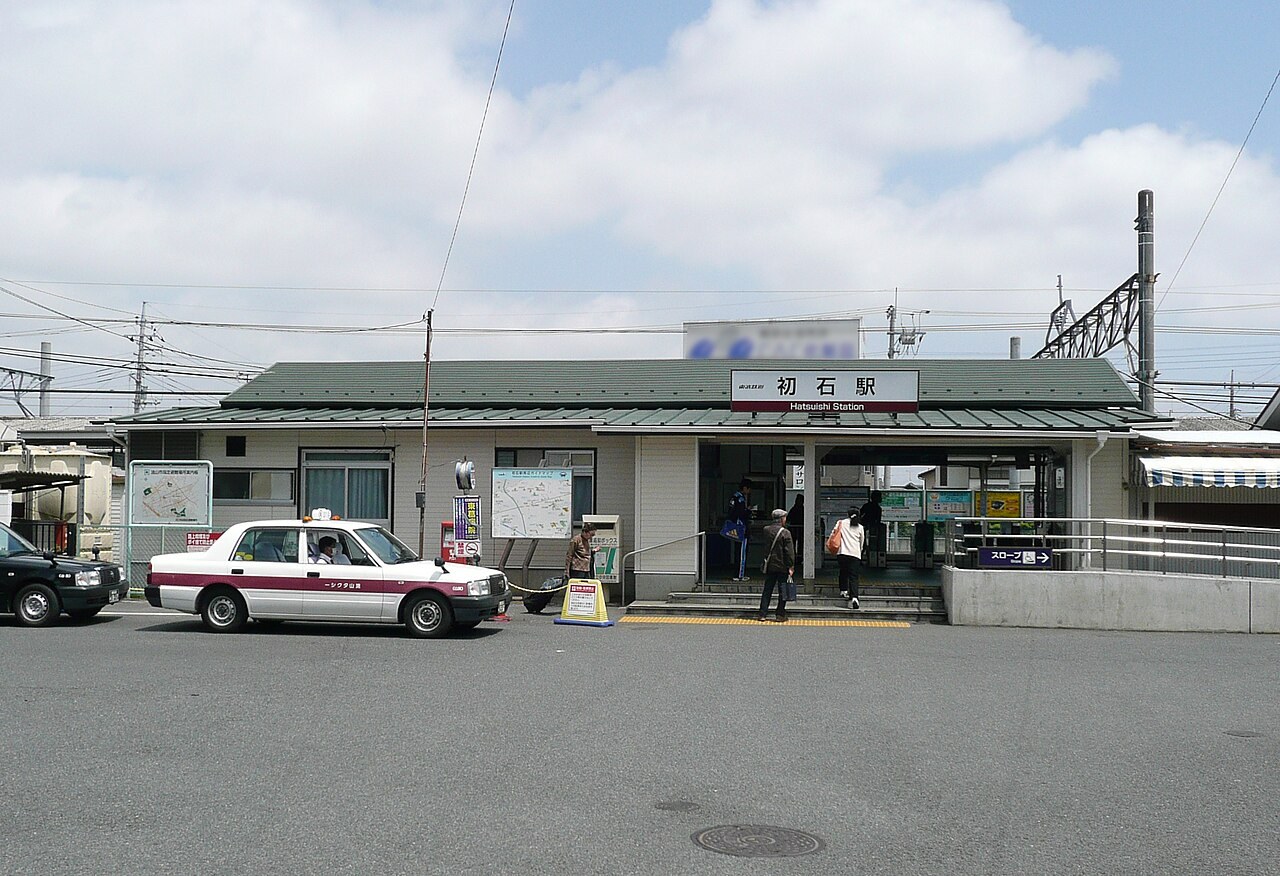
Within Greater Tokyo (Tokyo, Kanagawa, Chiba, Saitama), the top spot for residential land-price growth by location was Higashi-Hatsuishi in Nagareyama, Chiba—+16.1%. The nearest station, Hatsuishi, has little more than a supermarket, a convenience store, and a few izakaya outside its west exit.
I. From “backwater” to Japan’s population growth champion: Nagareyama over two decades
To understand why Hatsuishi suddenly caught fire, start with Nagareyama’s structural shifts. Before the Tsukuba Express (つくばエクスプレス) opened in 2005, Nagareyama was a classic commuter periphery in Chiba with flat land prices. After opening, central-city access was transformed: from Nagareyama-Ōtaka-no-Mori (流山おおたかの森) Station, the commuter rapid reaches Kita-Senju in about 15 minutes and Akihabara in under 30.
What turned Nagareyama from a “transport upgrade” into a “demographic phenomenon” was the oft-quoted city branding line, “If you’re becoming a mother, choose Nagareyama.” Backing the slogan, the city prioritized budgets for childcare capacity and shuttle buses—hard currency for dual-income households. The result: six straight years as Japan’s No.1 city-level population growth rate, a 12.8% increase over a decade, population surpassing 210,000, and the fastest growth of under-15s nationwide.
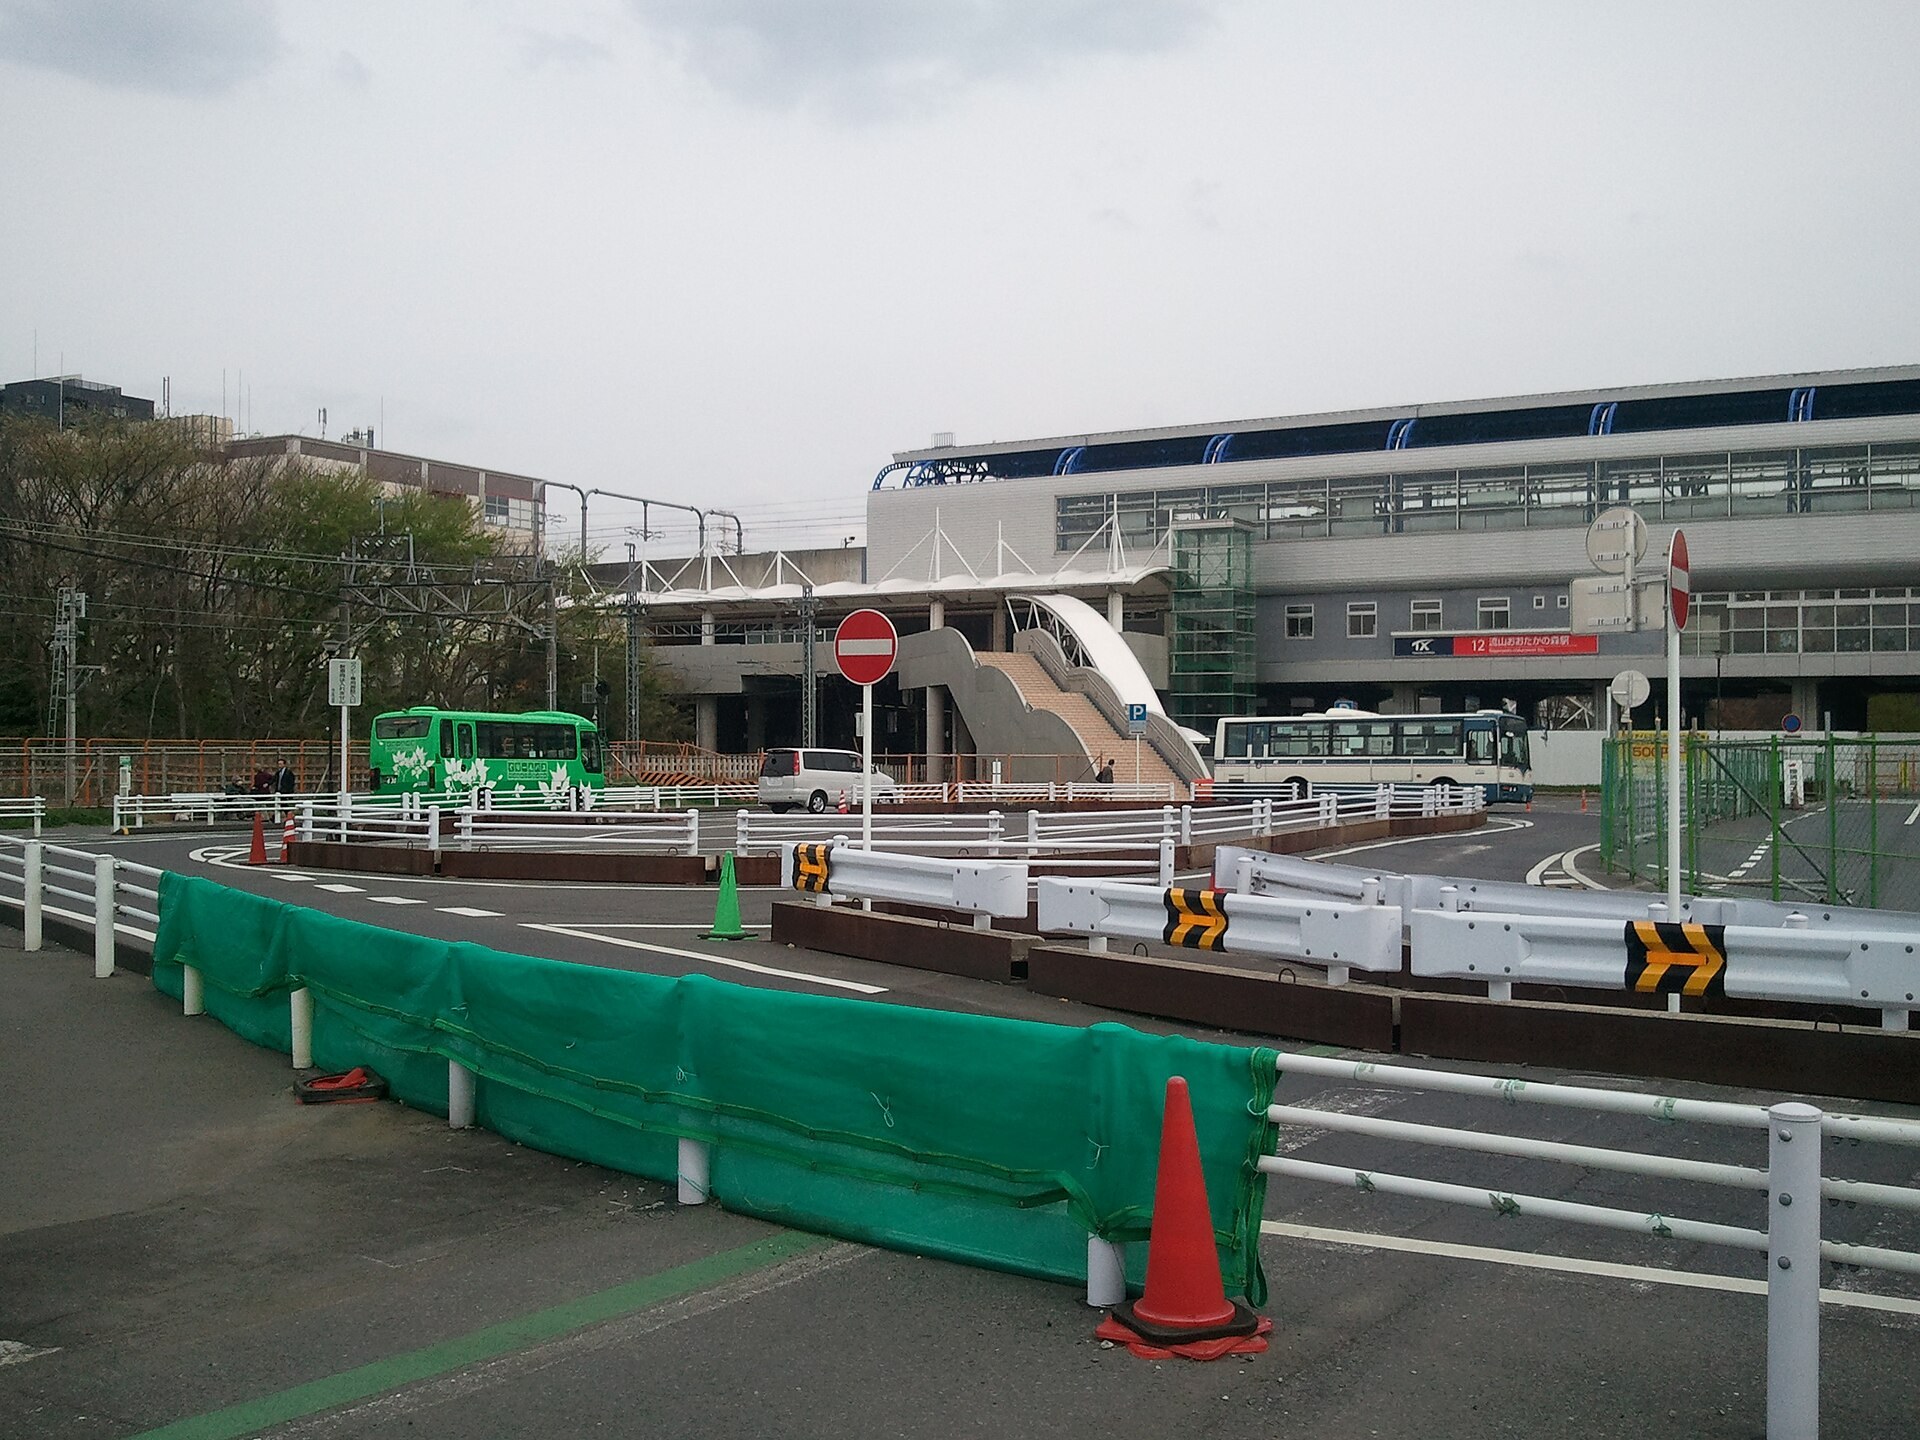
This dynamic first crystallized around Nagareyama-Ōtaka-no-Mori Station. The station hosts the Takashimaya-affiliated Nagareyama-Ōtaka-no-Mori S.C., earning the area the nickname “Chiba’s Futako-Tama,” in reference to Setagaya’s famed Tamagawa Takashimaya S.C. in Futako-Tamagawa.
But inflows of residents met limited land supply, with a predictable result: prices in Ōtaka-no-Mori rose beyond many households’ budgets. Demand spilled over, and the first stop was Hatsuishi—just one station away on the Tobu Urban Park Line (東武アーバンパークライン).
II. Two official datasets point to the same spot
Hatsuishi’s jump isn’t a one-off statistical blip; it’s confirmed by two independent official datasets.
First, March’s published land prices (kōji chika, as of January 1, 2026) from the Ministry of Land, Infrastructure, Transport and Tourism. Chiba’s residential land averaged JPY 130,000/m², up 4.6% y/y, ninth among Japan’s 47 prefectures. By municipality, Nagareyama’s residential land rose 13.3%, leading Chiba for the second straight year.
At the site level, three of Chiba’s top four residential gainers were in Nagareyama: No.1 Nagareyama-Ōtaka-no-Mori (Mita 69-283) +18.9%; No.2 and No.3 Higashi-Hatsuishi 2-chome (+18.8%) and Nishi-Hatsuishi 4-chome (+18.5%); No.4 Heiwadai near Nagareyama-Chūōkōen Station (+17.0%).
Four months later, the rosenka told the same story through a different tax lens: Higashi-Hatsuishi’s +16.1% was Greater Tokyo’s No.1 residential site-level gain, and Nagareyama’s residential land average +5.0% also ranked highest among Greater Tokyo municipalities. The levels differ—kōji chika are market appraisal values; rosenka underpin inheritance and gift tax—but the direction and magnitude align.
MLIT’s appraisal notes for Higashi-Hatsuishi 2-chome effectively codify the spillover thesis: core demand is “first-time buyers in their 30s, family households with average incomes currently renting in Nagareyama and adjacent cities,” attracted by “generally good living environment and convenience, with easy access to Nagareyama-Ōtaka-no-Mori Station; strong housing demand.” In investor terms: what sells here isn’t Hatsuishi per se—it’s buying Ōtaka-no-Mori’s lifestyle radius at Hatsuishi prices.
III. Urbalytics data: How wide is the price gap, how much yield compensation?
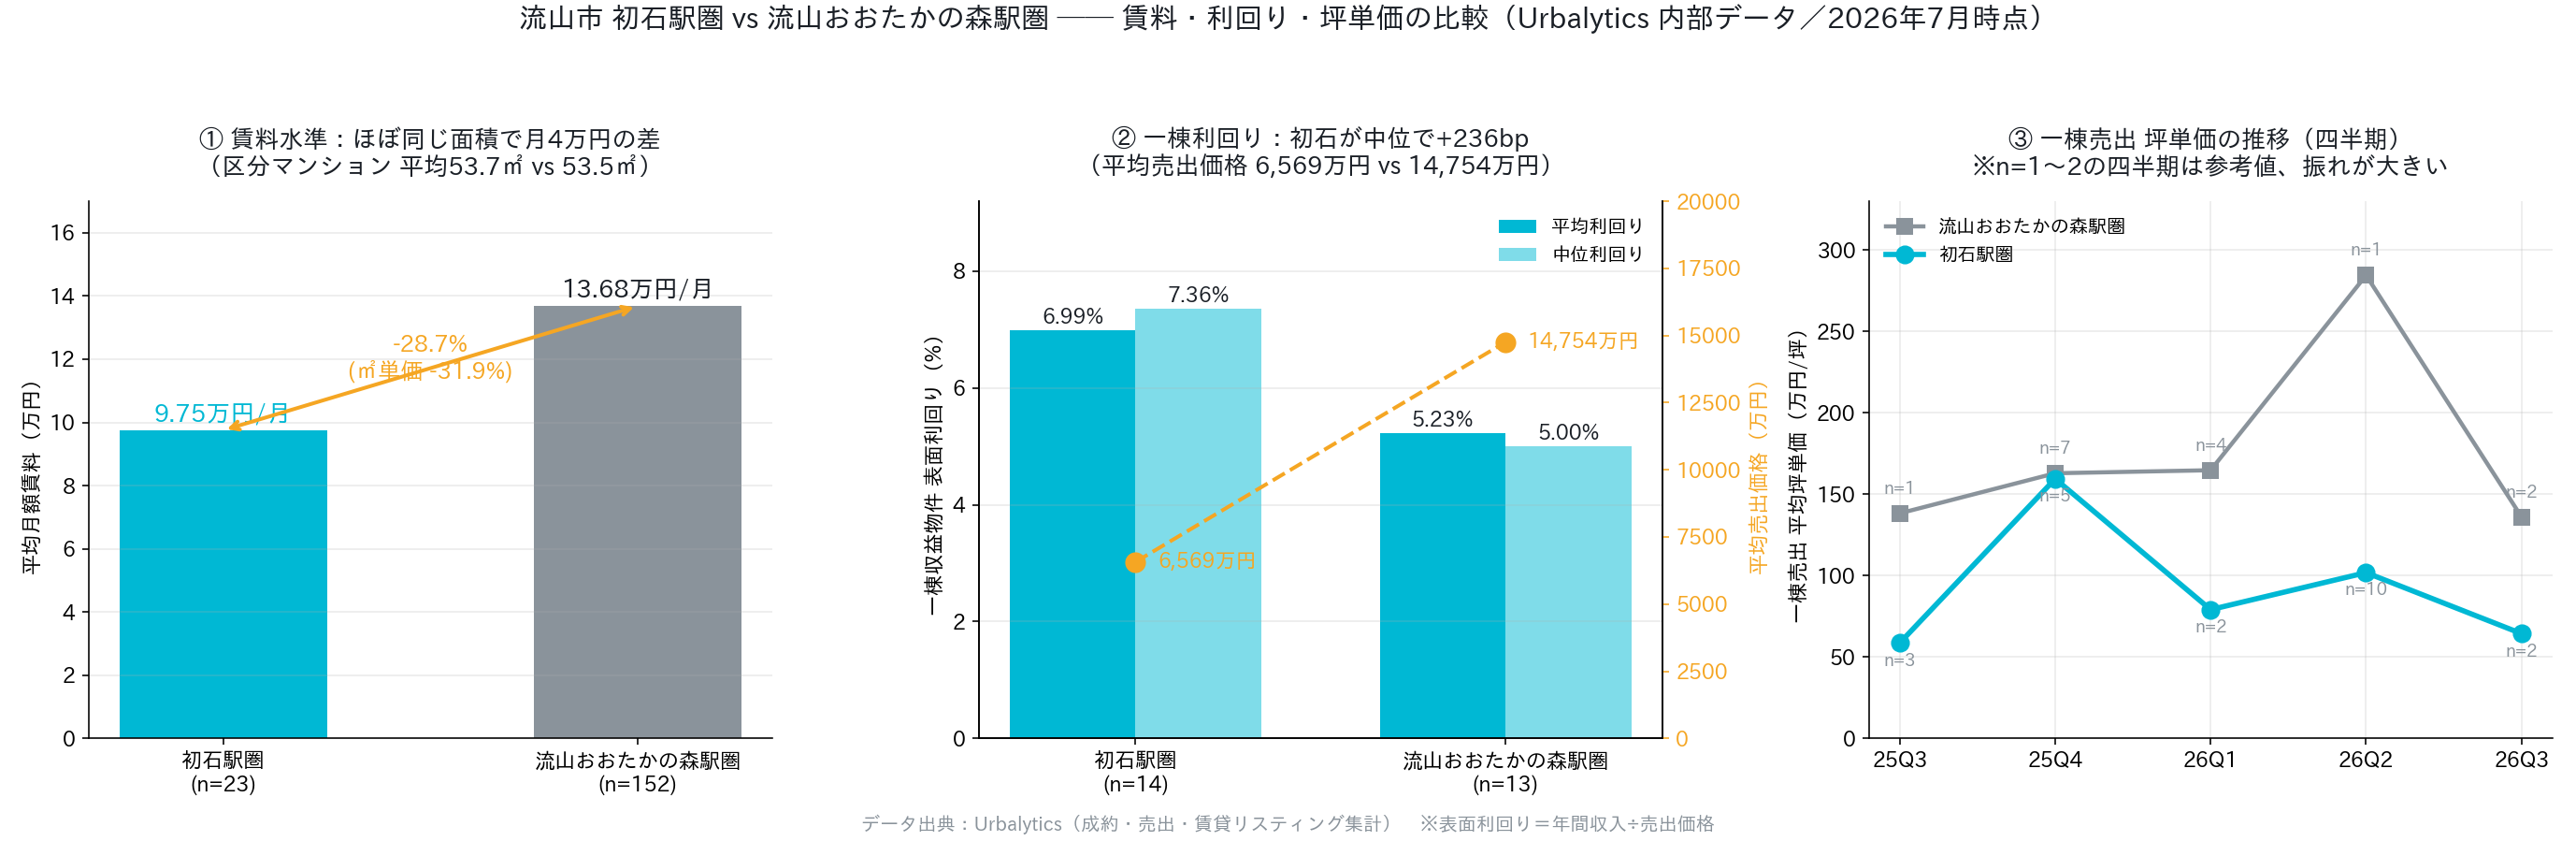
Land-price gains are backward-looking; investors should underwrite today’s spreads and cash flows. We set the two station areas side by side using Urbalytics leasing and on-market data; the picture is more instructive than headlines.
Rents line up almost perfectly: in Hatsuishi, condominium unit samples average 53.72 m² with average monthly rent of JPY 97,500; in Ōtaka-no-Mori, 53.51 m² at JPY 136,800. Similar size, a JPY 39,300 monthly gap—about a 31.9% difference per m². One stop apart, same unit size rents for roughly 70%.
Yield compensation on whole-building assets is even clearer. Hatsuishi shows average gross yield (表面利回り) of 6.99% and median 7.36%, versus Ōtaka-no-Mori’s 5.23% average and 5.00% median—Hatsuishi is 236 bps higher on a median basis. Correspondingly, Hatsuishi’s average list price is JPY 65.69 million vs. Ōtaka-no-Mori’s JPY 147.54 million—just 44.5% of the latter. Adjacent stops on the same line, yet entry price more than doubles.
Urbalytics Insight Putting both sets together clarifies Hatsuishi’s role: not a “cheap Ōtaka-no-Mori,” but a secondary catchment that trades rent discounts for yield premia. Rents are ~30% lower than next door, yet whole-building median yield is +236 bps and entry capital is under half. For price-sensitive investors relying on cash flow to cover interest, that trade-off works. Urbalytics’ area comparison and yield simulation features quantify exactly this kind of pricing dislocation between adjacent station areas.
The data also flag a caveat. Hatsuishi has only 23 rental samples vs. 152 in Ōtaka-no-Mori—a 6.6x gap; whole-building on-market samples are just 13–14 on each side. Thin samples imply thin liquidity—the flip side of brokers’ “units sell instantly” narrative: they do in good times, but when it’s your turn to exit, the bid may lack depth.
IV. The spark was one project: Mitsui’s “Ōtaka-no-Mori” property
Ultimately, Higashi-Hatsuishi’s leap was sparked by a single project. Mitsui Fudosan Residential and Tobu Railway are developing “Park Homes Nagareyama-Ōtaka-no-Mori Soraie” in Higashi-Hatsuishi 3-chome, Nagareyama: 7 stories, 161 units, slated to complete in late February 2028 with occupancy from late March; sales scheduled to start in early November 2026.
The key is positioning. Housing journalist Yumi Fukuoka notes the site is a 6-minute walk to Hatsuishi and 12 minutes to Nagareyama-Ōtaka-no-Mori—the true nearest station is Hatsuishi, yet Mitsui is marketing it as an “Ōtaka-no-Mori property”. That redirected broader buyer attention to Higashi-Hatsuishi and lifted land values.
She sums it up plainly: with popular stations’ front-of-station areas near saturation, the development wave relays outward one stop at a time—quiet neighborhoods can suddenly ignite. The industry adage “buy the stop next to the terminus” has proven out again.
Changes in spot land prices confirm it. According to local agents, two years ago plots five minutes from the station were about JPY 800,000 per tsubo; last year they rose to JPY 1,000,000 per tsubo; now even plots seven to eight minutes away fetch JPY 1,000,000 per tsubo. A new ticket gate opened on Hatsuishi’s east side last year, further boosting valuations there. In house terms: buy 40 tsubo of land and build a 30-tsubo home for roughly JPY 80–90 million in Hatsuishi, while in Ōtaka-no-Mori it’s “certainly over JPY 100 million.”
V. Will this upswing persist? Zoning has the answer
The key investor question: Will Hatsuishi become a second Ōtaka-no-Mori? Local practitioners say no—and not by intuition, by regulation.
Hatsuishi’s zoning (用途地域) comprises only two types—Neighborhood Commercial (近隣商業地域) and Category I Mid/High-Rise Exclusive Residential (第一種中高層住居専用地域). The former covers only the existing small station-front shopping street—no room to expand commercial GFA; the latter restricts building types. In short, the street’s “face” is locked by plan; it won’t grow into a commercial city like Ōtaka-no-Mori.
This cuts both ways. For owner-occupiers it’s good news: a quiet residential environment is protected from overdevelopment. For investors it calls for restraint: with commercial and FAR expansion capped, Hatsuishi’s upside largely depends on how long its price discount to Ōtaka-no-Mori remains compelling. Once spillover demand is absorbed—or if Ōtaka-no-Mori reprices—Hatsuishi’s “substitute good” thesis weakens.
Notably, the same brokers are now eyeing the next stops: Edogawadai (next to Hatsuishi) is undergoing station-front redevelopment, with potentially larger changes; and on the Tsukuba Express, Kashiwanoha-campus (adjacent to Ōtaka-no-Mori) is the most anticipated—university campus, cancer center, and Mitsui’s shopping park are in place, but land readjustment is not yet complete. The spillover wave is rolling on.
VI. Conclusion: The opportunity is clear—and so are the risks
Hatsuishi’s value as a case study isn’t “another rising suburb,” but its clear exposition of one of the Tokyo region’s most reliable pricing mechanics: when core-station prices hit affordability ceilings, demand propagates outward along the rails stop by stop, and institutional conditions (zoning, ticket gates, single large condominium projects) determine where and how that propagation halts. Investors who identify the next catchment early capture the spread; those who enter when headlines hit inherit an already repriced asset.
For long-hold, cash-flow-oriented investors, Hatsuishi currently offers a clear trade: entry capital under half of the next stop, a +236 bps median yield on whole buildings, in exchange for roughly 30% lower rents and thinner leasing/for-sale samples.
Of course, the flipside of opportunity is risk:
1) The immediate trigger is concentrated in Mitsui’s 161-unit project, which won’t deliver until March 2028; prices have already front-loaded expectations. If sales pacing or build costs surprise, valuations lack a second support.
2) Hatsuishi’s thesis is “relative cheapness”—classic substitute demand. If Ōtaka-no-Mori corrects, or if higher rates compress transaction capacity region-wide, substitutes often fall faster than the benchmark.
3) Zoning locks the commercialization path, implying no second-leg re-rating from redevelopment—upside is essentially capped by residential demand; don’t buy on “redevelopment concept” multiples.
The real test isn’t “how much has it risen,” but “relative to the next stop, how much margin of safety remains in today’s spread?” Comparative rents, yields, and price per tsubo for adjacent station areas can be pulled directly in Urbalytics to run your own math.
Tags
#Nagareyama City #Hatsuishi Station #Nagareyama-Ōtaka-no-Mori #Chiba real estate #Greater Tokyo land prices #Rosenka 2026 #Published land prices #Whole-building income property #Gross yield #Tsukuba Express #Tobu Urban Park Line #Zoning #Japan real estate investment #Area analysis #Urbalytics
References
- National Tax Agency, Reiwa 8 Property Valuation Standards (Rosenka map), 2026, https://www.rosenka.nta.go.jp/main_r08/tokyo/tokyo/prices/html/18008f.htm
- FRIDAY Digital (Yahoo! News), “Chiba residential area ranks No.1 in site-level land-price growth: The mechanism behind a quiet suburb near Tokyo suddenly ‘surging’,” 2026-07-30, https://news.yahoo.co.jp/articles/5e42300229636a3cdc502e57dfd877f42adf0c82
- Weekly Real Estate Management, “Rosenka for Reiwa 8 announced: Highest route value is Tokyo’s Ginza-dori,” 2026-07, https://www.biru-mall.com/attention/2026070601_03/
- Nikkei, “[Published Land Prices 2026] Chiba Prefecture: Nagareyama residential land up 13.3%; commercial land also rises,” 2026-03, https://www.nikkei.com/article/DGXZQOCC1236K0S6A310C2000000/
- Mynavi News, “Chiba land-price growth: Most of the Top 20 are ‘Nagareyama’! (Based on MLIT Published Land Prices/Real Estate Information Library appraisal reports),” 2026-03-31, https://news.mynavi.jp/premium/article/20260331-4276181/
- FNN Prime Online, “Published land prices: Nagareyama in Chiba takes multiple top slots in the Greater Tokyo rankings—spotlight on Tobu Noda Line’s Hatsuishi Station,” 2026-03, https://news.yahoo.co.jp/articles/b6efb28875e67799665a1a1bd9f939f52b80b7a4
- Mitsui Fudosan Residential, “Park Homes Nagareyama-Ōtaka-no-Mori Soraie—Project overview,” 2026, https://www.31sumai.com/mfr/G2301/outline.html
- Nagareyama City press release, “Nagareyama tops population growth rate for six consecutive years; population exceeds 210,000!,” 2025, https://prtimes.jp/main/html/rd/p/000000004.000135765.html
- LIFULL HOME’S PRESS, “Why relocating households are choosing Nagareyama: six consecutive years at No.1 in population growth rate,” 2025, https://www.homes.co.jp/cont/press/buy/buy_01550/
- nippon.com, “Rosenka top for 41 straight years is Ginza Kyukyodo: Hakuba and Asakusa also surge on inbound tourism,” 2025, https://www.nippon.com/ja/japan-data/h02831/
- Urbalytics internal platform data (`rent_stats` / `building_cap_rate_stats`, Hatsuishi station area and Nagareyama-Ōtaka-no-Mori station area, aggregated as of July 2026), https://www.urbalytics.jp/