Words: 1729 | Estimated Reading Time: 9 minutes | Views: 18064
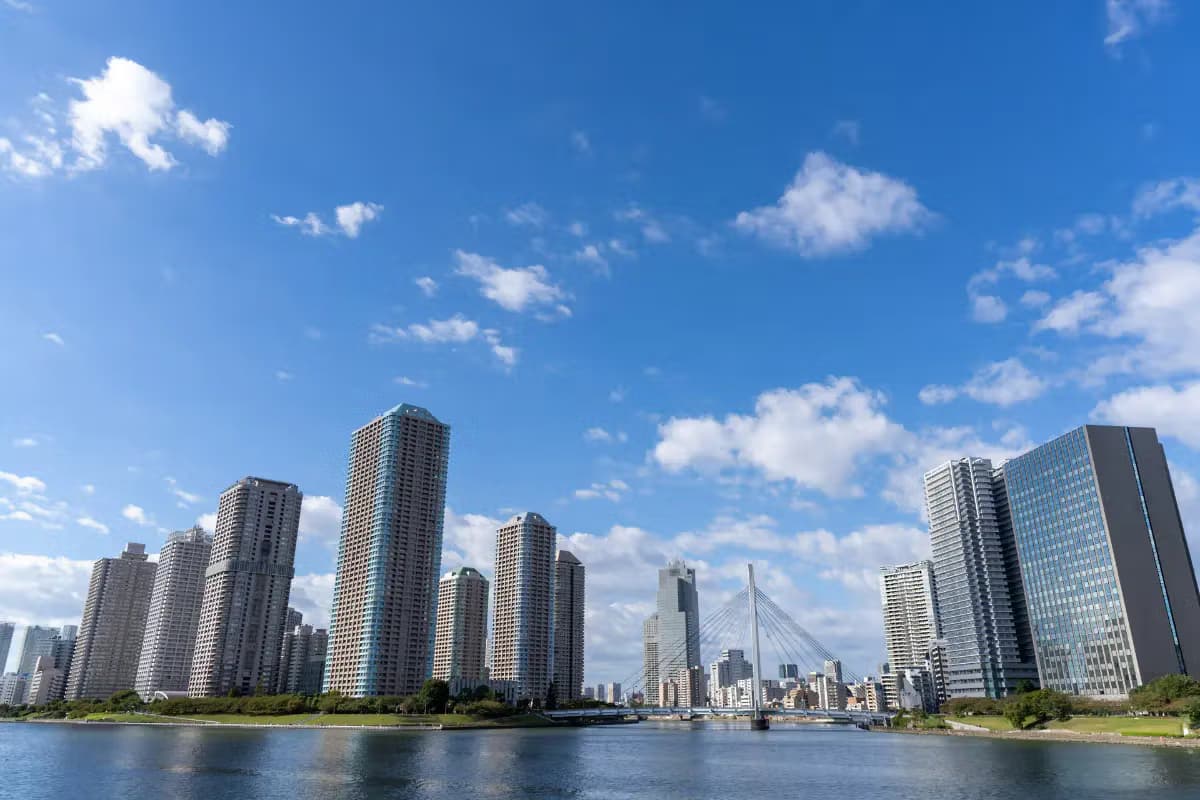
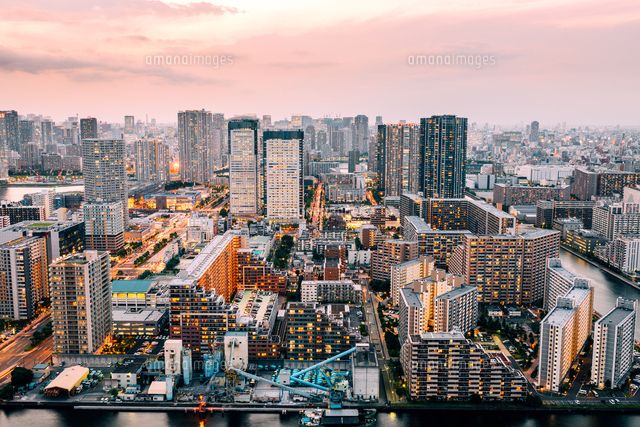
As one of the most closely watched areas among Tokyo’s 23 wards in recent years, Koto Ward (Koto-ku) has attracted significant interest from owner-occupiers and investors due to its coastal location, large-scale redevelopment projects and abundant housing supply. However, entering 2025, with the Bank of Japan’s ongoing rate moves and a market reassessment of supply-demand dynamics in the bayside area, Koto’s land price trajectory is displaying a more complex and multifaceted profile.
Overview of Koto Ward
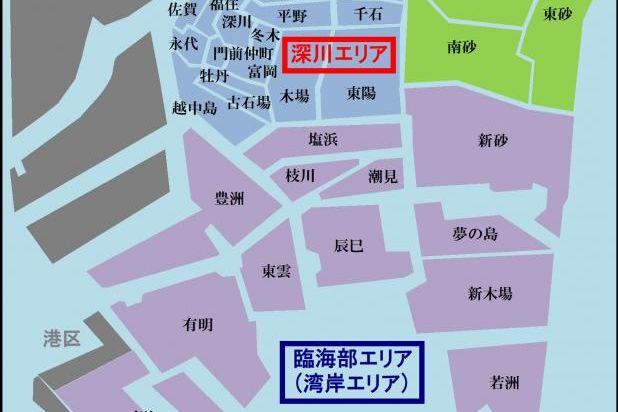
Koto Ward is located on the eastern coastal edge of Tokyo’s 23 wards, bordered to the north by Sumida Ward, adjoining central Chuo Ward (home to Ginza) to the northwest, and connected in the south through bayside areas such as Odaiba to core wards including Minato, Shinagawa and Ota.
Transport-wise, Koto has a dense rail and subway network. The JR Sobu Line runs through the northern part; to the south, the Toei Shinjuku Line, Tozai Line and JR Keiyo Line traverse the ward; the Hanzomon and Oedo Lines extend from west to north; and the Tobu Kameido Line also operates within the ward. In the bayside district, the Tokyo Rinkai (Rinkai Line) and Yurikamome form the core rail network connecting hotspots such as Odaiba, Ariake and Toyosu. Road access includes National Route 14 running east–west between Tokyo and Chiba, multiple metropolitan routes forming the north–south arterial grid, and National Route 357 linking the coastal bayside zone.
As of Reiwa 7 (March 2025), Koto Ward’s population is approximately 541,000, a modest year-on-year increase of about 0.5%, indicating continued attractiveness. With steady population growth, ongoing bayside redevelopment and improved transport and lifestyle convenience, Koto has gradually evolved into a mixed urban area combining residential functions, commercial vitality and waterfront amenity. Below we analyze recent land price movements in Koto by examining official land price publications, prefectural benchmark land prices and Ministry of Land, Infrastructure, Transport and Tourism transaction data, to interpret value shifts and future potential.
2025 Residential Land Prices: A Two-Tier Structure Between Bayside and Downtown
According to the 2025 official land-price publications, residential land in Koto Ward has continued to rise overall, with average published prices up 8.7% year-on-year—outperforming 2024 (+5.6%) but slightly above the Tokyo-23-ward average (+7.9%), placing Koto in a moderate uptrend. However, the price structure is highly polarized, exhibiting a clear two-track phenomenon between bayside and traditional residential neighborhoods.
The highest residential land values are in the Rinkai subcenter area for condominium development. For example, the published site “Koto-20” near the Rinkai Line reached an eye-catching ¥1,000,000/m², the only residential plot in the ward surpassing ¥900,000/m², underscoring Toyosu’s continued status as a high-end residential benchmark. Note that such published sites are typically benchmarked on sites of 1,000 m² or larger and are primarily relevant for developers or formal property valuations, limiting their direct reference value for typical homebuyers.
In traditional residential neighborhoods such as T?y?machi and Kiyosumi-Shirakawa, land prices have also risen steadily. For example, “Koto-9” (near Kiyosumi-Shirakawa Station) was published at ¥749,000/m² in 2025, demonstrating resilience in areas with convenient central-city commutes. The lowest prices are found in the eastern part of the ward where transport access is weaker—for instance, a site 1.5 km from Minamisunamachi Station (“Koto-9”) is published at ¥414,000/m²—reflecting the strong sensitivity of prices to transport convenience.
From transaction data, western bayside neighborhoods such as Toyosu and Ariake show multiple deals with unit prices exceeding ¥1,000,000/m², often involving purchases of small land parcels to compress total outlay. In contrast, in eastern Koto areas such as Kitasuna and Higashisuna, prices are reported around JPY 40,500,000/m². Actual transaction prices are typically higher than published land prices—on average roughly 11.5 times the published rates—and in some scarce locations can reach 1.5–2 times the inheritance tax road value; this is particularly notable in areas like Kiyosumi-Shirakawa and Morishita, where living amenities, cultural character and investment value coalesce.
In summary, Koto Ward’s land-price structure is characterized by a pattern of bayside-driven peak values with traditional residential districts forming a stable mid-price band. Investors assessing individual assets should pay particular attention to their position along the ward’s “location axis” and to nearby transaction comparables to avoid misjudging upside potential or downside risk.
2025 Commercial Land Prices: Bayside in the Spotlight, Monzen-Nakacho Leading Stably
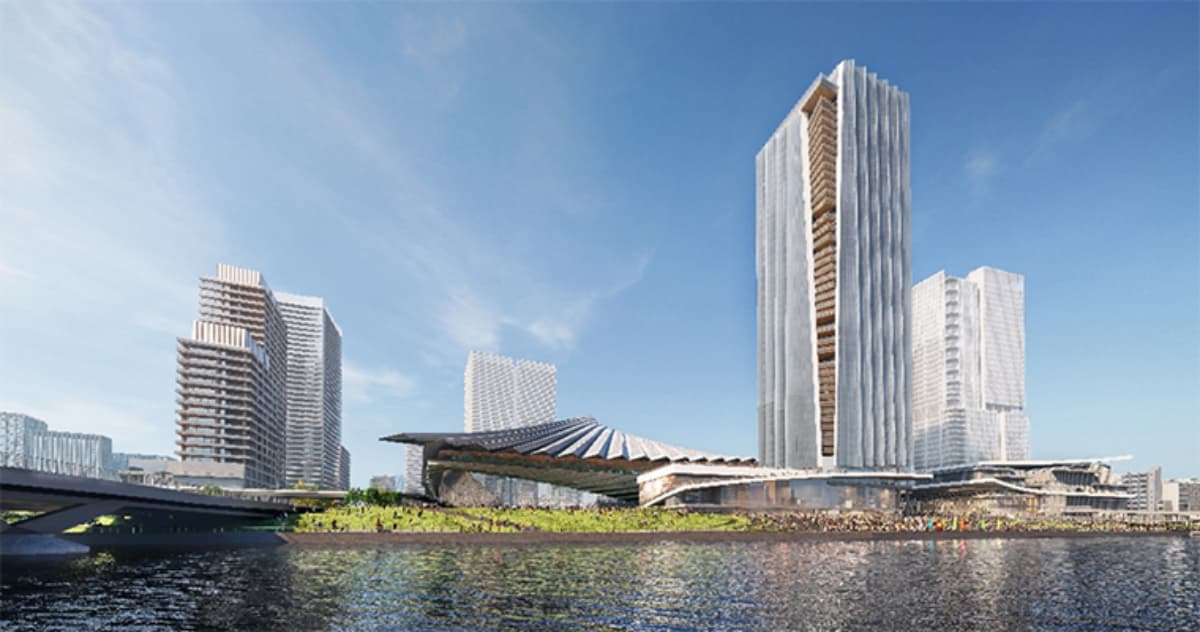
Based on the January 2025 published land data, the most expensive commercial land in Koto Ward is near Toyosu Station at the intersection of the Yurakucho Line and the Yurikamome—the published site “Koto 5-17”—with a land price as high as ¥2,560,000/m², the highest in the ward. This confirms that bayside development centered on tower apartments and mixed urban complexes (e.g., Toyosu and Ariake) has gradually overtaken traditional older neighborhoods (such as Kameido and Toyomachi) as the price core of Koto Ward.
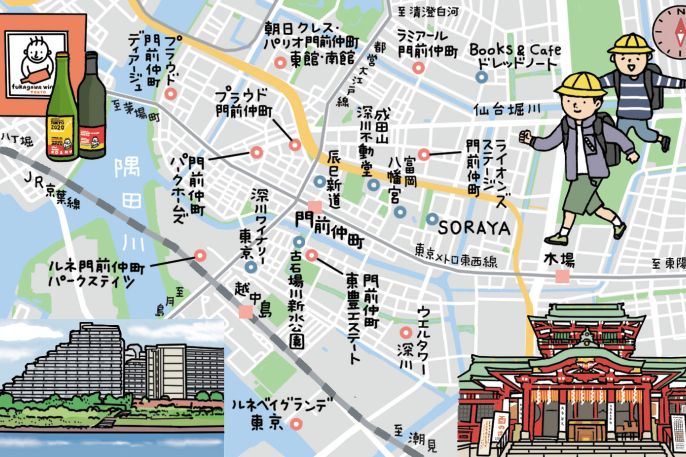
Another high-price reference point is “Koto 5-5” near Monzen-Nakacho Station, which was ¥2,450,000/m² in 2024 and is expected to rise further in 2025. Across the ward, eight commercial published sites exceed ¥1,000,000/m², concentrated within roughly 500 meters of Toyosu, Kameido, Monzen-Nakacho, Kiyosumi-Shirakawa and Sumiyoshi stations—Toyosu accounts for two such sites, and Monzen-Nakacho and Kameido each have two—highlighting the intensity of the bayside heat.
It should be noted that actual transaction prices are often higher than these published figures. Based on experience, commercial market prices in Koto can reach 1.5–2 times the published price, especially in popular areas such as Toyosu and Monzen-Nakacho. For example, Ministry of Land, Infrastructure, Transport and Tourism transaction records since 2022 show 13 commercial transactions above ¥1,000,000/m², with the highest reaching ¥4,300,000/m², mainly within a six-minute walk of Monzen-Nakacho Station—demonstrating the advantages of core locations.
Conversely, lower-priced commercial transactions tend to be in areas with relatively poor transport access—such as Minamisunamachi, Nishi-Ojima and Higashi-Ojima—with only three transactions below ¥500,000/m², indicating that transport convenience remains the primary determinant of commercial land value. Regarding Toyosu, although it ranks highest in land prices, there are currently no public records of pure commercial land transactions, likely because most deals involve integrated land-and-building developments or because transaction information is less transparent.
Overall, Koto Ward’s commercial land price structure exhibits a clear core–bayside bipolarization:
Emerging bayside commercial districts (Toyosu, Ariake): Prices capped at the top end; supply is scarce and transaction frequency can be limited—suitable for long-term capital allocations.
Traditional core commercial districts (Monzen-Nakacho, Kameido, Kiyosumi-Shirakawa): Stable foot traffic and solid rent potential—suitable for conservative investments.
Peripheral areas (Minamisunamachi, Higashisuna, Higashi-Ojima): Lower prices but poorer liquidity—require careful assessment of local planning and future potential.
For investors looking to allocate to commercial assets in Koto Ward, the axiom "choose location over price" remains fundamental—especially in a rising-rate, higher-cost operating environment where core locations matter more than short-term headline yields.
Trends in Real Estate Investment Yields
Alongside land-price movements in Koto Ward, yield trends (利回り) are also important for readers considering real estate investment. Yield not only directly reflects property profitability but is a core metric determining whether an investment is economically viable.
What is yield?
In short, yield refers to the rate at which an investor recoups capital and earns profit from rental income after purchasing an income-producing property. Yields can be divided into two types:
Gross yield: Annual rent ÷ purchase price, before deducting operating costs such as management fees, maintenance and taxes.
Net yield (Net Yield / Capitalization Yield): After deducting operating costs, this is the more accurate measure of investment return and is widely used in property valuation.
Koto Ward Investment Yield Profile (2025)
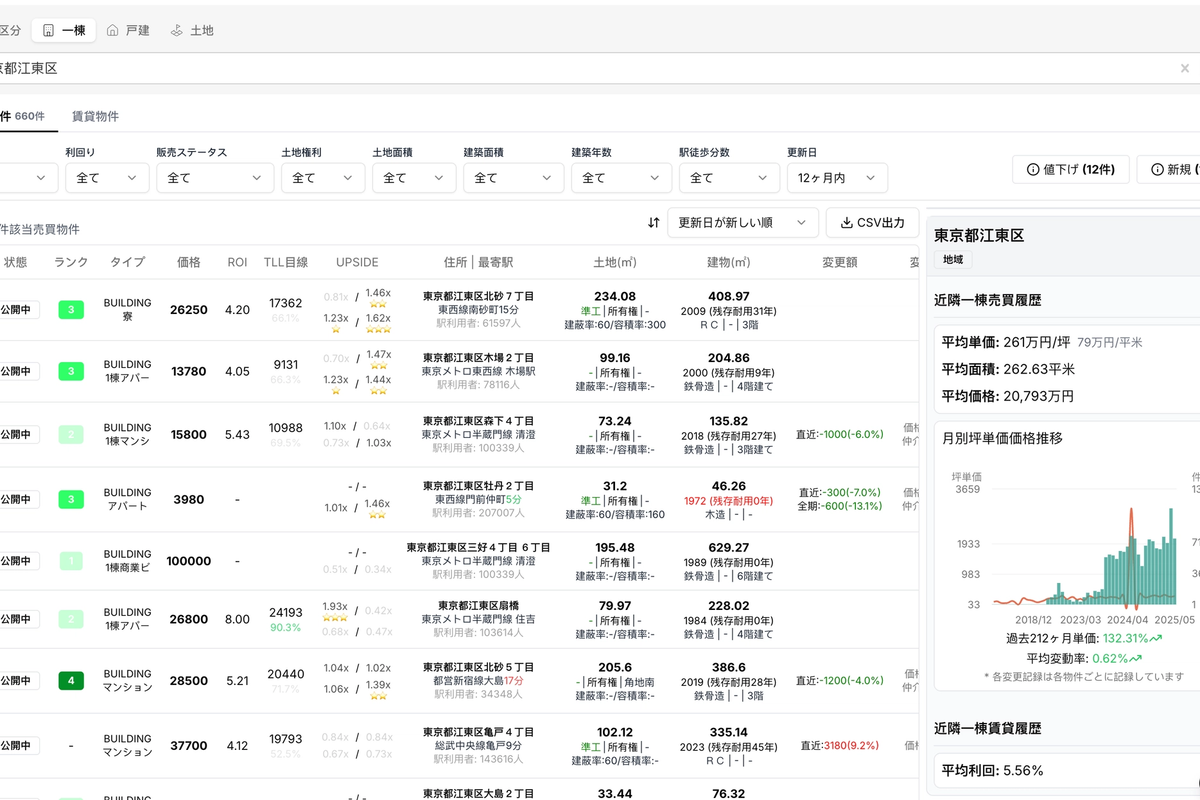
Using Urbalytics’ property search, income properties in Koto Ward have nearly doubled in price over the past ten years; current average yields stand in the 5–6% range. Recent transaction records show smaller properties (around JPY 10 million) yielding roughly 6–7%, while larger assets above JPY 100 million more commonly yield 4.5–6%. These larger, higher-priced assets are typically held by institutional investors or professional buyers, and transaction volume is relatively limited.
Condominium unit yields are generally lower due to higher liquidity
Tower apartments in bayside areas (Toyosu, Ariake): 2.5%–4%
Core neighborhoods (Kiyosumi-Shirakawa, Monzen-Nakacho): 3.5%–5.5%
Older neighborhoods and vintage apartments (Higashisuna, Kitasuna): 4%–6%
Because of lower entry thresholds and higher liquidity, condominium units are the primary choice for retail investors. In a diverse ward like Koto, yields are structurally segmented: bayside areas offer lower gross yields but more stable demand, while older inland neighborhoods present higher yields but also higher maintenance and vacancy risks.
Investor Perspective: Which Areas Still Merit Attention?
Despite a general slowdown in the pace of increases, several mid- to long-term investment opportunities remain in Koto Ward.
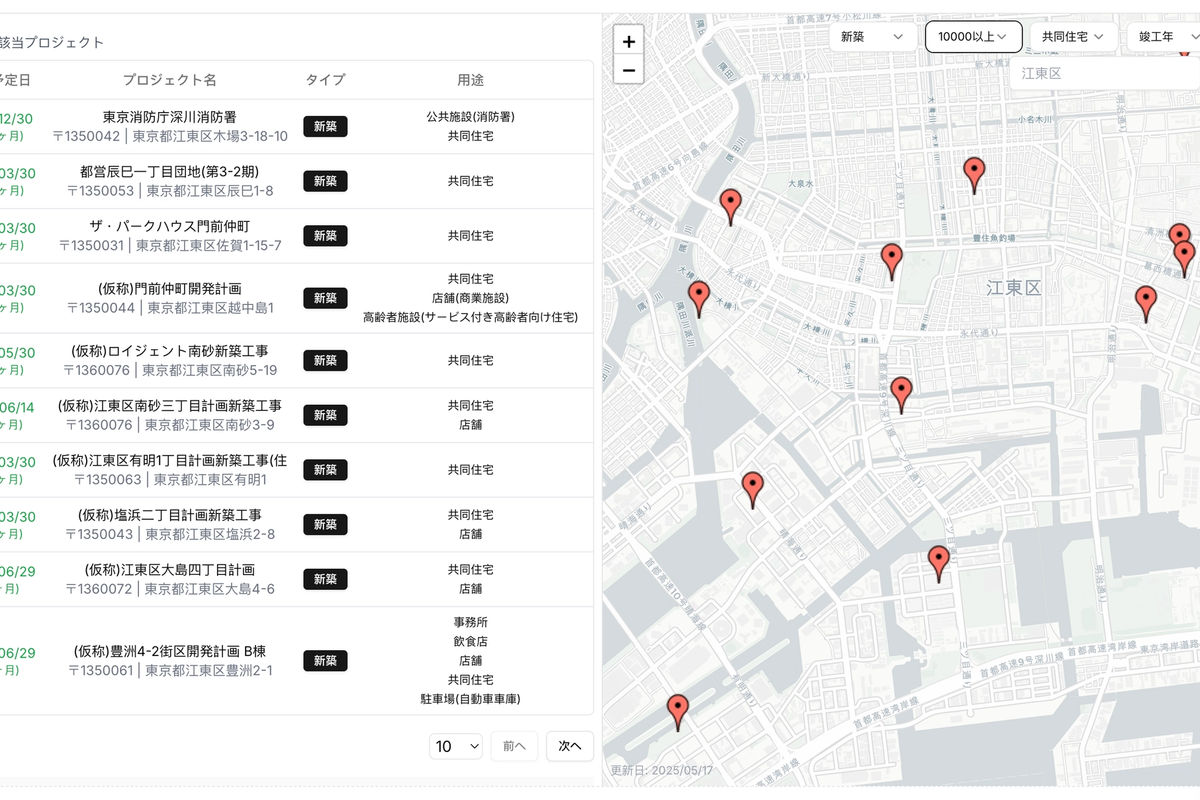
Urbalytics’ development plan map shows that large-scale projects (buildings over 10,000 m²) after 2025 are mainly concentrated around Kiba and the Minami-Suna area. In particular, the Sunamachi redevelopment corridor, while currently less accessible, will see multiple mixed-use projects delivered between 2026 and 2028. Early positioning could capture mid-term capital appreciation. Notably, between the SoftBank Aeon Minamisuna and SUNAMO, nearly six projects are scheduled for completion before 2028 with a combined floor area exceeding 100,000 m²—this is a development trend worth monitoring.
Conclusion: A Rational Investment Window within Structural Divergence
As a key part of Tokyo’s bayside ecosystem, Koto Ward benefits from extensive transport links, steady population growth and ongoing redevelopment—factors that helped land prices maintain a sound upward trend in 2025. Nevertheless, the data reveals a clear internal bifurcation—bayside premium versus value in traditional districts—with Toyosu and Ariake leading price growth but offering lower yields, while inland areas such as Toyomachi and Kitasuna show higher yields and potential value pockets.
Against the backdrop of Bank of Japan rate hikes and rising investment costs, both the residential and commercial markets in Koto Ward have entered a phase that emphasizes fundamentals and structural assessment. For investors, this is not merely a cooling-off period for speculative premium—it is a window to identify high-quality assets using data-driven, disciplined selection.
Whether the priority is stable cash flow from condominium units or early exposure to redevelopment-driven mid-sized land plots, success depends on a deep understanding of each neighborhood’s functional structure and supply-demand alignment. Leveraging data platforms such as Urbalytics to integrate land prices, yields, transaction frequency and demographic variables is essential to navigate cycles and achieve long-term compound returns.
Sources
https://diamond-fudosan.jp/ud/realestate_price_land/url/%E6%9D%B1%E4%BA%AC%E9%83%BD%E6%B1%9F%E6%9D%B1%E5%8C%BA Land price trends and market levels for Tokyo’s Koto Ward
https://www.reinfolib.mlit.go.jp/ Ministry of Land, Infrastructure, Transport and Tourism Real Estate Information Library
https://www.urbalytics.jp/it/kensetsu Urbalytics development plans