

神奈川県足柄下郡真鶴町 houses market report
Record counts, unit-price trends and a comparison against the 神奈川県 average, aggregated monthly by Urbalytics for houses listed in 神奈川県足柄下郡真鶴町. Latest month: August 2026.
ManazuruPeninsula view from Mitsuishi·Quercus acuta/CC BY-SA 4.0 (cropped)·Wikimedia Commons
神奈川県足柄下郡真鶴町 houses|overview
#Counts are houses listings in 神奈川県足柄下郡真鶴町 for which a price could be obtained (on the market and closed). The commentary is derived mechanically from the figures on this page.
What the data says
- From November 2025 to March 2026, Expected yield for houses in 神奈川県足柄下郡真鶴町 went from 8.14% to 12.00% — up (+386bps).
- From November 2025 to May 2026, Price per tsubo of floor area for houses in 神奈川県足柄下郡真鶴町 went from 46.3M JPY/tsubo to 36.4M JPY/tsubo — down (−21.4%).
asking price and area for houses
#House — Asking price and Price per tsubo of floor area over time
Asking price = the median of prices published to the market. Read as a series, the level of the total shows where the market is moving.
Price per tsubo of floor area = asking price ÷ floor area. What the property is asking per unit of space (1 tsubo ≈ 3.31㎡).
Asking price
Unit: M JPYPrice per tsubo of floor area
Unit: M JPY/tsubo| Month | Asking price — 真鶴町 | Asking price — 神奈川県 | Difference (Asking price) | Price per tsubo of floor area — 真鶴町 | Price per tsubo of floor area — 神奈川県 | Records |
|---|---|---|---|---|---|---|
| 2026年8月 | — | 4,380 | — | — | 146.1 | 9 |
| 2026年7月 | — | 4,380 | — | — | 146.1 | 4 |
| 2026年6月 | — | 4,380 | — | — | 146.4 | 8 |
| 2026年5月 | 1,140 | 4,280 | −73.4% | 36.4 | 143.5 | 12 |
| 2026年4月 | — | 4,180 | — | — | 140.5 | 5 |
| 2026年3月 | 1,480 | 4,180 | −64.6% | 30.7 | 140.2 | 10 |
| 2026年2月 | — | 4,194 | — | — | 142.8 | 6 |
| 2026年1月 | 1,365 | 4,280 | −68.1% | 47.6 | 144.1 | 12 |
| 2025年12月 | 1,430 | 4,280 | −66.6% | 48.9 | 144.1 | 12 |
| 2025年11月 | 2,890 | 4,225 | −31.6% | 46.3 | 142.5 | 10 |
| 2025年10月 | — | 4,280 | — | — | 146.4 | 6 |
| 2025年9月 | — | 4,288 | — | — | 145.8 | 5 |
| 2025年8月 | — | 4,280 | — | — | 143.8 | 5 |
| 2025年7月 | — | 4,180 | — | — | 141.8 | 3 |
| 2025年6月 | — | 4,180 | — | — | 140.5 | 6 |
| 2025年5月 | — | 4,180 | — | — | 141.2 | 3 |
| 2025年3月 | — | 4,200 | — | — | 141.2 | 9 |
| 2025年1月 | — | 4,200 | — | — | 139.8 | 1 |
| 2024年12月 | — | 3,980 | — | — | 129.9 | 2 |
| 2024年11月 | — | 3,900 | — | — | 128.6 | 1 |
| 2024年6月 | — | 4,000 | — | — | 133.6 | 1 |
| 2024年4月 | — | 4,200 | — | — | 137.9 | 1 |
| 2023年2月 | — | 3,800 | — | — | 125.0 | 2 |
Source: monthly aggregates of listing and rental-offer data collected by Urbalytics
Conditions
- Source: listings Urbalytics collects (on the market and closed)
- Publication threshold: figures shown only for months with 10 or more records
- Statistic: median (P20–P80 is the 20th to 80th percentile). Outliers removed by the IQR method
- In a thin month (10–30 records) both the median and the P20–P80 band move on a single listing. Read them alongside the record count shown next to each figure.
- Period: from 12 2022 — the window over which each property type is aggregated independently
What the data says
- From November 2025 to May 2026, Price per tsubo of floor area for houses in 神奈川県足柄下郡真鶴町 went from 46.3M JPY/tsubo to 36.4M JPY/tsubo — down (−21.4%).
- From November 2025 to May 2026, Asking price for houses in 神奈川県足柄下郡真鶴町 went from 2,890M JPY to 1,140M JPY — down (−60.6%).
House — Floor area and Land area over time
Floor area = the median Floor area among listed properties. At the same Price per tsubo of floor area, more space still means a higher total — which is why this is read alongside the price series. (1 tsubo ≈ 3.31㎡)
Land area = the median land area among listed properties. It is the denominator under the per-tsubo buildable price, and Within one area, a change in plot size moves the total. (1 tsubo ≈ 3.31㎡)
Floor area
Unit: tsuboLand area
Unit: tsubo| Month | Floor area — 真鶴町 | Floor area — 神奈川県 | Difference (Floor area) | Land area — 真鶴町 | Land area — 神奈川県 | Records |
|---|---|---|---|---|---|---|
| 2026年8月 | — | 29.9 | — | — | 36.0 | 9 |
| 2026年7月 | — | 29.9 | — | — | 36.0 | 4 |
| 2026年6月 | — | 29.9 | — | — | 35.8 | 8 |
| 2026年5月 | 38.1 | 29.9 | +27.2% | 46.9 | 35.4 | 12 |
| 2026年4月 | — | 29.8 | — | — | 35.4 | 5 |
| 2026年3月 | 32.6 | 29.7 | +10.0% | 71.2 | 34.9 | 10 |
| 2026年2月 | — | 29.7 | — | — | 34.6 | 6 |
| 2026年1月 | 31.2 | 29.7 | +5.2% | 56.9 | 34.7 | 12 |
| 2025年12月 | 32.8 | 29.6 | +10.7% | 47.0 | 34.4 | 12 |
| 2025年11月 | 31.3 | 29.7 | +5.5% | 49.9 | 34.2 | 10 |
| 2025年10月 | — | 29.6 | — | — | 34.5 | 6 |
| 2025年9月 | — | 29.6 | — | — | 34.1 | 5 |
| 2025年8月 | — | 29.6 | — | — | 33.8 | 5 |
| 2025年7月 | — | 29.6 | — | — | 33.9 | 3 |
| 2025年6月 | — | 29.6 | — | — | 34.2 | 6 |
| 2025年5月 | — | 29.6 | — | — | 34.1 | 3 |
| 2025年3月 | — | 29.8 | — | — | 34.5 | 9 |
| 2025年1月 | — | 29.9 | — | — | 35.0 | 1 |
| 2024年12月 | — | 30.1 | — | — | 35.6 | 2 |
| 2024年11月 | — | 29.6 | — | — | 34.8 | 1 |
| 2024年6月 | — | 30.1 | — | — | 37.8 | 1 |
| 2024年4月 | — | 29.9 | — | — | 36.6 | 1 |
| 2023年2月 | — | 29.6 | — | — | 36.3 | 2 |
Source: monthly aggregates of listing and rental-offer data collected by Urbalytics
Conditions
- Source: listings Urbalytics collects (on the market and closed)
- Area: building area is gross floor area (exclusive area for condominium units); land area is the registered figure
- Publication threshold: figures shown only for months with 10 or more records
- Statistic: median (P20–P80 is the 20th to 80th percentile)
- Unit: tsubo (1 tsubo ≈ 3.31㎡), matched to the unit the per-tsubo price multiplies against
houses: listings over time
#House — Listings over time
Listings = the count published to the market. Stock building up or drawing down is a leading indicator of supply and demand, and it is what makes price and yield movements readable. The chart is an index with the base month at 100, so areas of different size can be compared on the pace of the change rather than its size. The raw counts are in the cards and the table below.
| Month | 真鶴町() | 真鶴町 (index) | 神奈川県 () | 神奈川県 (index) | Gap (pt) |
|---|---|---|---|---|---|
| 2026年8月 | 9 | 450.0 | 4,779 | 1,168.5 | −718.5pt |
| 2026年7月 | 4 | 200.0 | 4,939 | 1,207.6 | −1007.6pt |
| 2026年6月 | 8 | 400.0 | 6,299 | 1,540.1 | −1140.1pt |
| 2026年5月 | 12 | 600.0 | 4,881 | 1,193.4 | −593.4pt |
| 2026年4月 | 5 | 250.0 | 5,370 | 1,313.0 | −1063.0pt |
| 2026年3月 | 10 | 500.0 | 5,677 | 1,388.0 | −888.0pt |
| 2026年2月 | 6 | 300.0 | 6,383 | 1,560.6 | −1260.6pt |
| 2026年1月 | 12 | 600.0 | 7,673 | 1,876.0 | −1276.0pt |
| 2025年12月 | 12 | 600.0 | 7,597 | 1,857.5 | −1257.5pt |
| 2025年11月 | 10 | 500.0 | 7,097 | 1,735.2 | −1235.2pt |
| 2025年10月 | 6 | 300.0 | 7,355 | 1,798.3 | −1498.3pt |
| 2025年9月 | 5 | 250.0 | 7,244 | 1,771.1 | −1521.1pt |
| 2025年8月 | 5 | 250.0 | 7,280 | 1,780.0 | −1530.0pt |
| 2025年7月 | 3 | 150.0 | 6,440 | 1,574.6 | −1424.6pt |
| 2025年6月 | 6 | 300.0 | 6,787 | 1,659.4 | −1359.4pt |
| 2025年5月 | 3 | 150.0 | 6,523 | 1,594.9 | −1444.9pt |
| 2025年3月 | 9 | 450.0 | 7,365 | 1,800.7 | −1350.7pt |
| 2025年1月 | 1 | 50.0 | 1,005 | 245.7 | −195.7pt |
| 2024年12月 | 2 | 100.0 | 448 | 109.5 | −9.5pt |
| 2024年11月 | 1 | 50.0 | 512 | 125.2 | −75.2pt |
| 2024年6月 | 1 | 50.0 | 694 | 169.7 | −119.7pt |
| 2024年4月 | 1 | 50.0 | 599 | 146.5 | −96.5pt |
| 2023年2月 | 2 | 100.0 | 409 | 100.0 | ±0.0pt |
Source: monthly aggregates of listing and rental-offer data collected by Urbalytics
Conditions
- Source: listings Urbalytics collects (on the market and closed)
- Publication threshold: figures shown only for months with 10 or more records
- Statistic: median (P20–P80 is the 20th to 80th percentile). Outliers removed by the IQR method
- In a thin month (10–30 records) both the median and the P20–P80 band move on a single listing. Read them alongside the record count shown next to each figure.
- Period: from 12 2022 — the window over which each property type is aggregated independently
What the data says
- From February 2023 to August 2026, listings for houses in 神奈川県足柄下郡真鶴町 went from 2 to 9 — up (+350.0%).
- From February 2023 to August 2026, listings for houses across 神奈川県 moved +1068.5%, and 神奈川県足柄下郡真鶴町 ran 718.5 points slower.
- In August 2026, 神奈川県足柄下郡真鶴町 had 9 listings for houses, against 5 a year earlier (+80.0%).
Figures on this page are derived statistics: monthly aggregates of listing and rental-offer data collected by Urbalytics. They are not individual transaction records.
Main stations in 神奈川県足柄下郡真鶴町
Stations within 神奈川県足柄下郡真鶴町, ordered by record count. The station reports publish the same measures gathered by walking distance from the nearest station.

Station photographs from Wikimedia Commons (author and licence are given on each station’s own report page).
The same report for nearby areas
Areas around 神奈川県足柄下郡真鶴町 that publish the same aggregation. Distance is between municipality centroids.
- 足柄下郡湯河原町3.1km23August 2026
- 足柄下郡箱根町11km12August 2026
- 小田原市14km75August 2026
- 南足柄市18km23August 2026
- 足柄上郡大井町19km10April 2026
- 足柄上郡開成町19km13January 2026
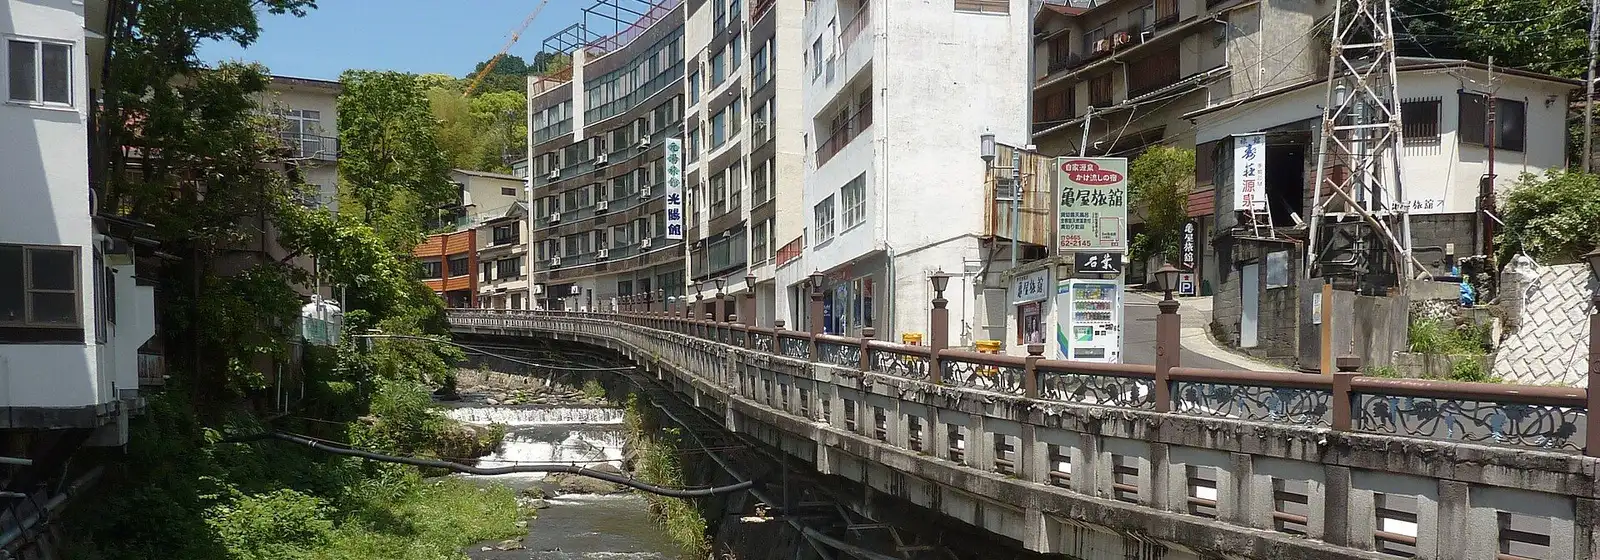




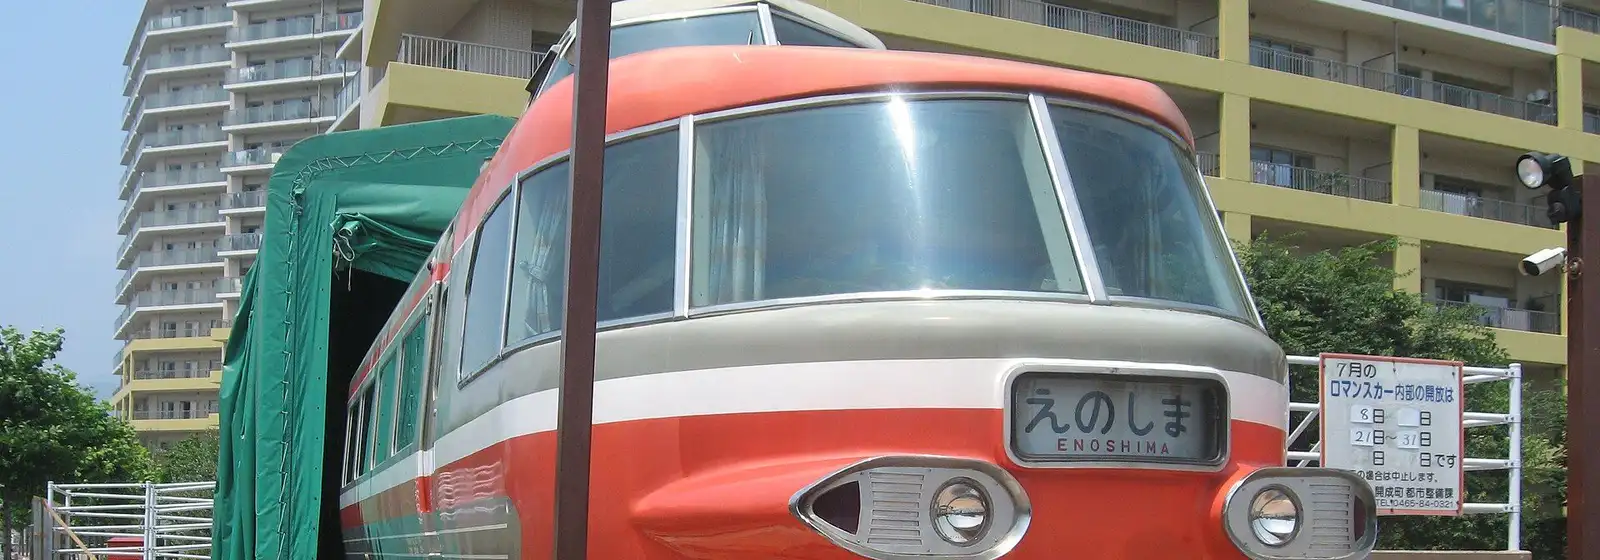
Area photographs from Wikimedia Commons (author and licence for each are given on that area’s own report page).
Find houses in 神奈川県足柄下郡真鶴町
Individual listings, price-change history, closed transactions and AI valuations are available on a free account.