
Katori, Chiba real estate market report
Monthly figures for property listed in Katori, Chiba, by property type. Latest month: September 2026.
Reports by property type
#The 2 types clearing the publication threshold in Katori, Chiba.
Listing records
#As of September 2026.Listings for which a price was available, by property type (on the market and closed alike).
Frequently asked questions
#Price levels by property type in Katori, Chiba, from the same aggregates as each type report.
- What are prices doing for houses in Katori, Chiba?
- As of September 2026, Gross yield for houses in Katori, Chiba is 19.09% — 601bps above the Chiba average of 13.07% (20 records). As of September 2026, Price per tsubo of floor area for houses in Katori, Chiba is ¥162k/tsubo — 84.5% below the Chiba average of ¥1.05M/tsubo (20 records).
- What are prices doing for land in Katori, Chiba?
- As of September 2026, Price per buildable tsubo for land in Katori, Chiba is ¥7k/tsubo — 97.4% below the Chiba average of ¥255k/tsubo (13 records).
Figures on this page are derived statistics: monthly aggregates of listing and rental-offer data collected by Urbalytics. They are not individual transaction records.
Areas near Katori, Chiba
Municipalities nearest to Katori, Chiba first. Distance is measured between municipality centres.
- 成田市18km46September 2026
- 匝瑳市19km14June 2026
- 旭市19km11September 2026
- 山武郡芝山町20km—
- 山武郡横芝光町23km10September 2026
- 富里市24km25September 2026
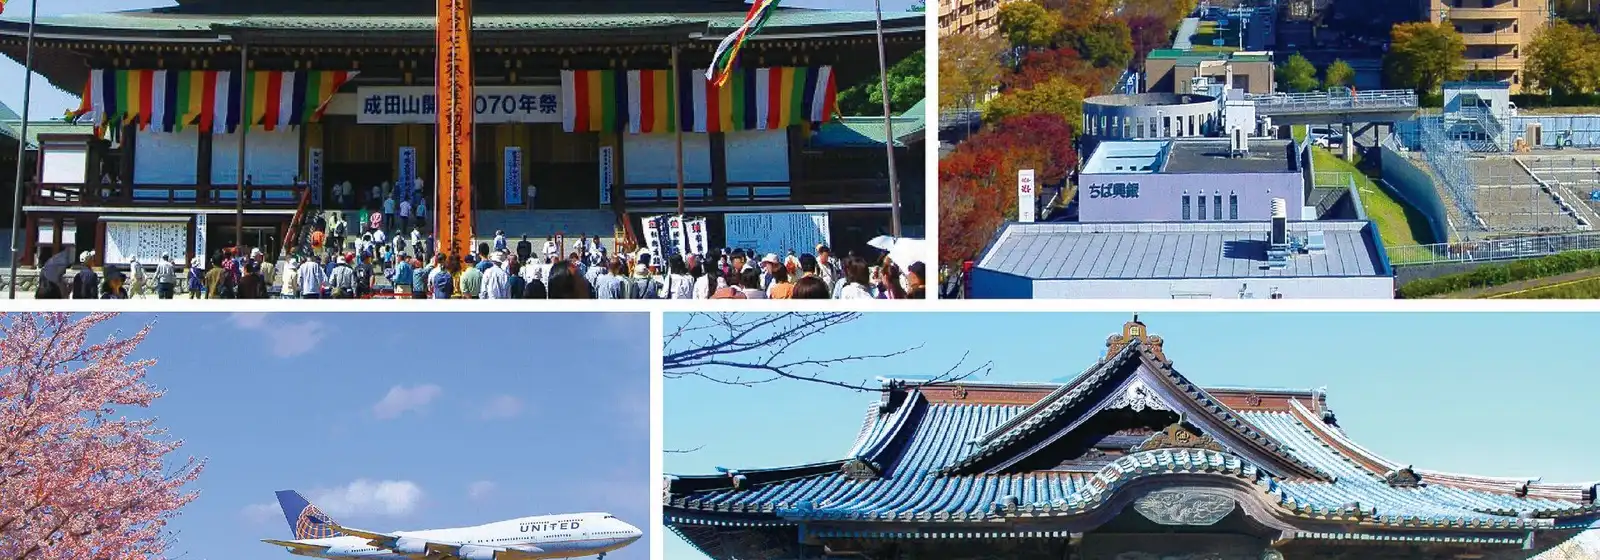
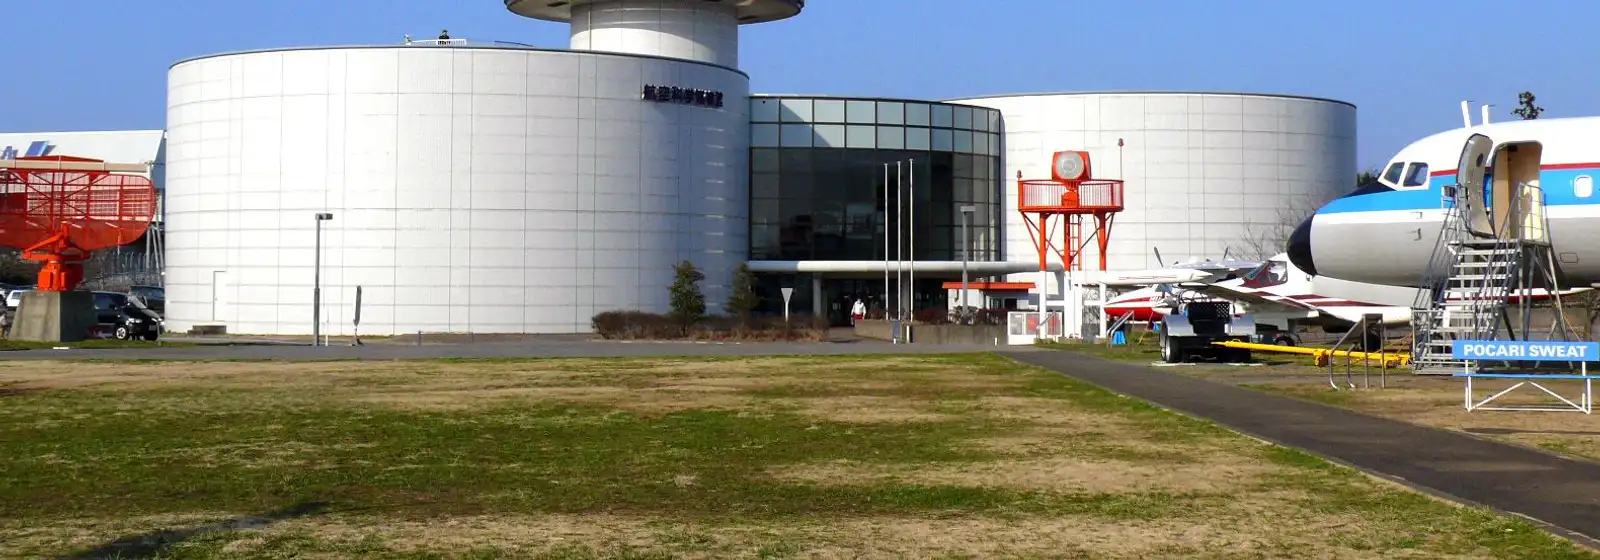
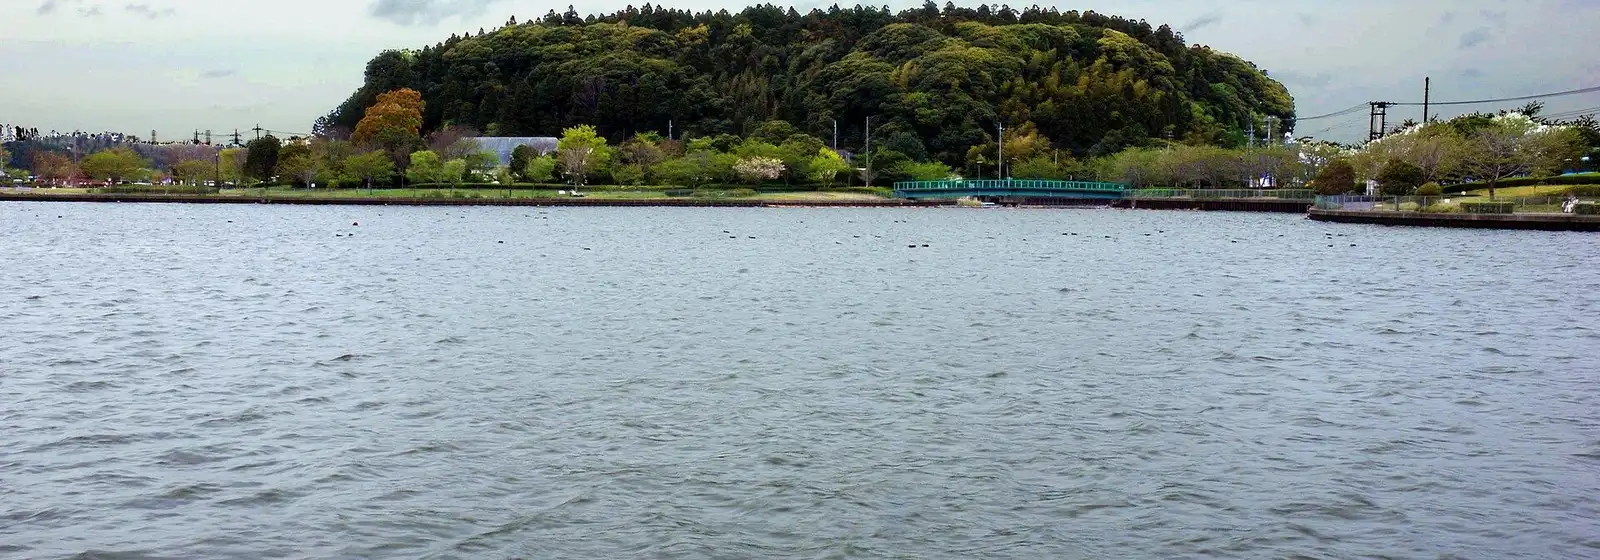
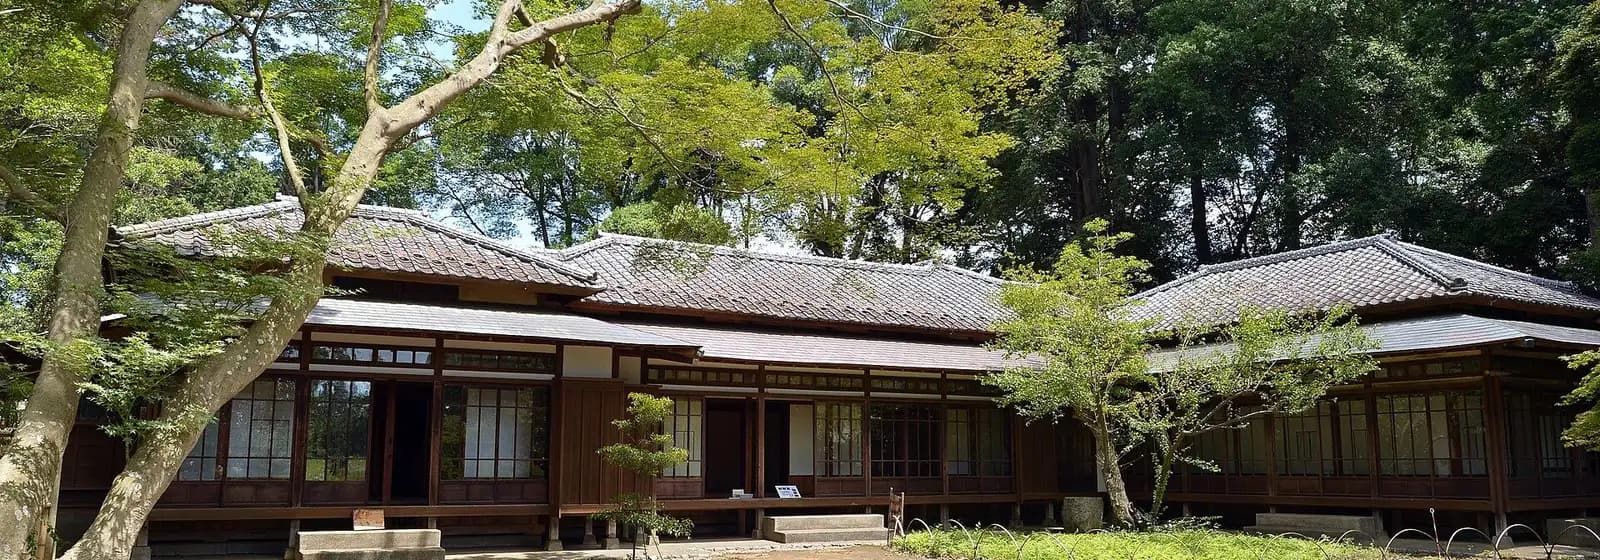
Area photographs from Wikimedia Commons (author and licence for each are given on that area’s own report page).
Prices by postal code in Katori, Chiba
Postal codes in Katori, Chiba, most data first. Counts are sale and rental records across the period.
Find properties in Katori, Chiba
Individual listings, price-change history, closed transactions and AI valuations are available on a free account.