

江戸川区南小岩: Market Data
Monthly asking prices and rents for 東京都江戸川区南小岩, by property type. A postal code covers roughly one or two chōme, so in months with fewer than 10 records the median is withheld and only the count is shown. The most recent month is August 2026.
〒133-0056
江戸川区花火大会・市川市民納涼花火大会2·Shun Shirai/CC BY-SA 4.0 (cropped)·Wikimedia Commons
Asking prices in 江戸川区南小岩 (latest month)
#For each property type, the record count and median price in the latest month with data. Medians are not shown for months with fewer than 10 records.
| Property type | Month | Records(records) | Median price(M JPY) | P20–P80 | Median unit price |
|---|---|---|---|---|---|
| Income building | 2026-08 | 6 | — | — | — |
| Condominium | 2026-08 | 15 | 11,380 | 8,980–12,900 | 156.5 M JPY/㎡ |
| House | 2026-08 | 15 | 5,680 | 2,990–8,180 | 215.5 M JPY/tsubo |
| Land | 2026-08 | 4 | — | — | — |
“—” marks a value withheld because the month has fewer than 10 records. Counts are shown at any size.
Asking price trend in 江戸川区南小岩
#The total says what it costs to buy the property; the unit price says whether that is dear or cheap. Neither answers the other’s question, and floor area is the variable that separates them.
Income building — Asking price and Price per tsubo of floor area over time
Asking price = the median of prices published to the market. Read as a series, the level of the total shows where the market is moving.
Price per tsubo of floor area = asking price ÷ floor area. What the property is asking per unit of space (1 tsubo ≈ 3.31㎡).
Asking price
Unit: M JPYPrice per tsubo of floor area
Unit: M JPY/tsubo| Month | Asking price — 江戸川区南小岩 | Asking price — 東京都 | Difference (Asking price) | Price per tsubo of floor area — 江戸川区南小岩 | Price per tsubo of floor area — 東京都 | Records |
|---|---|---|---|---|---|---|
| 2026年8月 | — | 16,575 | — | — | 254.2 | 6 |
| 2026年7月 | 15,500 | 16,440 | −5.7% | 146.1 | 257.9 | 13 |
| 2026年6月 | 3,450 | 16,500 | −79.1% | 171.2 | 253.9 | 12 |
| 2026年5月 | — | 16,480 | — | — | 247.6 | 9 |
Source: monthly aggregates of listing and rental-offer data collected by Urbalytics
Condominium — Asking price and Price per ㎡ of floor area over time
Asking price = the median of prices published to the market. Read as a series, the level of the total shows where the market is moving.
Price per ㎡ of floor area = asking price ÷ floor area. What the property is asking per unit of space (1 tsubo ≈ 3.31㎡).
Asking price
Unit: M JPYPrice per ㎡ of floor area
Unit: M JPY/㎡| Month | Asking price — 江戸川区南小岩 | Asking price — 東京都 | Difference (Asking price) | Price per ㎡ of floor area — 江戸川区南小岩 | Price per ㎡ of floor area — 東京都 | Records |
|---|---|---|---|---|---|---|
| 2026年8月 | 11,380 | 5,880 | +93.5% | 156.5 | 114.5 | 15 |
Source: monthly aggregates of listing and rental-offer data collected by Urbalytics
House — Asking price and Price per tsubo of floor area over time
Asking price = the median of prices published to the market. Read as a series, the level of the total shows where the market is moving.
Price per tsubo of floor area = asking price ÷ floor area. What the property is asking per unit of space (1 tsubo ≈ 3.31㎡).
Asking price
Unit: M JPYPrice per tsubo of floor area
Unit: M JPY/tsubo| Month | Asking price — 江戸川区南小岩 | Asking price — 東京都 | Difference (Asking price) | Price per tsubo of floor area — 江戸川区南小岩 | Price per tsubo of floor area — 東京都 | Records |
|---|---|---|---|---|---|---|
| 2026年8月 | 5,680 | 5,499 | +3.3% | 215.5 | 201.0 | 15 |
| 2026年7月 | 6,299 | 5,480 | +14.9% | 219.5 | 198.7 | 17 |
| 2026年6月 | 4,780 | 5,480 | −12.8% | 170.2 | 196.7 | 11 |
| 2026年5月 | — | 5,100 | — | — | 186.8 | 6 |
Source: monthly aggregates of listing and rental-offer data collected by Urbalytics
Land — Asking price and Price per buildable tsubo over time
Asking price = the median of prices published to the market. Read as a series, the level of the total shows where the market is moving.
Price per buildable tsubo = asking price ÷ land area ÷ floor-area ratio. The price per buildable square, which lets you compare land as dear or cheap without the plot size getting in the way (1 tsubo ≈ 3.31㎡).
Asking price
Unit: M JPYPrice per buildable tsubo
Unit: M JPY/tsubo| Month | Asking price — 江戸川区南小岩 | Asking price — 東京都 | Difference (Asking price) | Price per buildable tsubo — 江戸川区南小岩 | Price per buildable tsubo — 東京都 | Records |
|---|---|---|---|---|---|---|
| 2026年8月 | — | 6,200 | — | — | 140.8 | 4 |
| 2026年7月 | — | 5,980 | — | — | 135.2 | 3 |
| 2026年6月 | 5,940 | 5,699 | +4.2% | 98.2 | 126.6 | 14 |
| 2026年5月 | — | 5,185 | — | — | 121.7 | 3 |
Source: monthly aggregates of listing and rental-offer data collected by Urbalytics
Conditions
- Source: listings Urbalytics collects (on the market and closed)
- Publication threshold: figures shown only for months with 10 or more records
- Statistic: median (P20–P80 is the 20th to 80th percentile). Outliers removed by the IQR method
- In a thin month (10–30 records) both the median and the P20–P80 band move on a single listing. Read them alongside the record count shown next to each figure.
- Period: from 5 2026 — the window over which each property type is aggregated independently
Asking rents in 江戸川区南小岩
#Rent (total) = monthly rent + common charges; rent per ㎡ is that divided by area. Unlike an asking price, rent is what is actually being paid, so it works as the numerator of a yield. Area is the variable that separates the total from the unit figure.
Sign up free to see all the data
Detailed distributions and trends are available on a free account.
Figures on this page are derived statistics: monthly aggregates of listing and rental-offer data collected by Urbalytics. They are not individual transaction records.
Postal codes near 江戸川区南小岩
Postal codes with data, by straight-line distance from 江戸川区南小岩. Counts are sale and rental records across the period.
- 江戸川区東松本0.3km〒133-007151
- 江戸川区鹿骨町0.4km〒133-00729
- 江戸川区興宮町0.7km〒133-004234
- 江戸川区東小岩0.9km〒133-0052406
- 江戸川区松本0.9km〒133-004362
- 江戸川区鹿骨0.9km〒133-0073287
- 江戸川区上一色1.1km〒133-0041103
- 江戸川区北篠崎1.2km〒133-005352

Area photographs from Wikimedia Commons (author and licence for each are given on that area’s own report page).
江戸川区 and nearby areas
The report for 江戸川区, which contains 江戸川区南小岩, and the areas around it that publish the same aggregates. Distances are between municipality centroids.
- 江戸川区This area294August 2026
- 市川市4.4km188August 2026
- 浦安市5.9km65August 2026
- 墨田区6.4km343August 2026
- 葛飾区6.7km293August 2026
- 江東区7.0km847August 2026
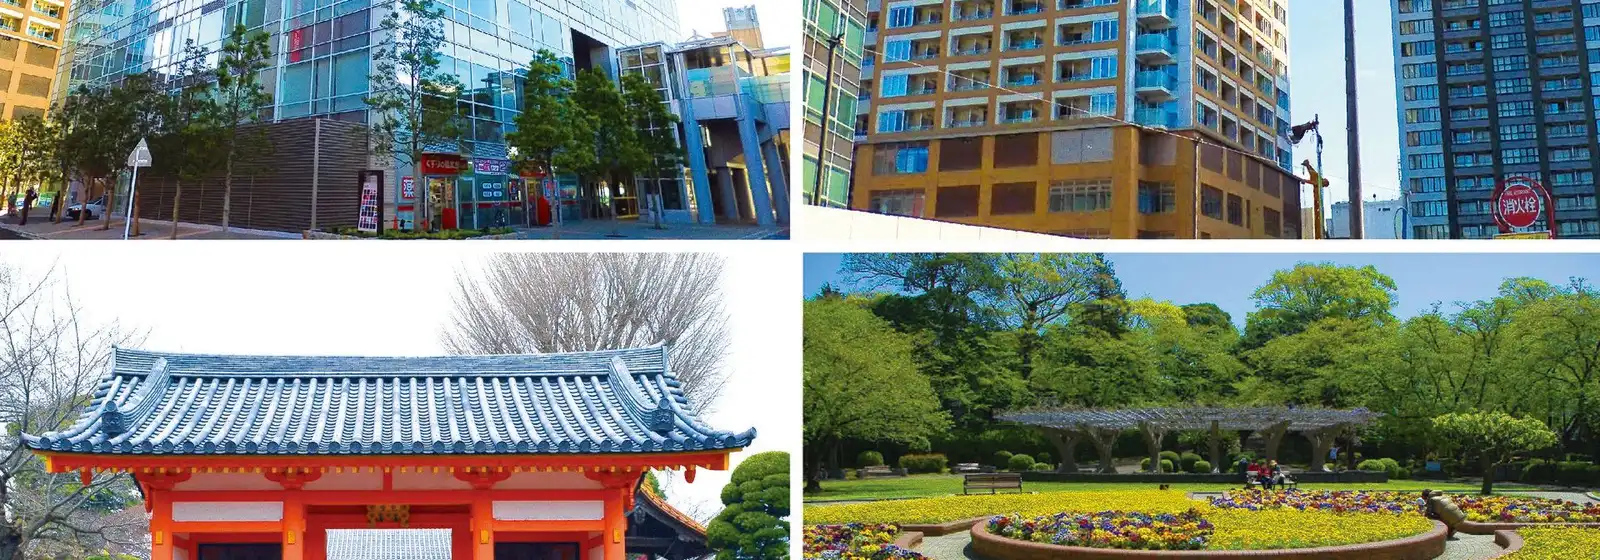
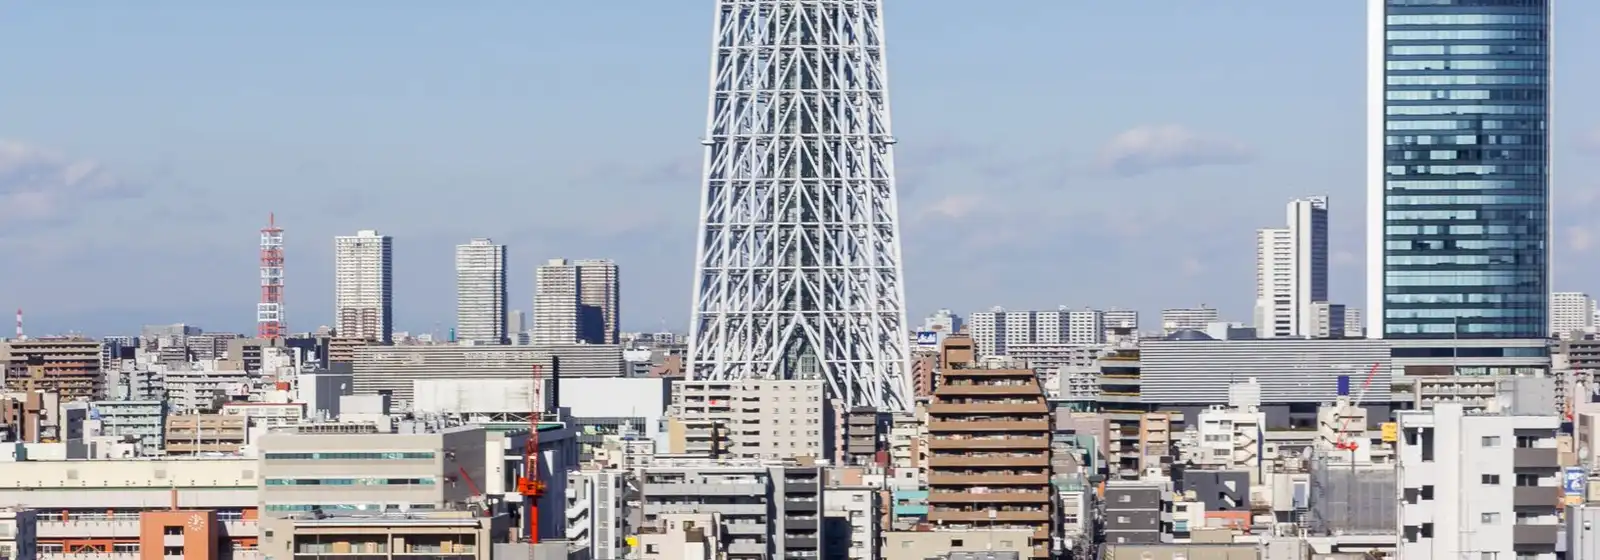
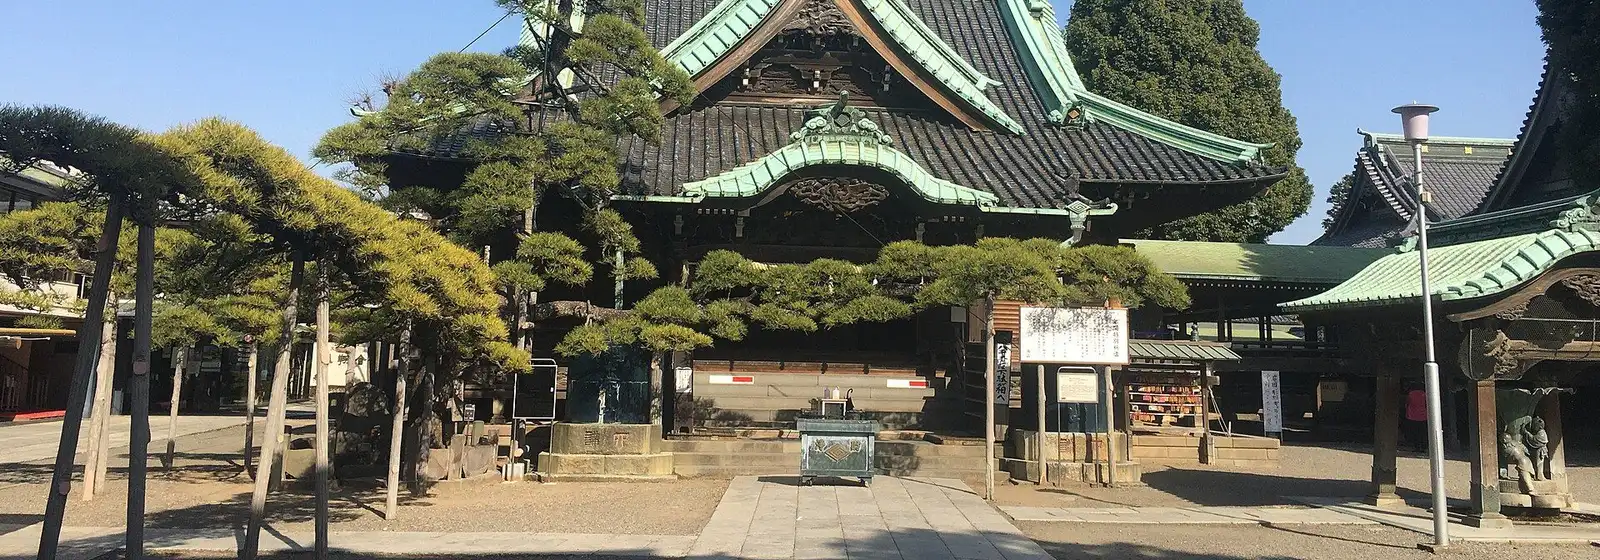
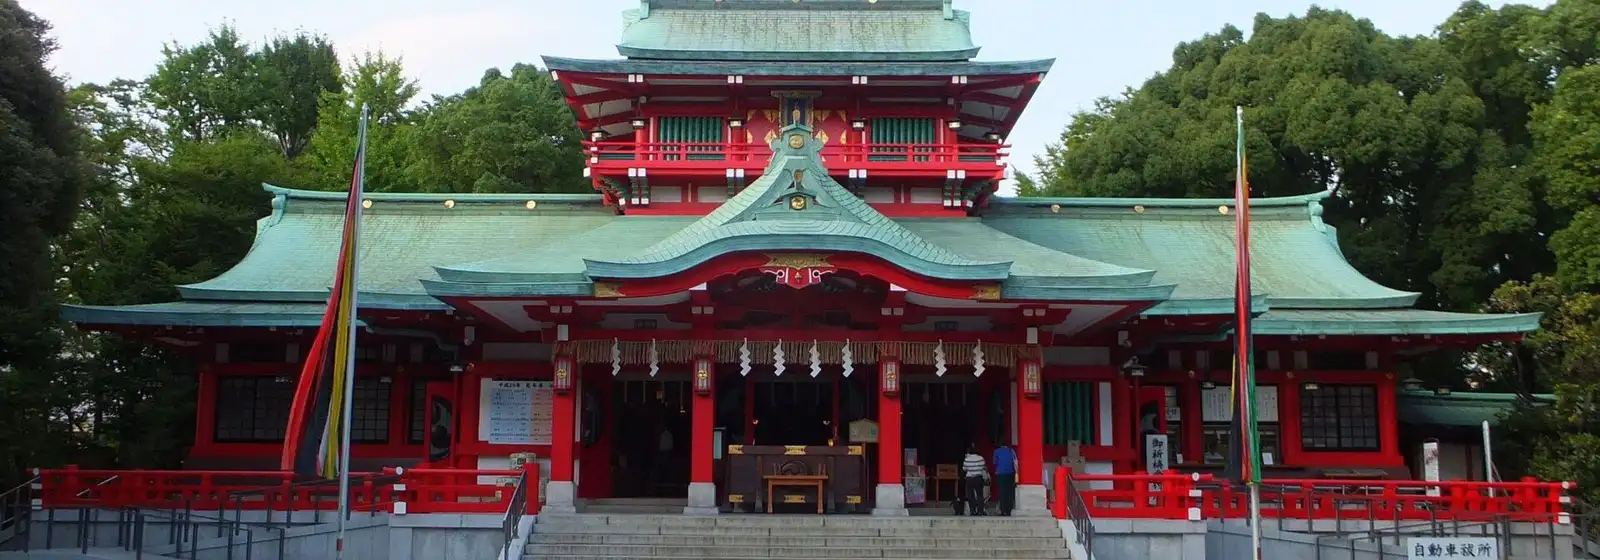
Area photographs from Wikimedia Commons (author and licence for each are given on that area’s own report page).
Stations near 江戸川区南小岩
Ordered by straight-line distance from 江戸川区南小岩. The list crosses prefecture borders — one stopped at the boundary drops the neighbours a reader actually wants to compare.
- 小岩 Station116,612/day4 types175August 2026
- 江戸川 Station5,964/day1 types12July 2026
- 市川 Station219,564/day4 types79August 2026
- 京成小岩 Station17,629/day3 types56August 2026
- 新小岩 Station282,944/day4 types194August 2026
- 篠崎 Station38,263/day3 types61August 2026


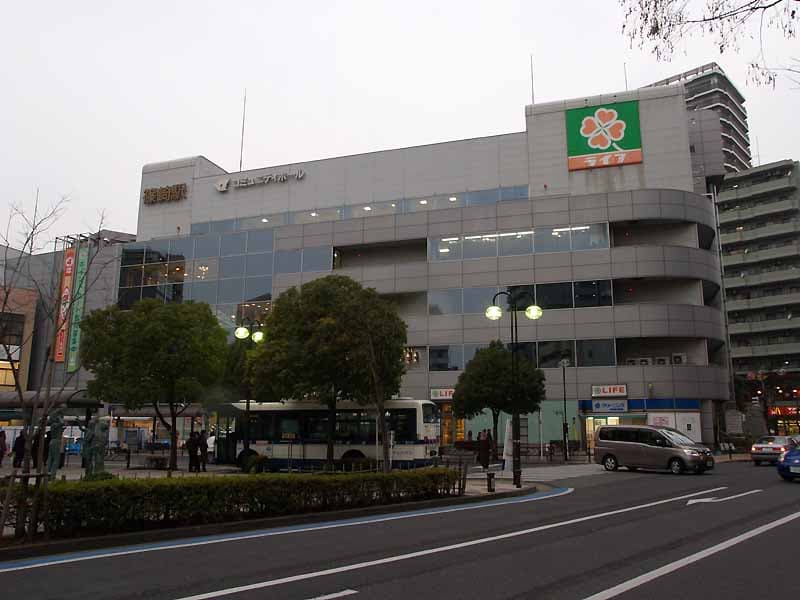
Station photographs from Wikimedia Commons (author and licence are given on each station’s own report page).
Find properties in 江戸川区南小岩
Individual listings, price-change history, closed transactions and AI valuations are available on a free account.