
Yamato, Kanagawa condominium units market report
Record counts, unit-price trends and a comparison against the Kanagawa average, aggregated monthly by Urbalytics for condominium units listed in Yamato, Kanagawa. Latest month: September 2026.
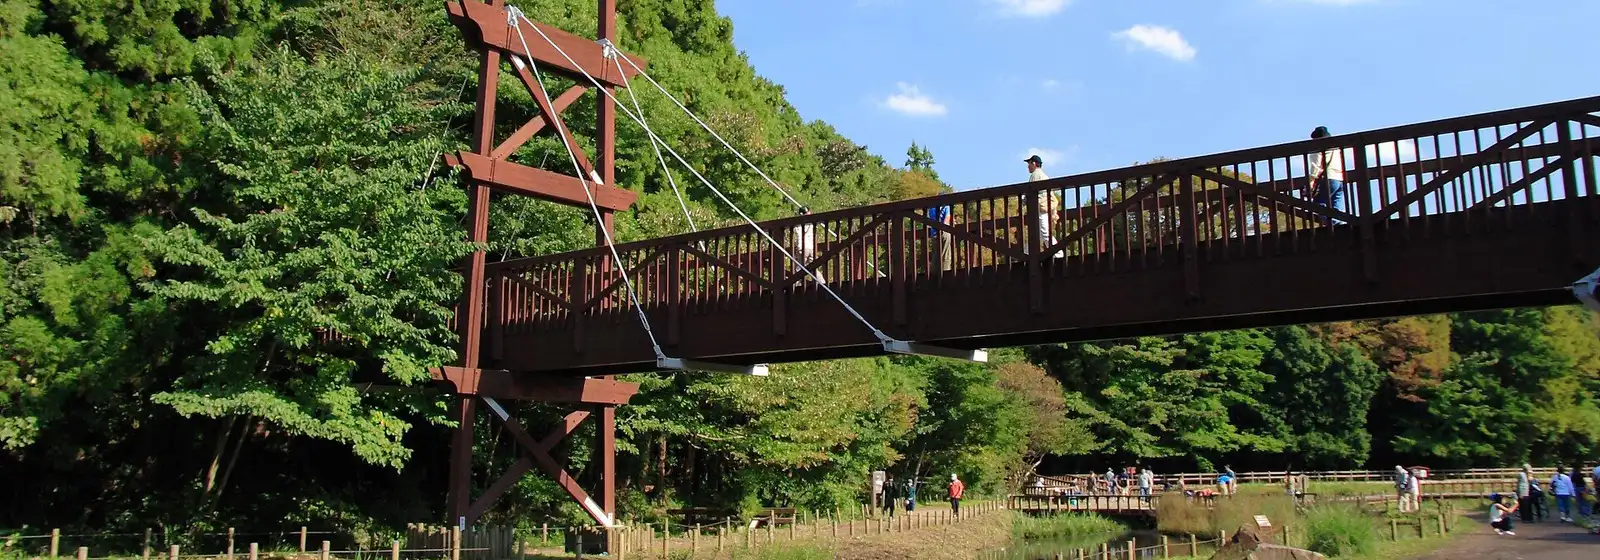
泉の森の木橋, The Wood Bridge at Izumi no mori Park·xezna/CC BY-SA 3.0 (cropped)·Wikimedia Commons
Yamato, Kanagawa condominium units|overview
#Counts are condominium units listings in Yamato, Kanagawa for which a price could be obtained (on the market and closed). The commentary is derived mechanically from the figures on this page.
What the data says
- As of September 2026, Price per ㎡ of floor area for condominium units in Yamato, Kanagawa is ¥456k/㎡ — 12.5% below the Kanagawa average of ¥521k/㎡ (118 records).
asking price and area for condominium units
#Condominium — Asking price and Price per ㎡ of floor area over time
Asking price = the median of prices published to the market. Read as a series, the level of the total shows where the market is moving.
Price per ㎡ of floor area = asking price ÷ floor area. What the property is asking per unit of space (1 tsubo ≈ 3.31㎡).
Asking price
Unit: ¥MPrice per ㎡ of floor area
Unit: ¥M/㎡| Month | Asking price — Yamato | Asking price — Kanagawa | Difference (Asking price) | Price per ㎡ of floor area — Yamato | Price per ㎡ of floor area — Kanagawa | Records |
|---|---|---|---|---|---|---|
| 2026年9月 | 30.9 | 30.8 | +0.3% | 0.46 | 0.52 | 118 |
| 2026年8月 | 25.0 | 29.4 | −15.1% | 0.38 | 0.50 | 116 |
| 2026年7月 | 27.0 | 28.1 | −3.7% | 0.42 | 0.48 | 137 |
| 2026年6月 | 23.0 | 27.9 | −17.6% | 0.36 | 0.47 | 185 |
| 2026年5月 | 25.8 | 26.8 | −3.7% | 0.40 | 0.46 | 166 |
| 2026年4月 | 25.8 | 28.0 | −7.9% | 0.41 | 0.47 | 111 |
| 2026年3月 | 30.5 | 28.8 | +5.7% | 0.46 | 0.47 | 123 |
| 2026年2月 | 24.8 | 28.0 | −11.4% | 0.38 | 0.48 | 105 |
| 2026年1月 | 26.0 | 27.8 | −6.5% | 0.41 | 0.47 | 88 |
| 2025年12月 | 26.9 | 28.8 | −6.6% | 0.39 | 0.47 | 97 |
| 2025年11月 | 26.0 | 28.0 | −7.1% | 0.37 | 0.47 | 117 |
| 2025年10月 | 26.8 | 27.8 | −3.6% | 0.38 | 0.46 | 110 |
| 2025年9月 | 21.0 | 27.9 | −24.7% | 0.35 | 0.46 | 131 |
| 2025年8月 | 20.7 | 26.9 | −23.2% | 0.33 | 0.45 | 128 |
| 2025年7月 | 24.9 | 29.5 | −15.6% | 0.36 | 0.47 | 124 |
| 2025年6月 | 24.9 | 27.8 | −10.4% | 0.38 | 0.46 | 114 |
| 2025年5月 | 25.0 | 26.3 | −5.1% | 0.38 | 0.45 | 147 |
| 2025年4月 | 26.9 | 25.8 | +4.3% | 0.40 | 0.43 | 170 |
| 2025年3月 | 25.8 | 26.9 | −4.1% | 0.39 | 0.44 | 162 |
| 2025年2月 | 27.0 | 33.2 | −18.7% | 0.40 | 0.51 | 129 |
| 2025年1月 | 26.7 | 33.0 | −19.2% | 0.39 | 0.51 | 101 |
| 2024年12月 | 26.8 | 32.8 | −18.3% | 0.39 | 0.50 | 105 |
| 2024年11月 | 27.0 | 37.6 | −28.2% | 0.40 | 0.53 | 44 |
| 2024年10月 | 29.0 | 37.0 | −21.6% | 0.48 | 0.54 | 33 |
| 2024年9月 | 28.0 | 37.8 | −26.0% | 0.40 | 0.55 | 31 |
| 2024年8月 | 28.4 | 36.9 | −23.0% | 0.47 | 0.54 | 26 |
| 2024年7月 | 28.9 | 38.0 | −23.9% | 0.50 | 0.55 | 27 |
| 2024年6月 | 28.0 | 38.8 | −27.9% | 0.44 | 0.57 | 23 |
| 2024年5月 | 27.7 | 37.7 | −26.7% | 0.43 | 0.55 | 23 |
| 2024年4月 | 26.5 | 34.8 | −23.9% | 0.39 | 0.52 | 48 |
| 2024年3月 | 23.8 | 34.2 | −30.3% | 0.34 | 0.51 | 52 |
| 2024年2月 | 26.5 | 33.9 | −21.8% | 0.39 | 0.51 | 46 |
| 2024年1月 | 24.7 | 34.8 | −29.0% | 0.36 | 0.51 | 77 |
| 2023年12月 | 25.8 | 34.8 | −25.9% | 0.39 | 0.52 | 85 |
| 2023年11月 | 25.8 | 34.8 | −25.9% | 0.39 | 0.51 | 72 |
| 2023年10月 | 26.5 | 34.8 | −23.9% | 0.39 | 0.52 | 71 |
| 2023年9月 | 24.1 | 34.8 | −30.7% | 0.38 | 0.53 | 40 |
| 2023年8月 | 25.9 | 33.9 | −23.5% | 0.38 | 0.51 | 47 |
| 2023年7月 | 25.4 | 33.8 | −24.7% | 0.38 | 0.51 | 41 |
| 2023年6月 | 25.4 | 34.8 | −27.2% | 0.40 | 0.52 | 42 |
| 2023年5月 | 25.4 | 34.1 | −25.3% | 0.40 | 0.51 | 45 |
| 2023年4月 | 23.0 | 33.0 | −30.3% | 0.38 | 0.50 | 50 |
| 2023年3月 | 24.8 | 32.0 | −22.5% | 0.37 | 0.50 | 42 |
| 2023年2月 | 26.8 | 33.0 | −18.8% | 0.40 | 0.51 | 43 |
| 2023年1月 | 26.0 | 35.0 | −25.8% | 0.41 | 0.52 | 22 |
| 2022年12月 | 27.8 | 35.8 | −22.3% | 0.41 | 0.53 | 44 |
Source: monthly aggregates of listing and rental-offer data collected by Urbalytics
Conditions
- Source: listings Urbalytics collects (on the market and closed)
- Publication threshold: figures shown only for months with 10 or more records
- Statistic: median (P20–P80 is the 20th to 80th percentile). Outliers removed by the IQR method
- In a thin month (10–30 records) both the median and the P20–P80 band move on a single listing. Read them alongside the record count shown next to each figure.
- Period: from 12 2022 — the window over which each property type is aggregated independently
What the data says
- As of September 2026, Price per ㎡ of floor area for condominium units in Yamato, Kanagawa is ¥456k/㎡ — 12.5% below the Kanagawa average of ¥521k/㎡ (118 records).
- From December 2022 to September 2026, Price per ㎡ of floor area for condominium units in Yamato, Kanagawa went from ¥410k/㎡ to ¥456k/㎡ — up (+11.2%).
- From December 2022 to September 2026, Asking price for condominium units in Yamato, Kanagawa went from ¥27.8M to ¥30.9M — up (+11.1%).
Condominium — Exclusive floor area over time
Exclusive floor area = the median Exclusive floor area among listed properties. At the same Price per ㎡ of floor area, more space still means a higher total — which is why this is read alongside the price series.
| Month | Yamato | Kanagawa | Difference | Records |
|---|---|---|---|---|
| 2026年9月 | 65.1 | 66.8 | −2.5% | 118 |
| 2026年8月 | 65.1 | 65.4 | −0.5% | 116 |
| 2026年7月 | 67.6 | 65.6 | +3.0% | 137 |
| 2026年6月 | 66.0 | 65.2 | +1.2% | 185 |
| 2026年5月 | 66.5 | 65.2 | +2.0% | 166 |
| 2026年4月 | 68.1 | 66.7 | +2.1% | 111 |
| 2026年3月 | 69.5 | 67.2 | +3.4% | 123 |
| 2026年2月 | 67.9 | 66.5 | +2.1% | 105 |
| 2026年1月 | 68.6 | 66.1 | +3.8% | 88 |
| 2025年12月 | 70.7 | 67.2 | +5.2% | 97 |
| 2025年11月 | 68.8 | 66.8 | +3.0% | 117 |
| 2025年10月 | 70.4 | 65.9 | +6.8% | 110 |
| 2025年9月 | 68.6 | 67.2 | +2.1% | 131 |
| 2025年8月 | 60.8 | 65.0 | −6.5% | 128 |
| 2025年7月 | 66.8 | 68.3 | −2.2% | 124 |
| 2025年6月 | 66.0 | 66.9 | −1.3% | 114 |
| 2025年5月 | 68.2 | 65.4 | +4.3% | 147 |
| 2025年4月 | 68.6 | 65.9 | +4.1% | 170 |
| 2025年3月 | 68.9 | 67.0 | +2.8% | 162 |
| 2025年2月 | 67.9 | 68.4 | −0.7% | 129 |
| 2025年1月 | 66.0 | 68.0 | −2.9% | 101 |
| 2024年12月 | 67.0 | 68.7 | −2.5% | 105 |
| 2024年11月 | 64.0 | 70.0 | −8.6% | 44 |
| 2024年10月 | 66.4 | 70.0 | −5.1% | 33 |
| 2024年9月 | 64.0 | 70.0 | −8.6% | 31 |
| 2024年8月 | 68.0 | 70.3 | −3.3% | 26 |
| 2024年7月 | 68.0 | 70.0 | −2.9% | 27 |
| 2024年6月 | 66.3 | 70.0 | −5.3% | 23 |
| 2024年5月 | 64.3 | 70.0 | −8.1% | 23 |
| 2024年4月 | 66.0 | 68.0 | −2.9% | 48 |
| 2024年3月 | 63.8 | 68.0 | −6.2% | 52 |
| 2024年2月 | 62.8 | 68.0 | −7.6% | 46 |
| 2024年1月 | 62.0 | 68.0 | −8.8% | 77 |
| 2023年12月 | 68.0 | 70.0 | −2.9% | 85 |
| 2023年11月 | 64.0 | 68.0 | −5.9% | 72 |
| 2023年10月 | 66.0 | 70.0 | −5.7% | 71 |
| 2023年9月 | 64.0 | 68.0 | −5.9% | 40 |
| 2023年8月 | 64.0 | 68.0 | −5.9% | 47 |
| 2023年7月 | 64.0 | 68.0 | −5.9% | 41 |
| 2023年6月 | 64.0 | 69.3 | −7.6% | 42 |
| 2023年5月 | 64.0 | 70.0 | −8.6% | 45 |
| 2023年4月 | 64.0 | 68.0 | −5.9% | 50 |
| 2023年3月 | 62.0 | 68.0 | −8.8% | 42 |
| 2023年2月 | 66.0 | 68.0 | −2.9% | 43 |
| 2023年1月 | 70.0 | 68.0 | +2.9% | 22 |
| 2022年12月 | 70.0 | 70.0 | ±0.0% | 44 |
Source: monthly aggregates of listing and rental-offer data collected by Urbalytics
Conditions
- Source: listings Urbalytics collects (on the market and closed)
- Area: building area is gross floor area (exclusive area for condominium units); land area is the registered figure
- Publication threshold: figures shown only for months with 10 or more records
- Statistic: median (P20–P80 is the 20th to 80th percentile)
What the data says
- As of September 2026, Exclusive floor area for condominium units in Yamato, Kanagawa is 65.1㎡ — 2.5% below the Kanagawa average of 66.8㎡ (118 records).
Asking rent and area over time
#Total rent = monthly rent + common charges; rent per unit area is that divided by area. Area is the variable between the two — a month where only the total moved is a month where the space on offer changed, not the price.
Sign up free to see all the data
Detailed distributions and trends are available on a free account.
condominium units: listings over time
#Sign up free to see all the data
Detailed distributions and trends are available on a free account.
Figures on this page are derived statistics: monthly aggregates of listing and rental-offer data collected by Urbalytics. They are not individual transaction records.
Condominium prices by station in Yamato, Kanagawa
Stations in Yamato, Kanagawa, most data first. Each is aggregated over listings within walking distance of the station.
- Chuo-rinkan Station184,443/day3 types82September 2026
- Sakuragaoka Station18,618/day4 types72September 2026
- Yamato Station217,780/day3 types62September 2026
- Minami-Rinkan Station30,426/day3 types61September 2026
- Tsukimino Station10,483/day3 types53September 2026
- Tsuruma Station28,174/day3 types52September 2026


Station photographs from Wikimedia Commons (author and licence are given on each station’s own report page).
Condominium prices in areas near Yamato, Kanagawa
Municipalities with a Condominium report, nearest to Yamato, Kanagawa first. Distance is measured between municipality centres.
- 横浜市瀬谷区2.6km23September 2026
- 綾瀬市4.5km21September 2026
- 座間市4.5km63September 2026
- 横浜市旭区6.6km105September 2026
- 海老名市6.8km88September 2026
- 相模原市南区7.0km138September 2026
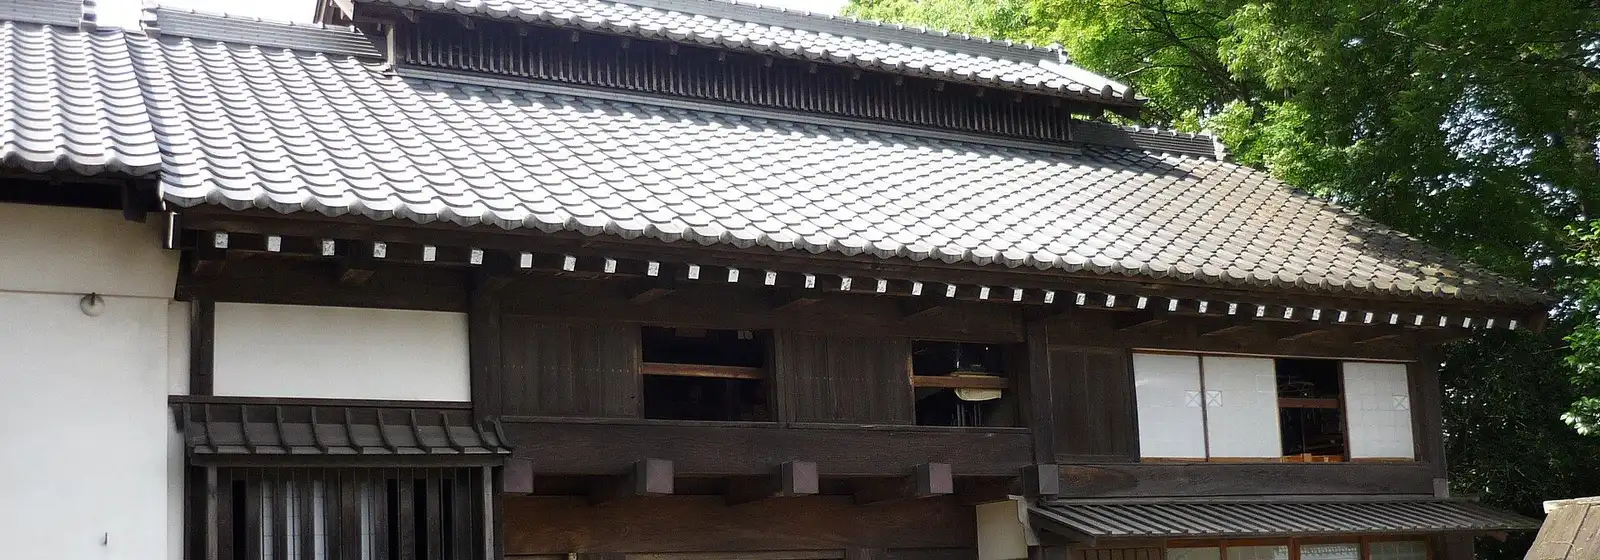
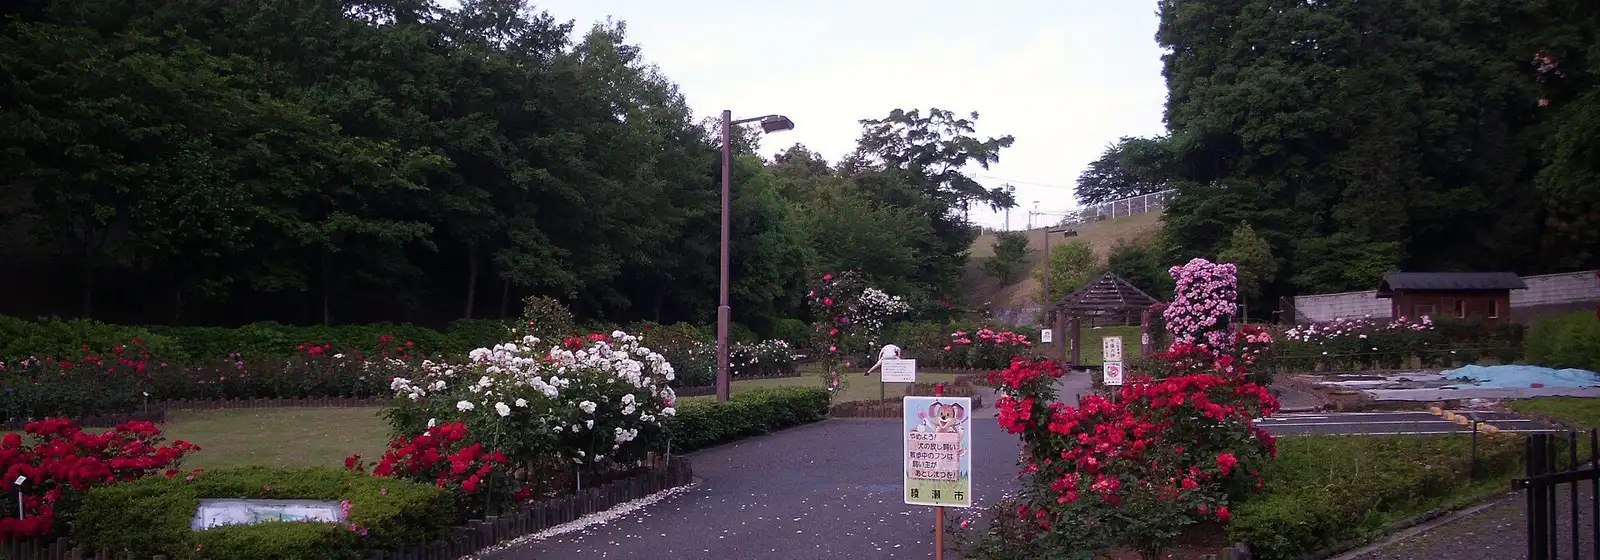
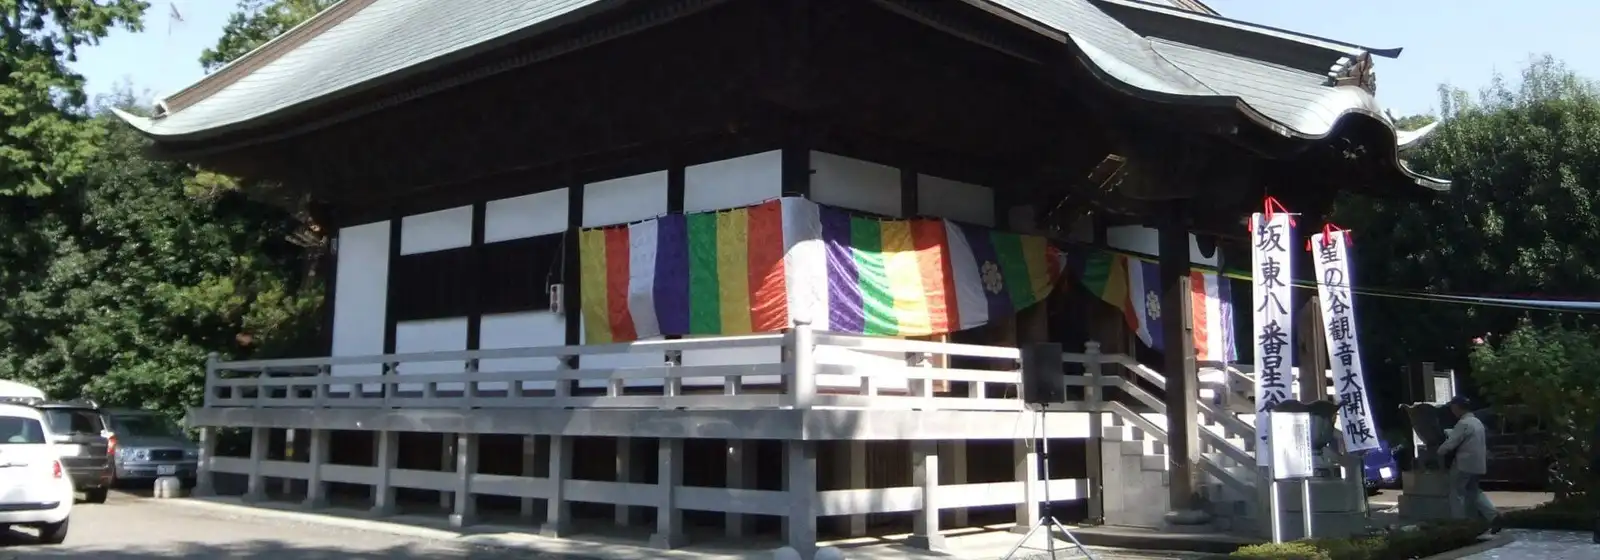

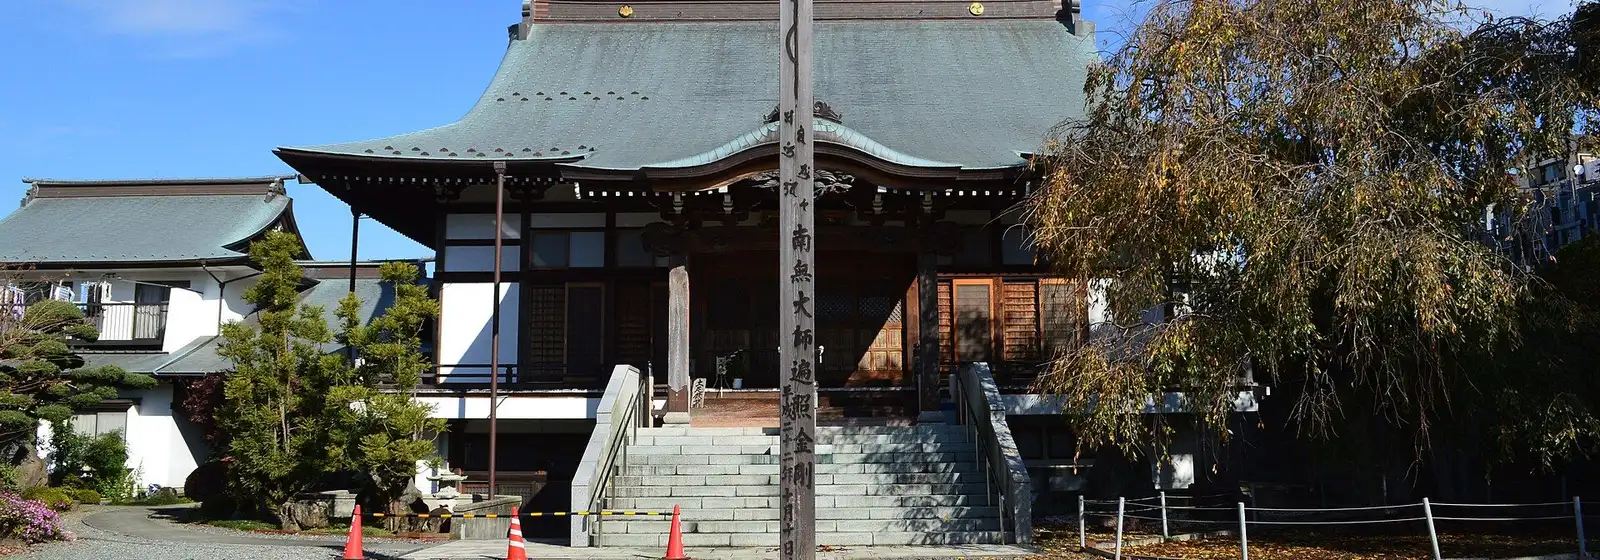
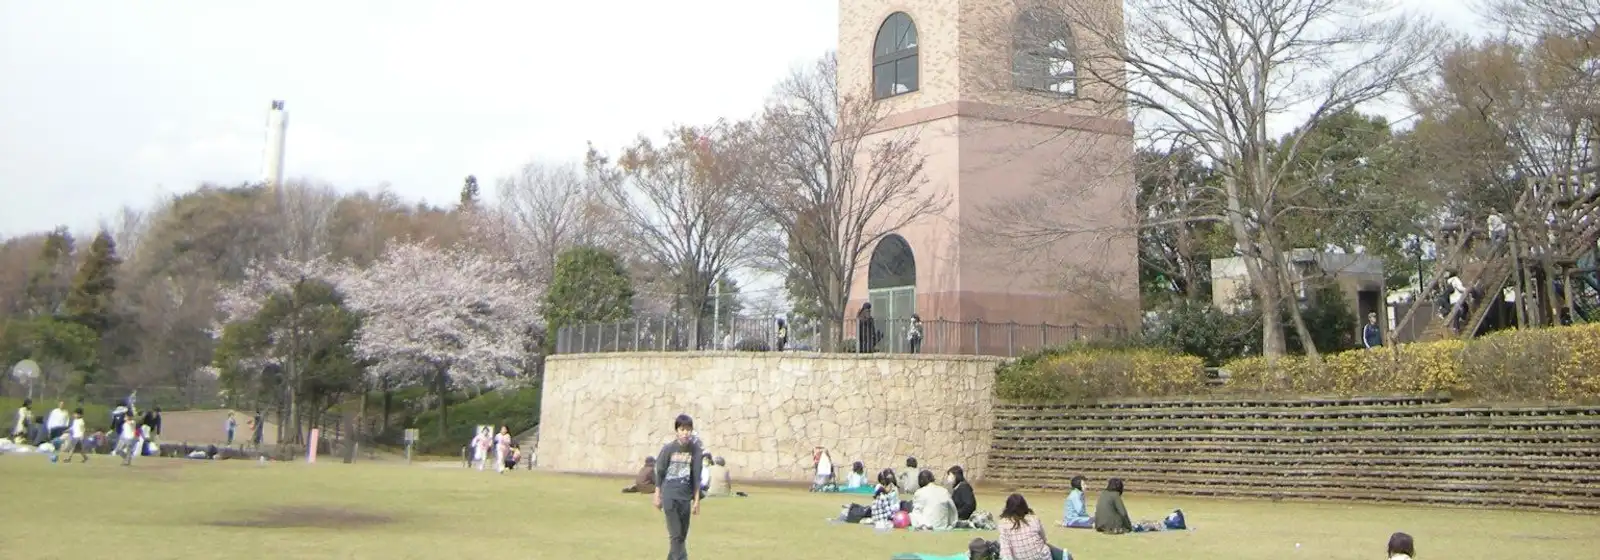
Area photographs from Wikimedia Commons (author and licence for each are given on that area’s own report page).
Prices by postal code in Yamato, Kanagawa
Postal codes in Yamato, Kanagawa, most data first. Counts are sale and rental records across the period.
Find condominiums in Yamato, Kanagawa
Individual listings, price-change history, closed transactions and AI valuations are available on a free account.