![[Case Study] Using Urbalytics: 5 Steps to Spot Properties That Lose Money When Bought](/_next/image?url=https%3A%2F%2Fs3.ap-northeast-1.amazonaws.com%2Furbalytics.reins.downloads%2Fblog-images%2F1754997999806-982731cd13fd268aa2fef74c89904c1456a8f192-2074x1204.avif&w=3840&q=75)
Words: 736 | Estimated Reading Time: 4 minutes | Views: 1439
Since Urbalytics launched, we have received a lot of user feedback: "Feature-rich, but not sure where to start."
This article uses a real property case to show how to quickly assess an investment property's value with Urbalytics — especially how to spot listings that are obvious money pits.
⚠️Note: Some features (such as rent lookup) are paid features and are only available to subscribers.
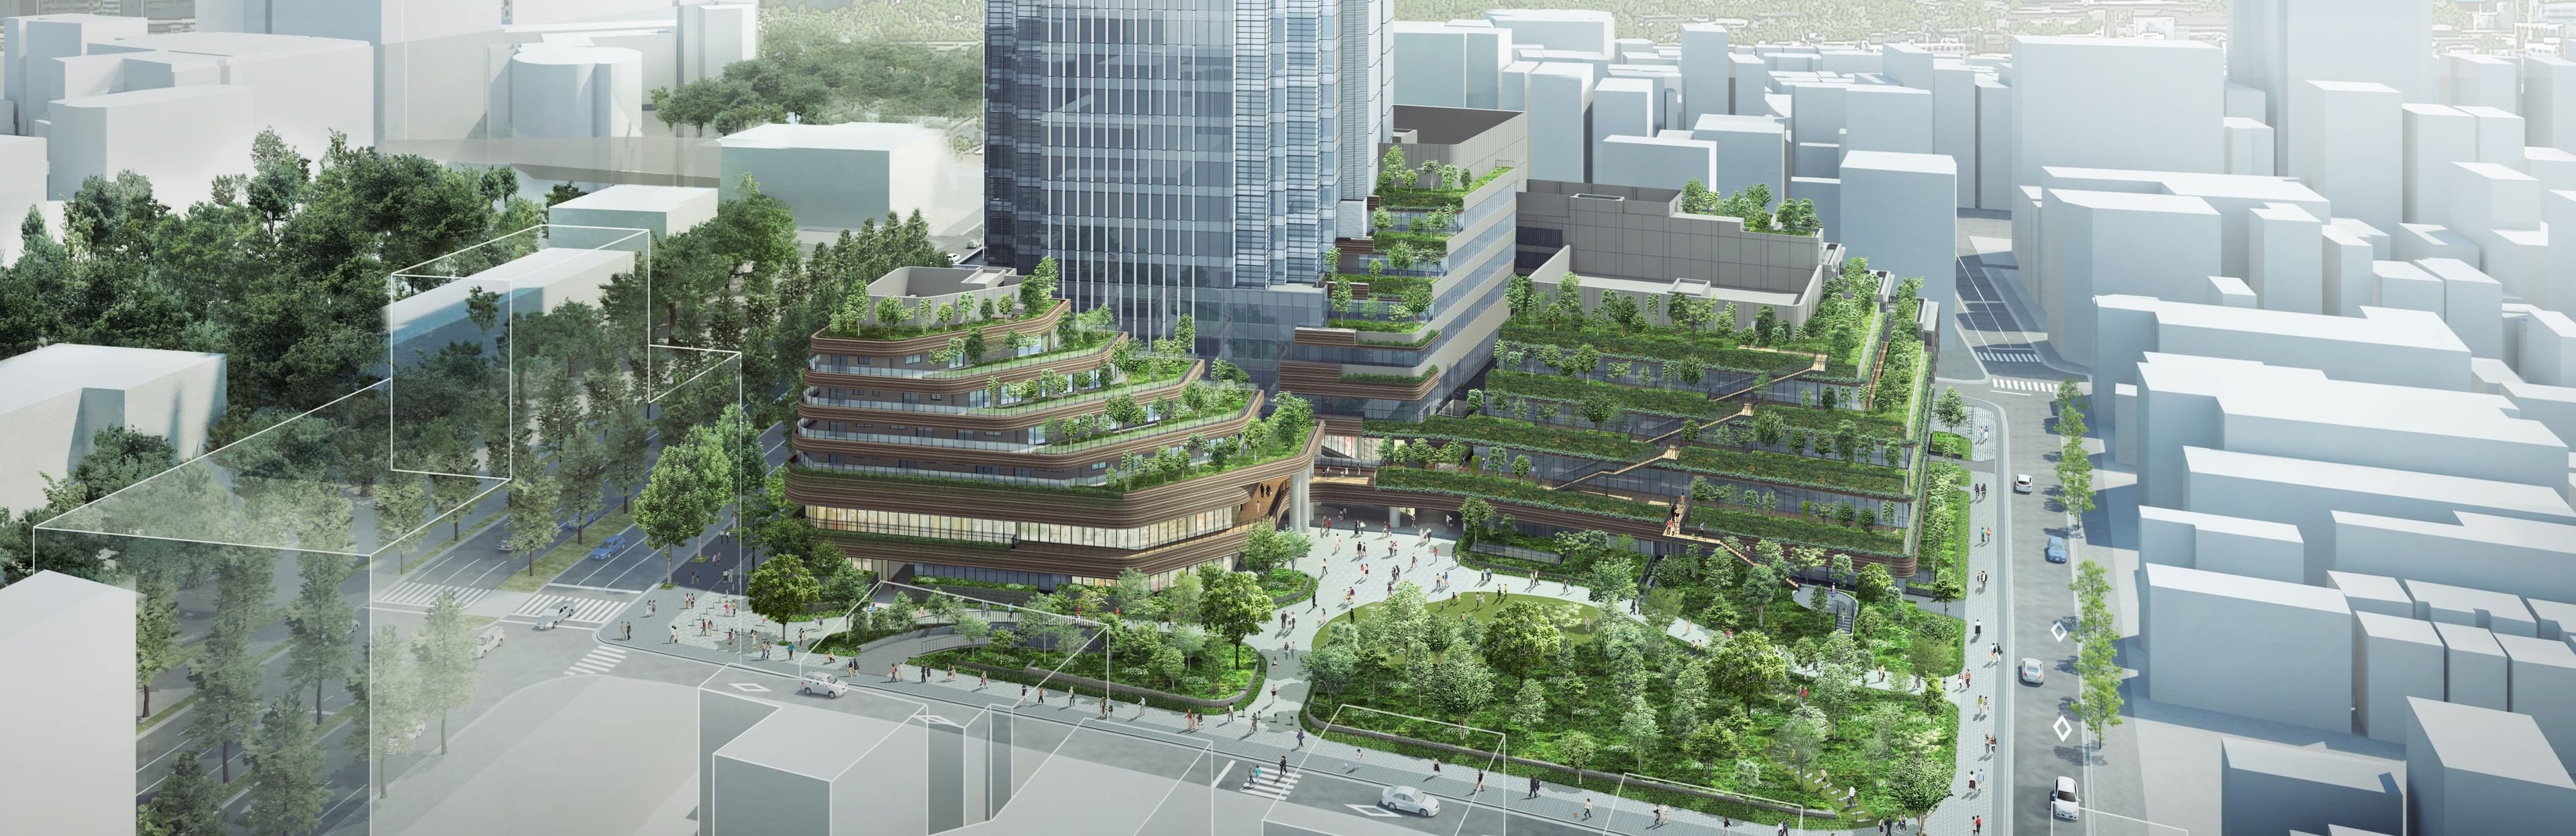
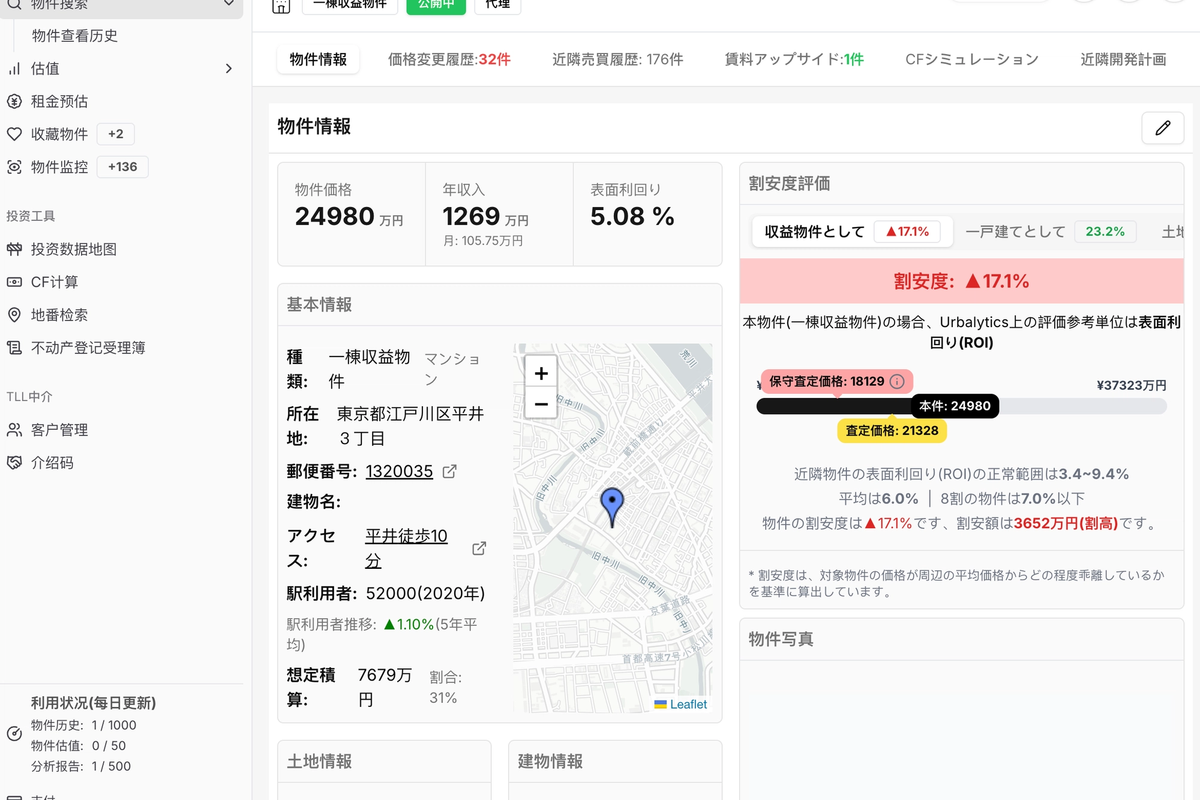
📍Case Information (Fig. 1)
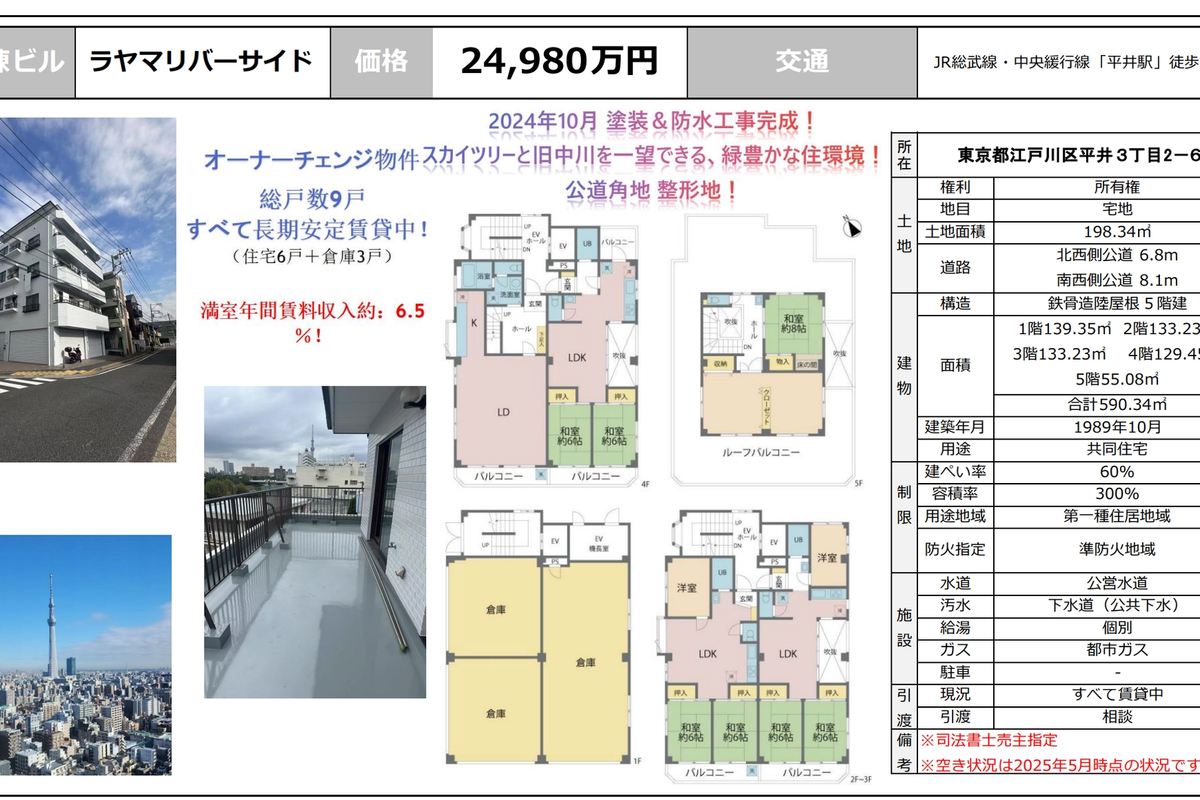
• Location: Hirai 3-chome, Edogawa-ku, Tokyo
• Listing price: JPY 249.8 million
• Gross yield: 6.5%
• Land area: 198.34㎡
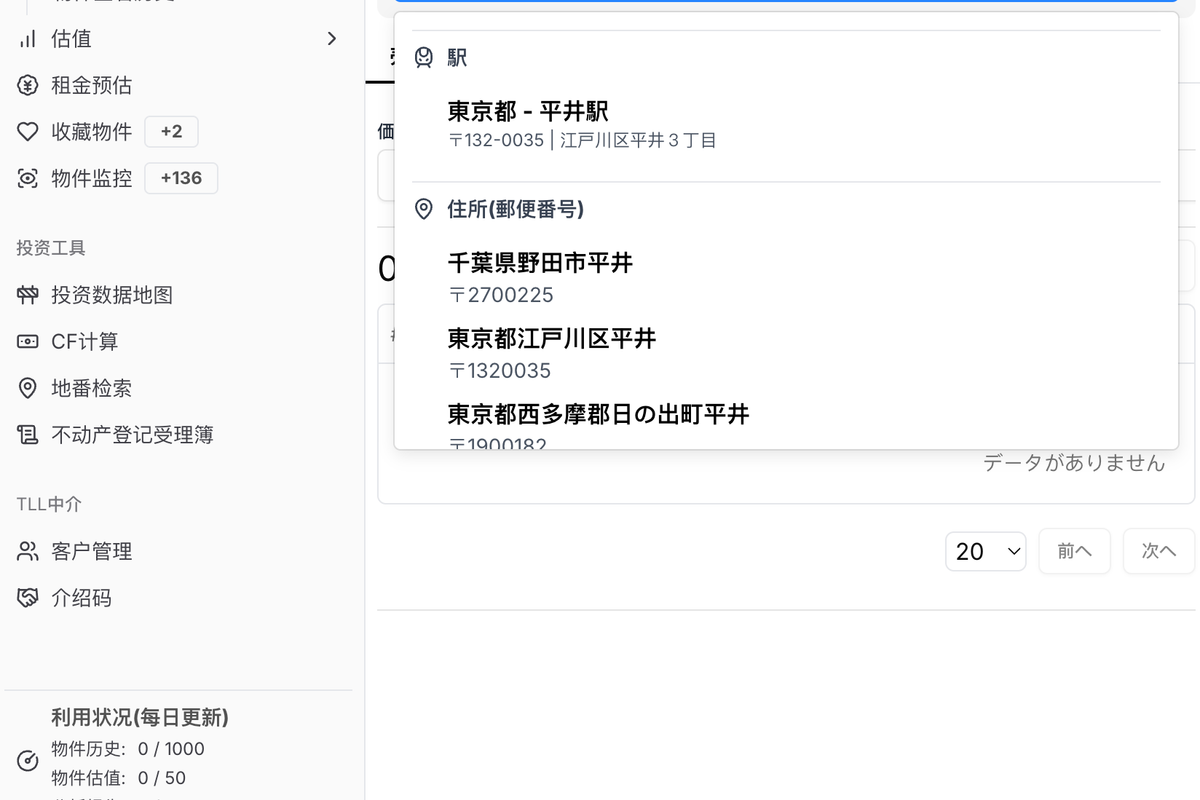
Step 1 | Use "Property Search" to Quickly Locate the Listing
1. Log in to Urbalytics and click "Property Search" from the main menu.
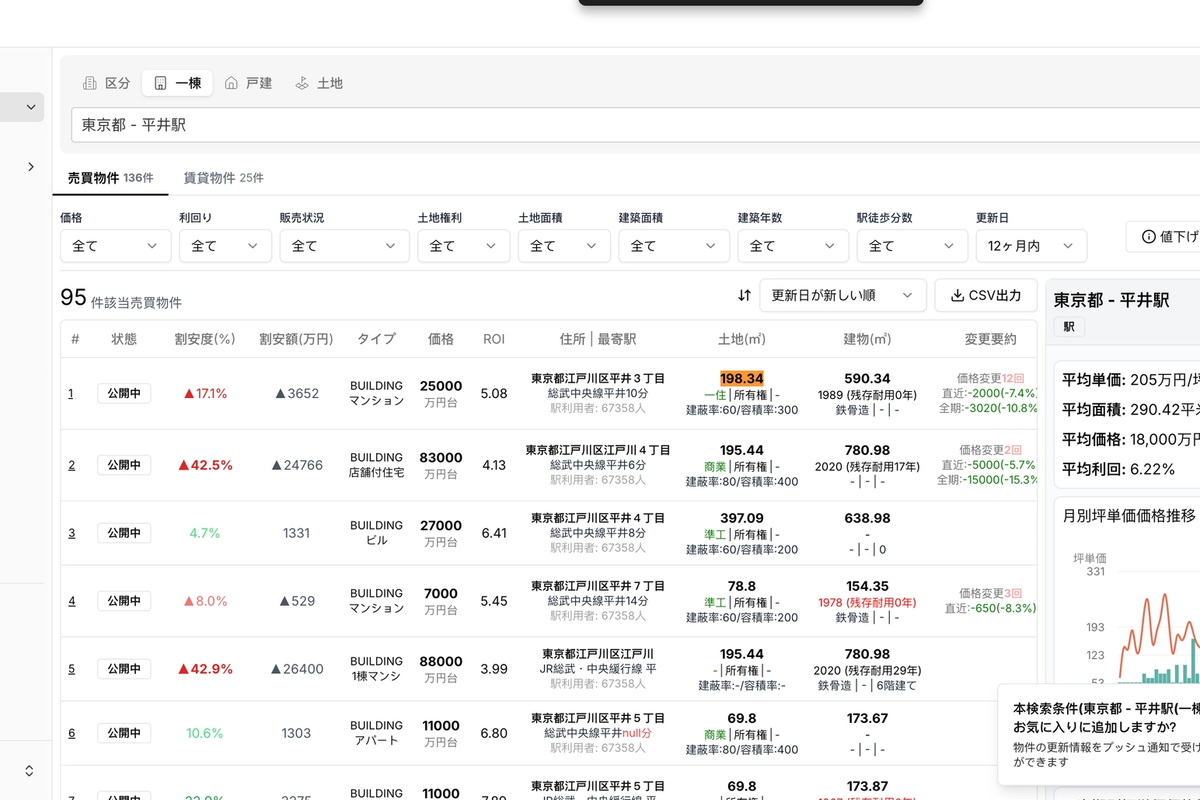
2. In the top-right search area, set the property type to "Whole Building".
3. We recommend searching by metro station name (e.g., "Hirai") or address keywords (e.g., "Edogawa-ku Hirai") (Fig. 2).
4. Use the land area (198.34㎡) to narrow results and precisely locate the property (Fig. 3).
5. Click the details button on the right to open the analysis page (Fig. 4).
Step 2 | Identify "Resale" Listings from Price Change History
1. Scroll to the "Price Change History" block (Fig. 5).
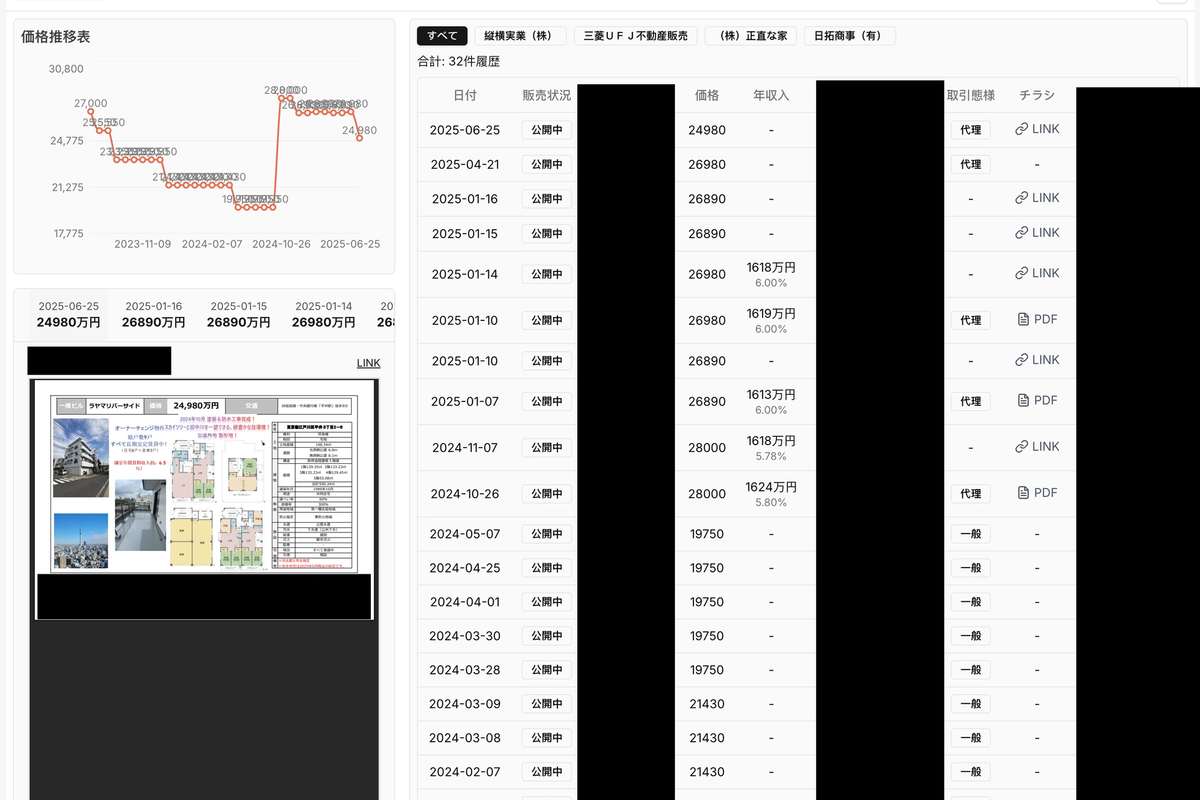
2. The listing shows 32 price-change entries.
3. According to the price trend chart, the property may have transacted in May 2024 for JPY 197.5 million or less.
4. It was later resold at JPY 280 million and dropped to the current price within six months.
5. If the seller is a professional targeting ~20% profit, their reference price was likely in the JPY 230–240 million range.
6. Multiple price adjustments plus rapid re-listing indicate this is a typical resale/flipping case.
Step 3 | Compare Local Yields to See If It's Overpriced
1. Scroll to "Nearby Sales History" (Fig. 6).
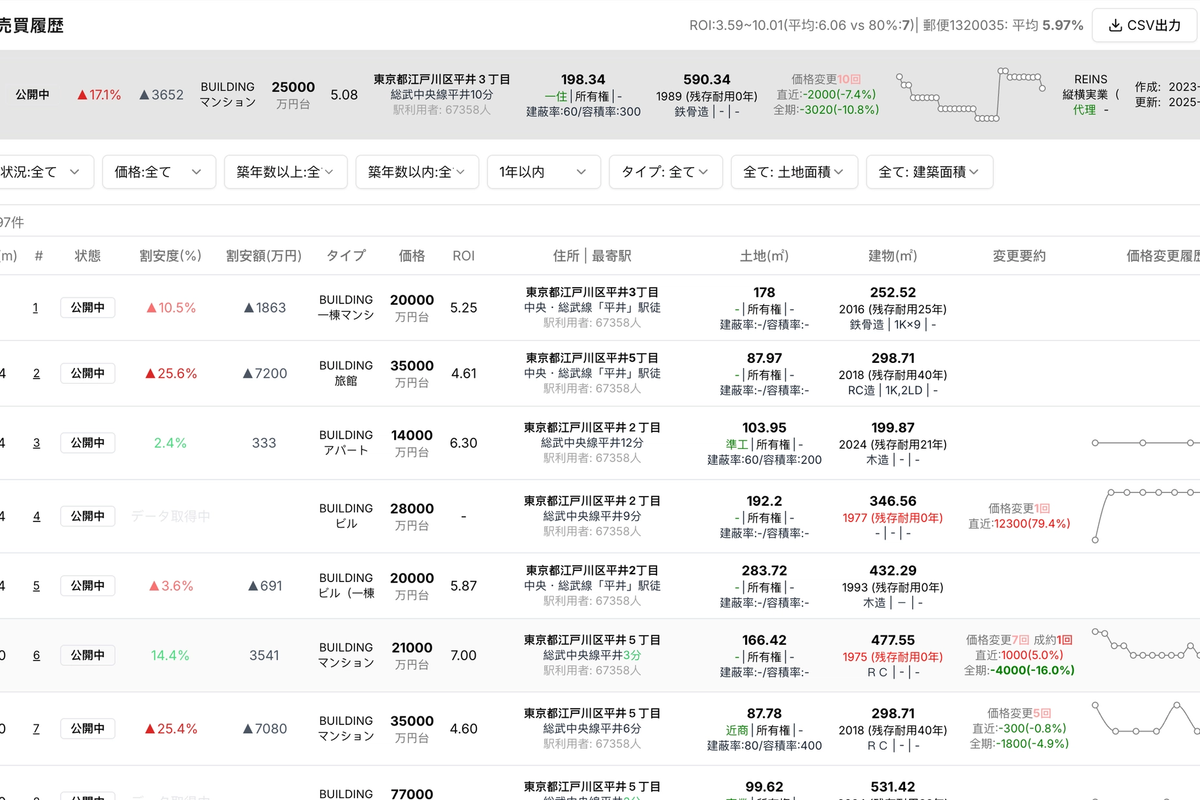
2. Filter: building age 30+ years (add more filters depending on the property).
3. Yield range: 4%–11.02% (average 6.81%, 80th percentile 9%).
4. The current property's yield is only 6.5%, below the average — a "buy-and-lose" type of listing.
Step 4 | Assess Rent Upside Potential
1. If rents are below the market average, operational improvements can still increase returns.
2. Scroll to the "Rent Upside" block (Fig. 7).
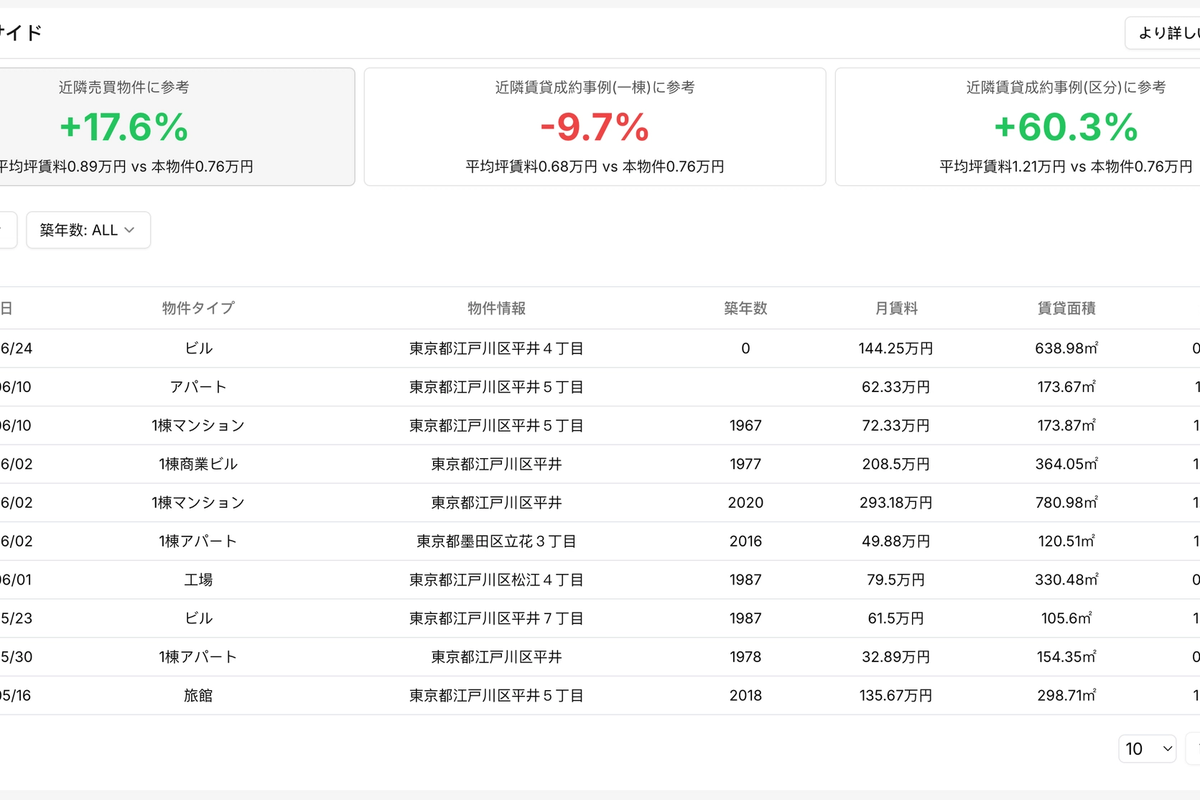
3. Results show this property's rent is 17.6% below the surrounding market, so there is room for increases.
4. Assuming improvements capture half of that gap (≈8.8%), proceed to the cash flow simulation (next step).
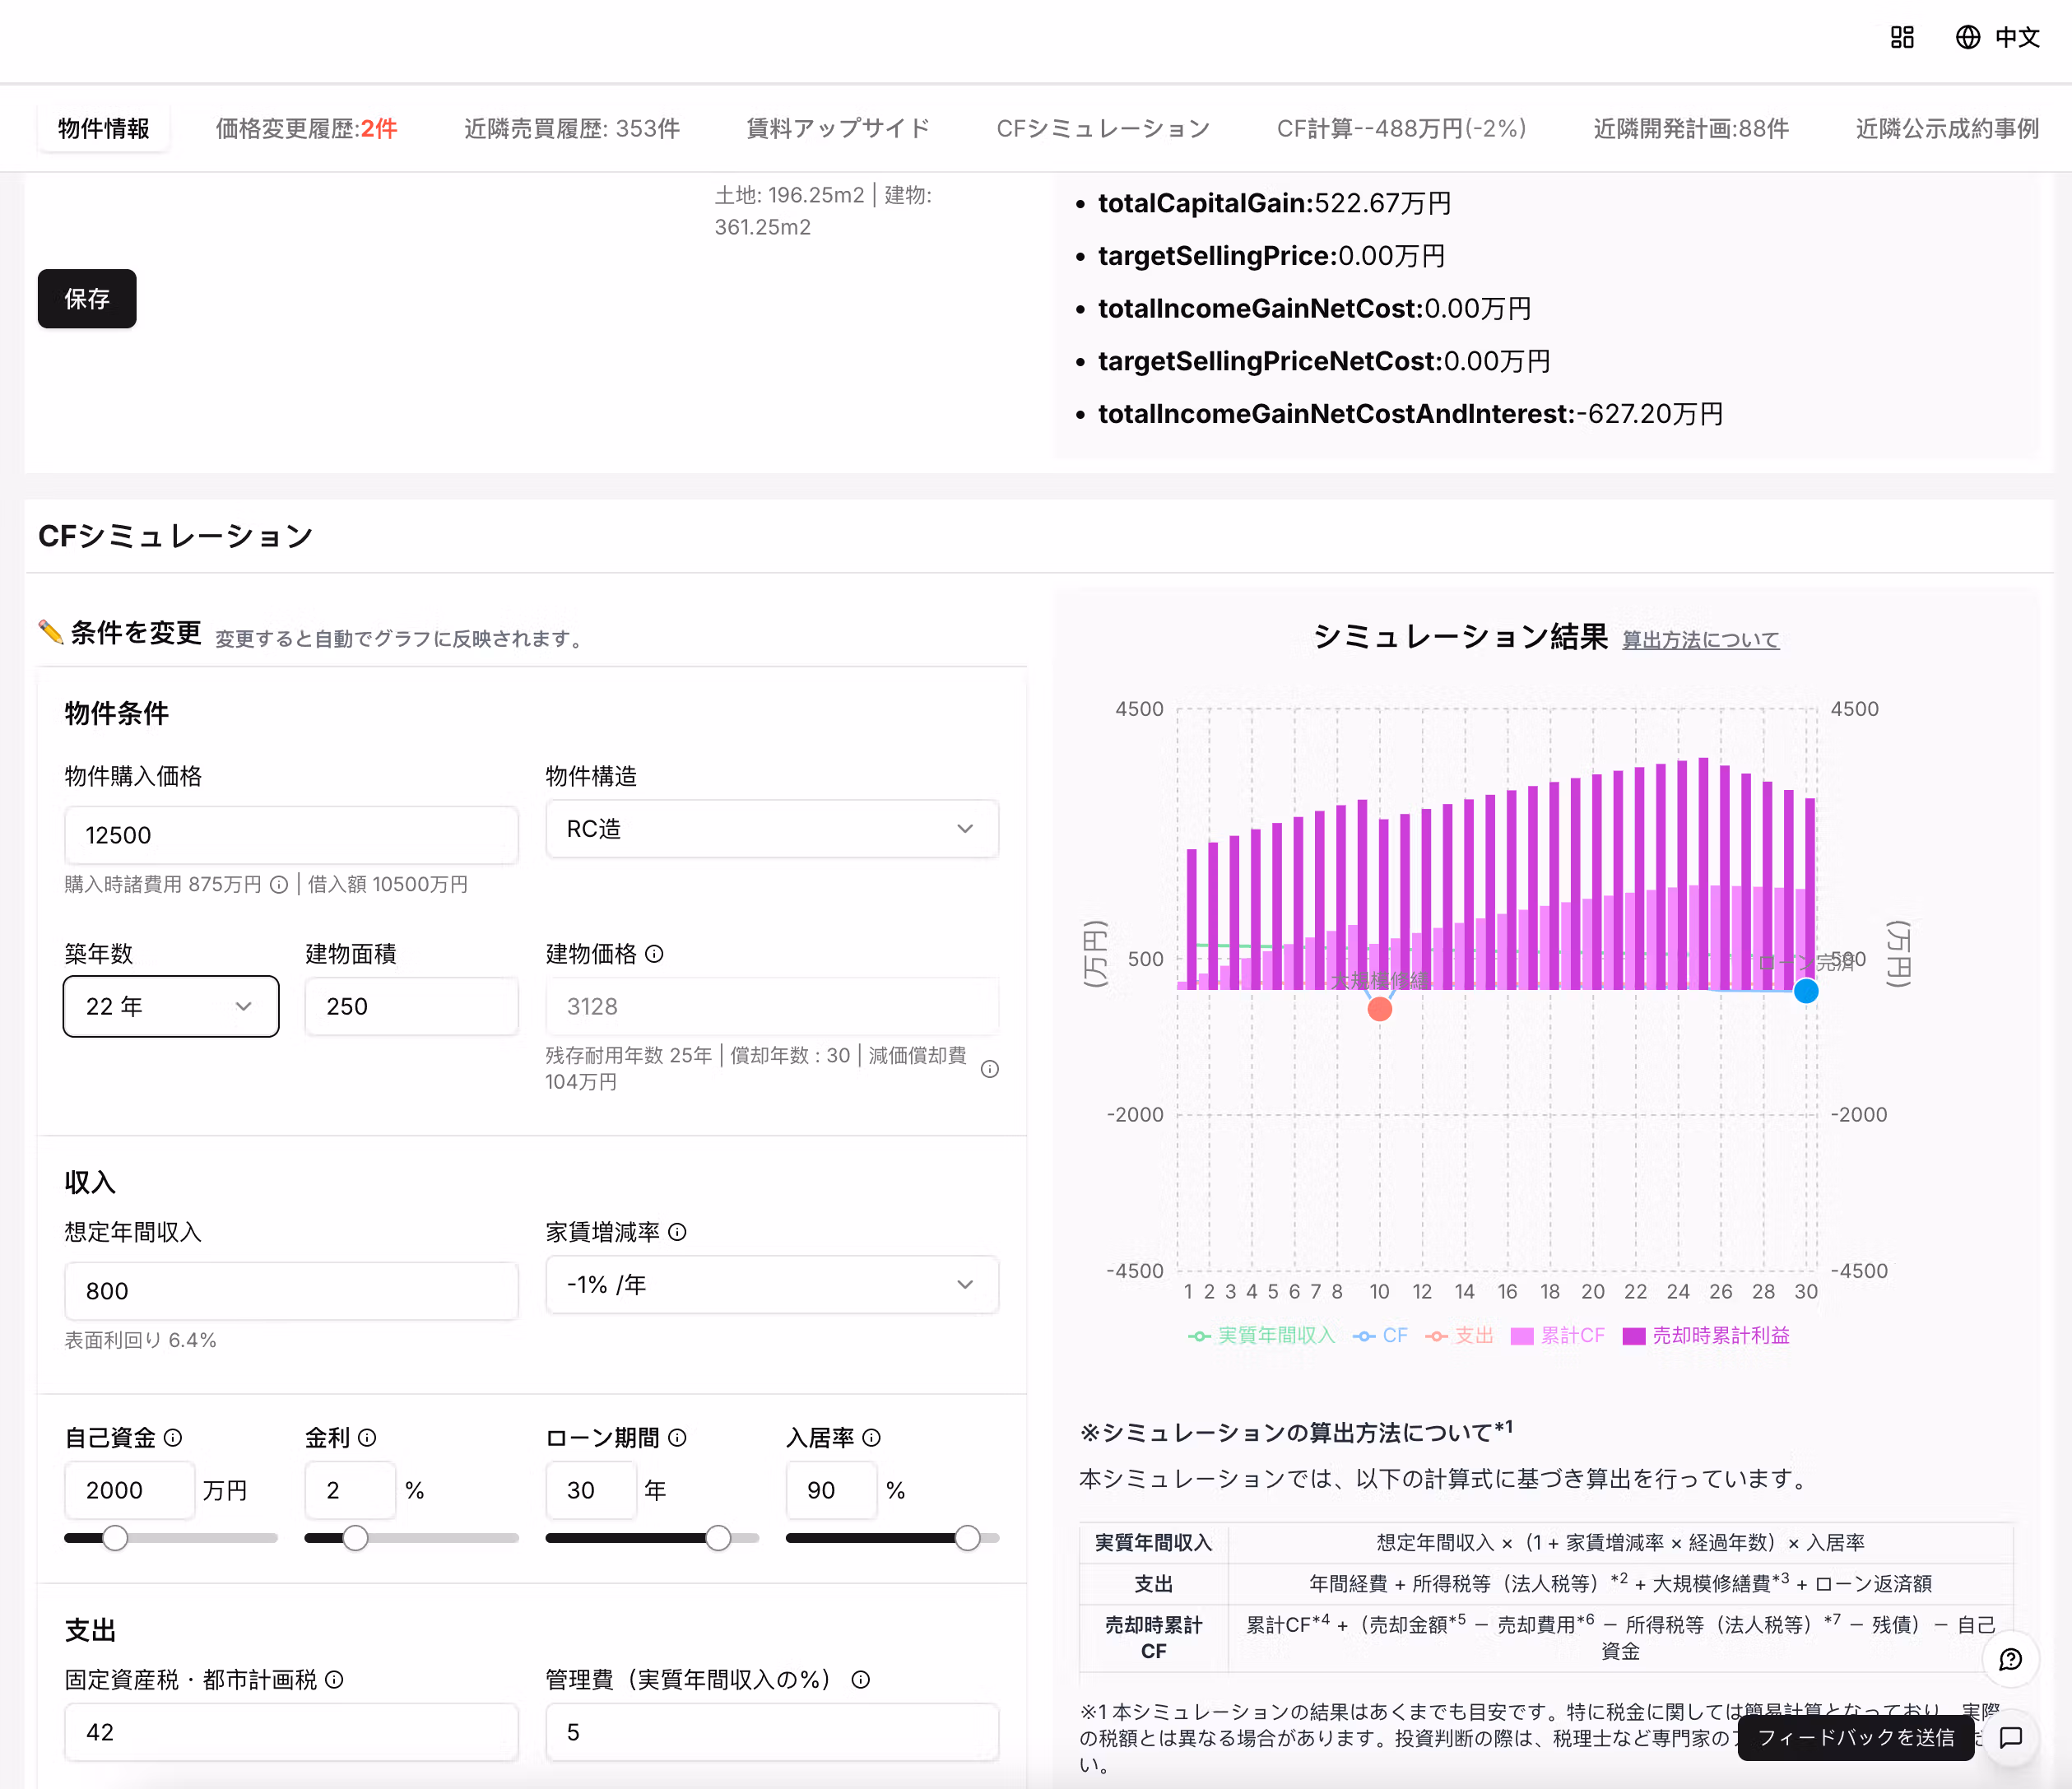
Step 5 | Use Cash Flow Simulation to Calculate Payback Period and IRR
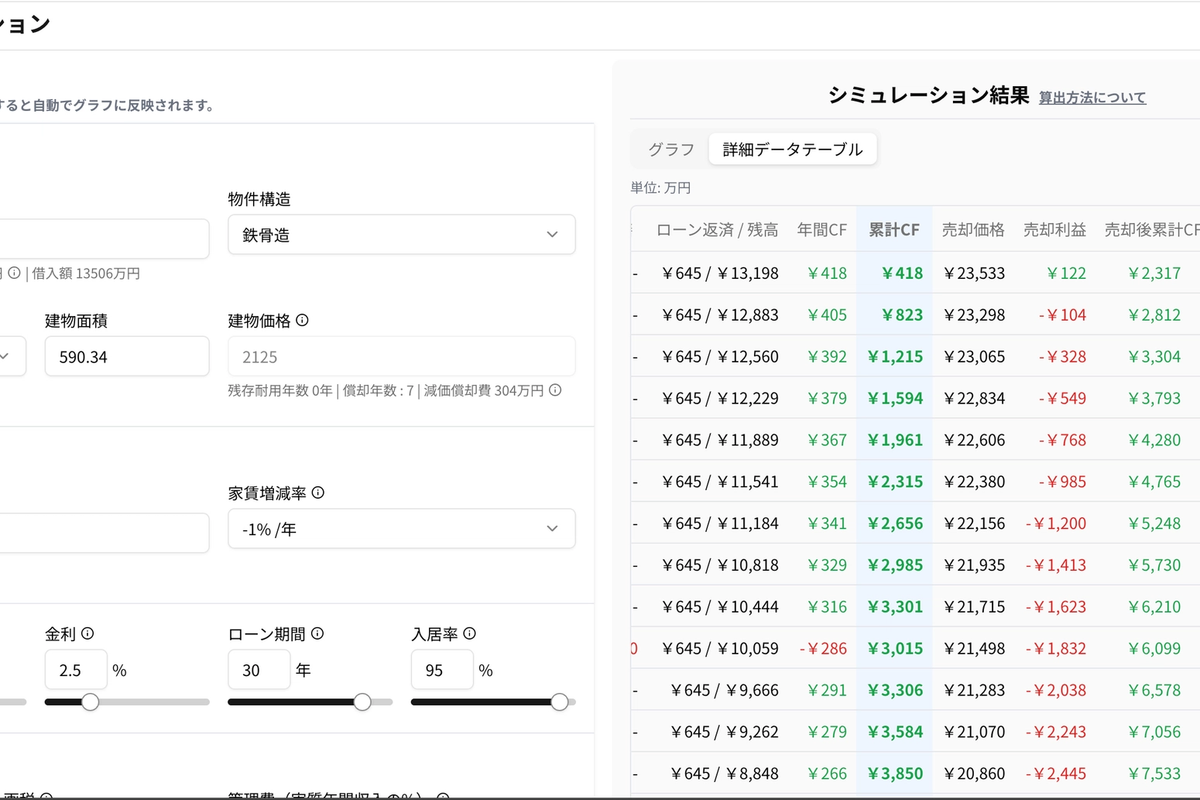
1. Scroll to the "CF Simulation (Cash Flow Estimate)" feature (Fig. 8).
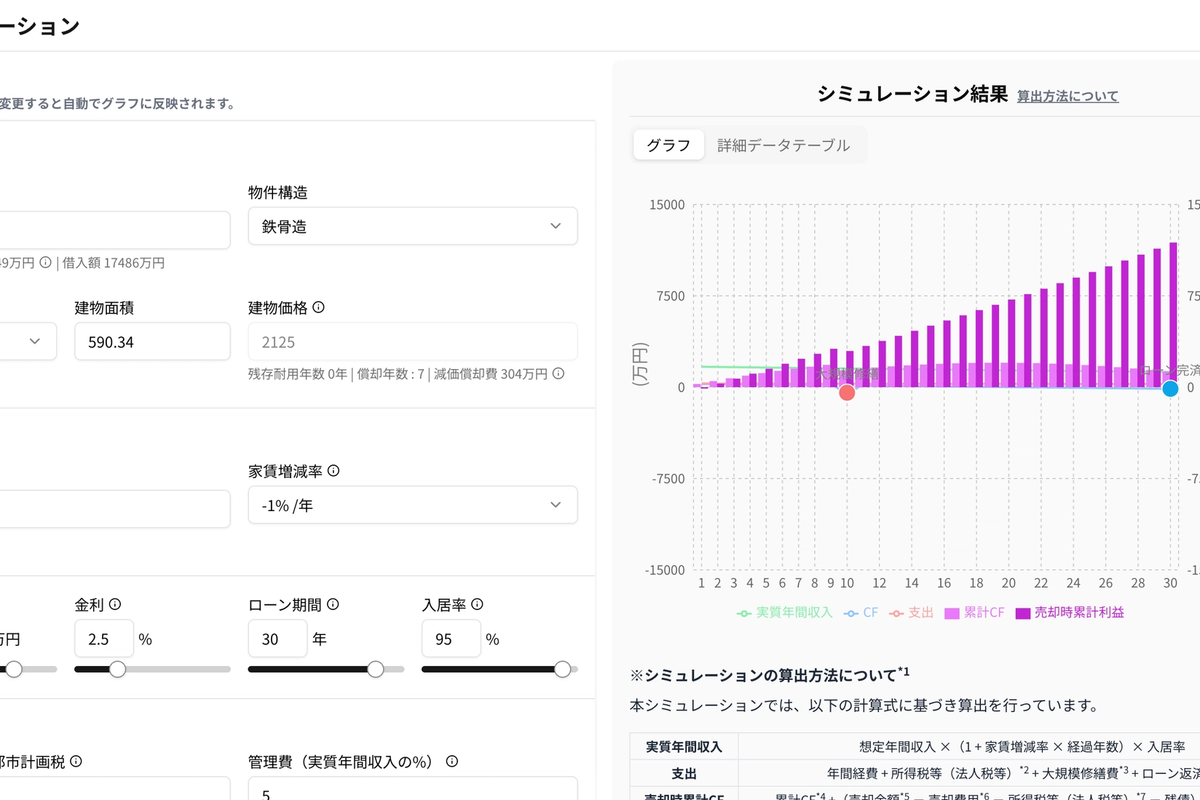
2. Set expected annual income to: JPY 16.23M × (1 + 8.8% rent increase) ≈ JPY 17.65M.
3. Adjust the expected exit cap rate to 7.5% (about 10% higher than the 6.81% average to reflect property age and listing/sale price divergence).
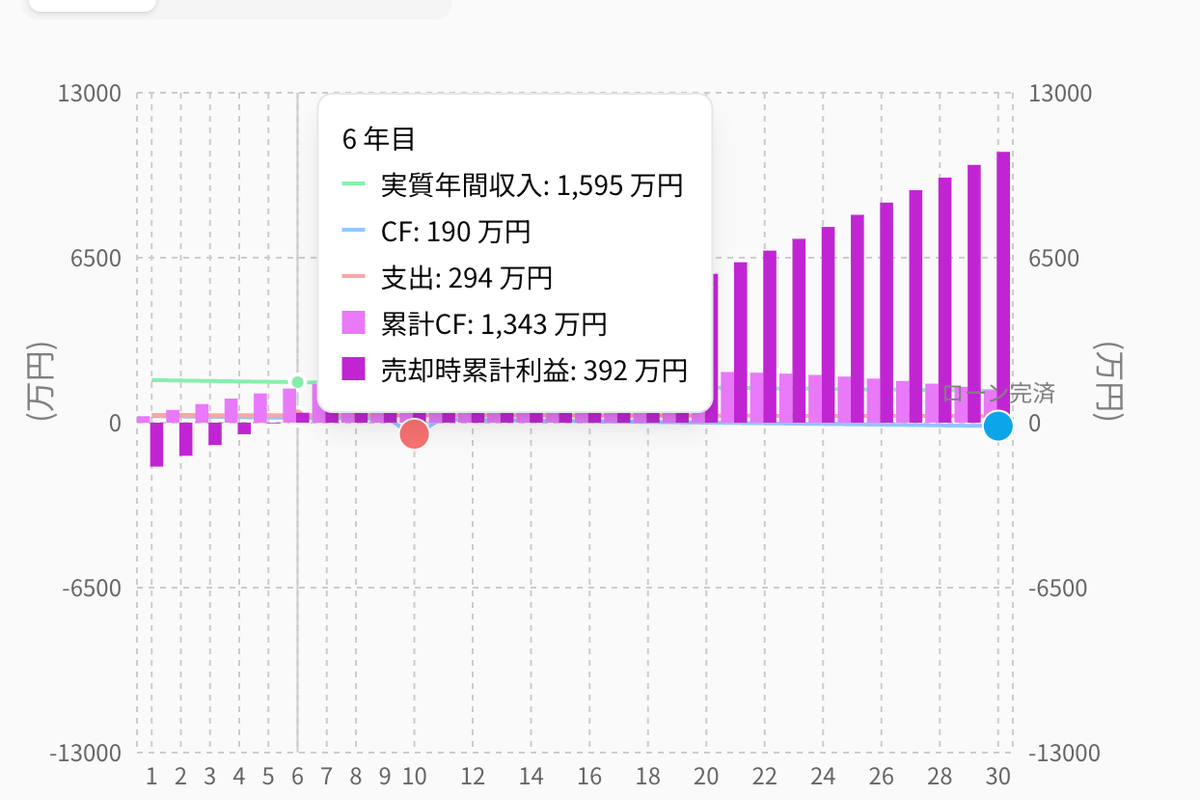
4. The simulation shows cash flow turns positive from Year 6 (Fig. 9); selling in any of the first five years results in an overall loss.
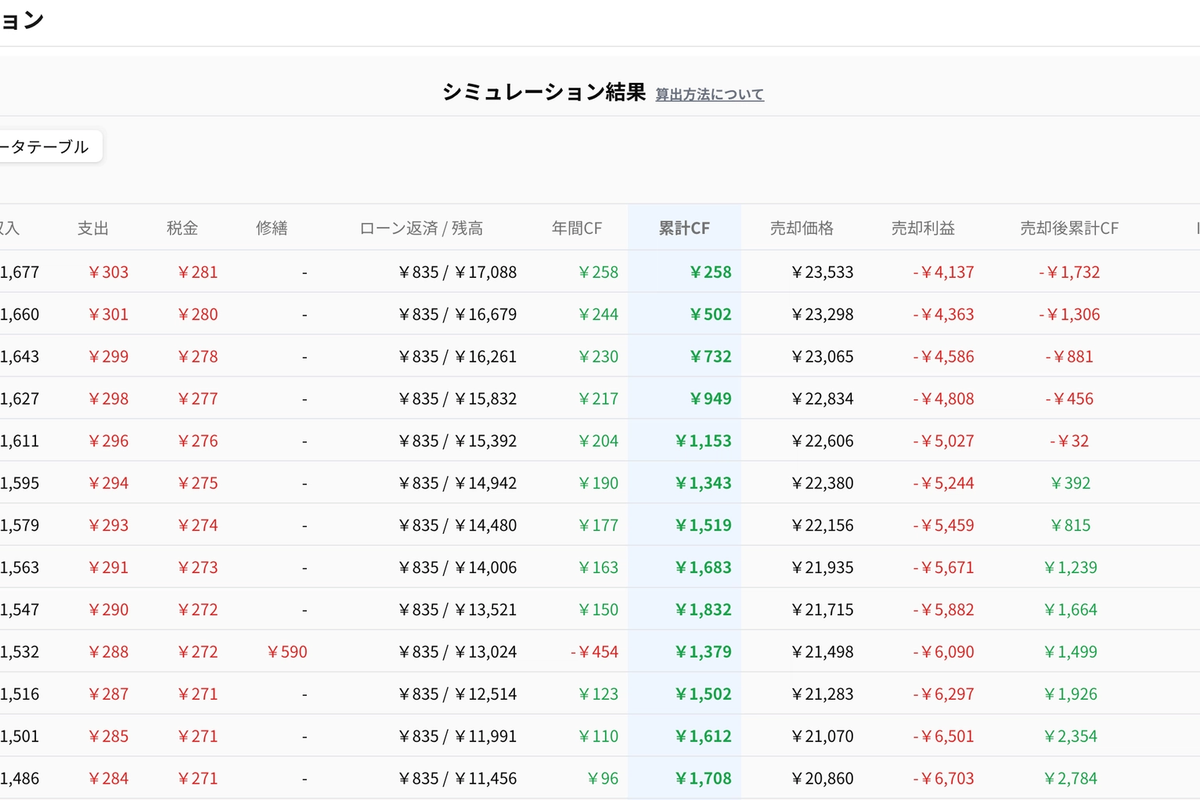
5. In the "Detailed Data Table", the highest internal rate of return (IRR) occurs if sold in Year 9 at approximately 2.52% (Fig. 10); other years are between 1–2%, which is very low.
6. To achieve a 10% IRR within five years, the purchase price would need to be reduced to approximately JPY 210 million (Fig. 11).
*IRR (Internal Rate of Return) is the annualized return that an investment generates on its own and is used to judge whether an investment is worthwhile. If it exceeds your required return, it is worth investing; if it is below your requirement, it is not attractive.
✅ Conclusion: Is This Property Worth Buying?
Price history: Typical resale/flipped listing with frequent price changes within one year
Current asking price: Estimated to be more than JPY 60 million higher than the previous purchase price
Yield: Clearly below the area average and unlikely to attract mainstream investors
Rent level: Below surrounding average with some room for operational improvement
Investment return: Requires a substantial price reduction to meet IRR targets
📌 Summary
If the price cannot be reduced below JPY 210 million, even with rent improvements long-term IRR would be only around 2%. Unless you have strong conviction about future appreciation in the area, we recommend caution.
If you would like a similar analysis for your property, sign up for a free Urbalytics trial:
👉 https://urbalytics.jp/login?tab=signUp
Or send us the property details and we will prepare a customized report for you 📩