Words: 857 | Estimated Reading Time: 5 minutes | Views: 1861
1. Why “building redevelopment plans” are a critical, often overlooked factor when evaluating area value
Japan’s real estate market is a dynamic blend of history and vitality, where new buildings and older houses frequently sit side by side to form lively, organic neighborhoods. As urban redevelopment accelerates across Japan, area values shift significantly with changes in infrastructure, new construction, and population flows. One of the most structurally influential drivers of these changes is the series of “building redevelopment plans” that continually renew and energize cities.
Building redevelopment plans generally refer to systematic reconstruction and reorganization of aging urban areas. Their objectives extend beyond improving land-use efficiency and safety; importantly, they reshape a district’s functions and image. Redevelopment typically brings changes such as:
Demolition of outdated structures and the introduction of modern residential and commercial facilities;
Improvements to transportation systems, enhancing commuting and traffic efficiency;
Creation of green spaces and public areas to improve the living environment;
Attraction of emerging industries and population inflows, stimulating the local economy.
These changes are directly reflected in land price trends, rent levels, housing demand, and property liquidity, and are therefore an important reference for assessing an area’s future potential.
Take Kitasenju in Adachi Ward as an example. Historically seen as a relatively affordable, traditional downtown residential area of Tokyo, a series of redevelopment projects since 2010 gradually transformed its positioning and appearance.
These initiatives include a large-scale commercial complex in front of the west exit of the station, improvements to roads and pedestrian spaces, the introduction of the Tokyo University of the Arts’ Senju campus, and multiple mixed-use developments combining office and residential functions. These updates not only improved the area’s environment but also attracted many young residents and emerging companies, generating strong residential demand and community vitality.
Over more than a decade, Kitasenju experienced continuous net population inflow, residential prices rose nearly 50% over ten years, rental demand remained stable, and vacancy rates were low. In SUUMO’s 2023 “Most Desired Towns (Tokyo) Ranking,” Kitasenju rose to 5th place. This demonstrates that redevelopment not only improves urban spaces but can also reconstruct an area’s value.
However, these “future changes” are often not obvious from the current streetscape and are difficult to grasp systematically. Information about building plans is typically filed with municipal building authorities by developers and is only posted as notices at the construction sites. When making cross-regional investment decisions, it is difficult to compile many of these scattered, non-public pieces of information.
Urbalytics developed the visualization of building redevelopment plans precisely to address this gap, helping users see the trajectory of area value before making real estate decisions.
2. Feature overview: Building Redevelopment Plans Map for the Greater Tokyo Area is now live
Urbalytics has launched the new “Building Redevelopment Plans” feature, which consolidates publicly available building and redevelopment project data from local governments across the Greater Tokyo area and visualizes it on a map, creating a forward-looking regional analysis tool.
Feature highlights:
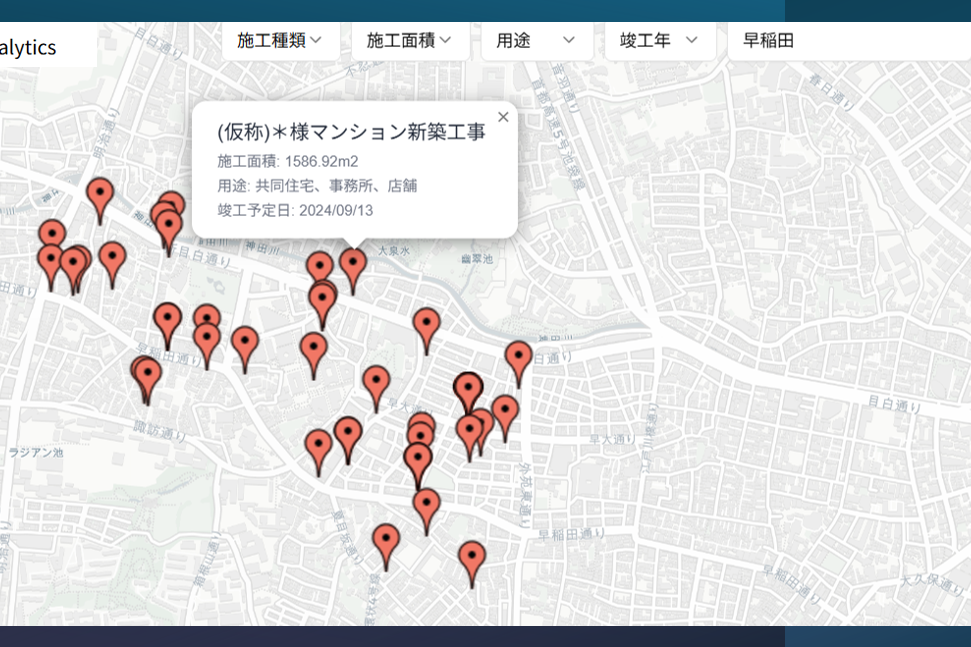
Map visualization: All projects are marked on the map with icons. Users can filter by area (address) and by use type (residential, commercial, medical, educational, public facilities, etc.).
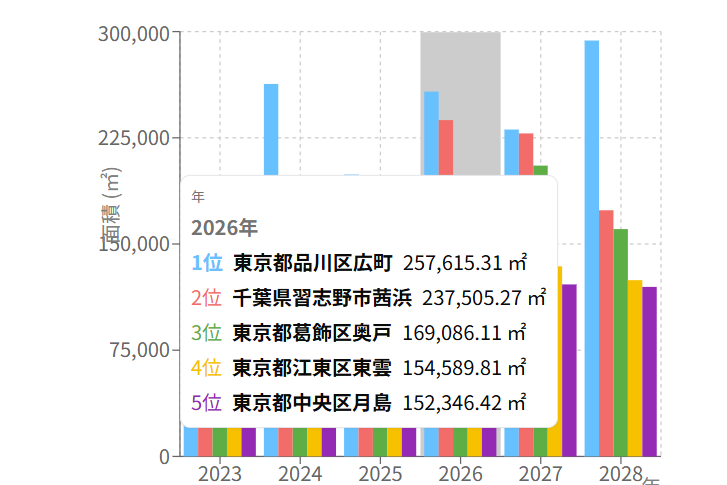
Regional statistics: The system automatically aggregates the number of projects, total floor area, and type composition for each area over the next five years, supporting cross-area comparisons.
Timeline management: Filter by expected completion date to grasp development timing and identify investment windows.
Integrated data analysis: Combine with Urbalytics’ existing datasets—rent trends, vacancy rates, and population movements—to build a more comprehensive regional assessment.
Currently, this feature covers Tokyo’s 23 wards and major urban areas in Kanagawa, Chiba, and Saitama, with monthly updates to ensure data timeliness and completeness.
3. Use cases: How this feature supports assessment and decision-making
Whether you are a first-time homebuyer or an investor focused on medium- to long-term asset allocation, you can benefit from this feature in the following key scenarios:
Owner-occupier purchase: When comparing properties across areas, users can identify which districts are likely to undergo significant changes over the next three to five years and prioritize locations with growth potential in addition to current lifestyle convenience.
Investment site selection: For investors seeking medium- to long-term opportunities, the redevelopment plans map helps identify areas that have not yet been fully priced by the market but stand to benefit from future redevelopment—enabling strategic, value-accretive positioning.
Multidimensional data fusion: Layer redevelopment plan data with rent trends, vacancy rates, household composition shifts, and other indicators to form a holistic view of an area’s growth potential, operational upside, and risk profile.
4. From “current location” to “future value” — making the leap
Real estate and area value are determined not only by present convenience but also by future trends. Truly forward-looking assessments should be based on how an area will evolve, not just on how it is today.
Urbalytics’ “Building Redevelopment Plans Map” is designed for precisely that purpose. By integrating data and visualizing it on a map, the “future of an area” becomes clear, comparable, and actionable.
Visit the Urbalytics platform to explore redevelopment activity in the areas you care about over the next five years and strengthen your housing and investment decisions.
Feature access: https://www.urbalytics.jp/it/kensetsu


![[Case Study] Using Urbalytics: 5 Steps to Spot Properties That Lose Money When Bought](/_next/image?url=https%3A%2F%2Fs3.ap-northeast-1.amazonaws.com%2Furbalytics.reins.downloads%2Fblog-images%2F1754997999806-982731cd13fd268aa2fef74c89904c1456a8f192-2074x1204.avif&w=3840&q=75)