Words: 914 | Estimated Reading Time: 5 minutes | Views: 15534
Harumi FLAG — the landmark development on the site of the Tokyo Olympic Village — has become a hot target for investors. In March this year, a unit bought for ¥70 million was resold in under a year for ¥150 million, temporarily setting a record high for that floor plan. That new high quickly became a market anchor: subsequent transactions for the same layout have only been higher.
Behind the frenzy, how sustainable is this buying-and-selling bonanza? Can rents support rapidly rising prices? Will prices continue to climb? Against a backdrop of anticipated rate hikes and weak rent growth, is this doubling‑your‑money investment game still one to join?
1. How did Harumi FLAG suddenly become an investment hotbed?
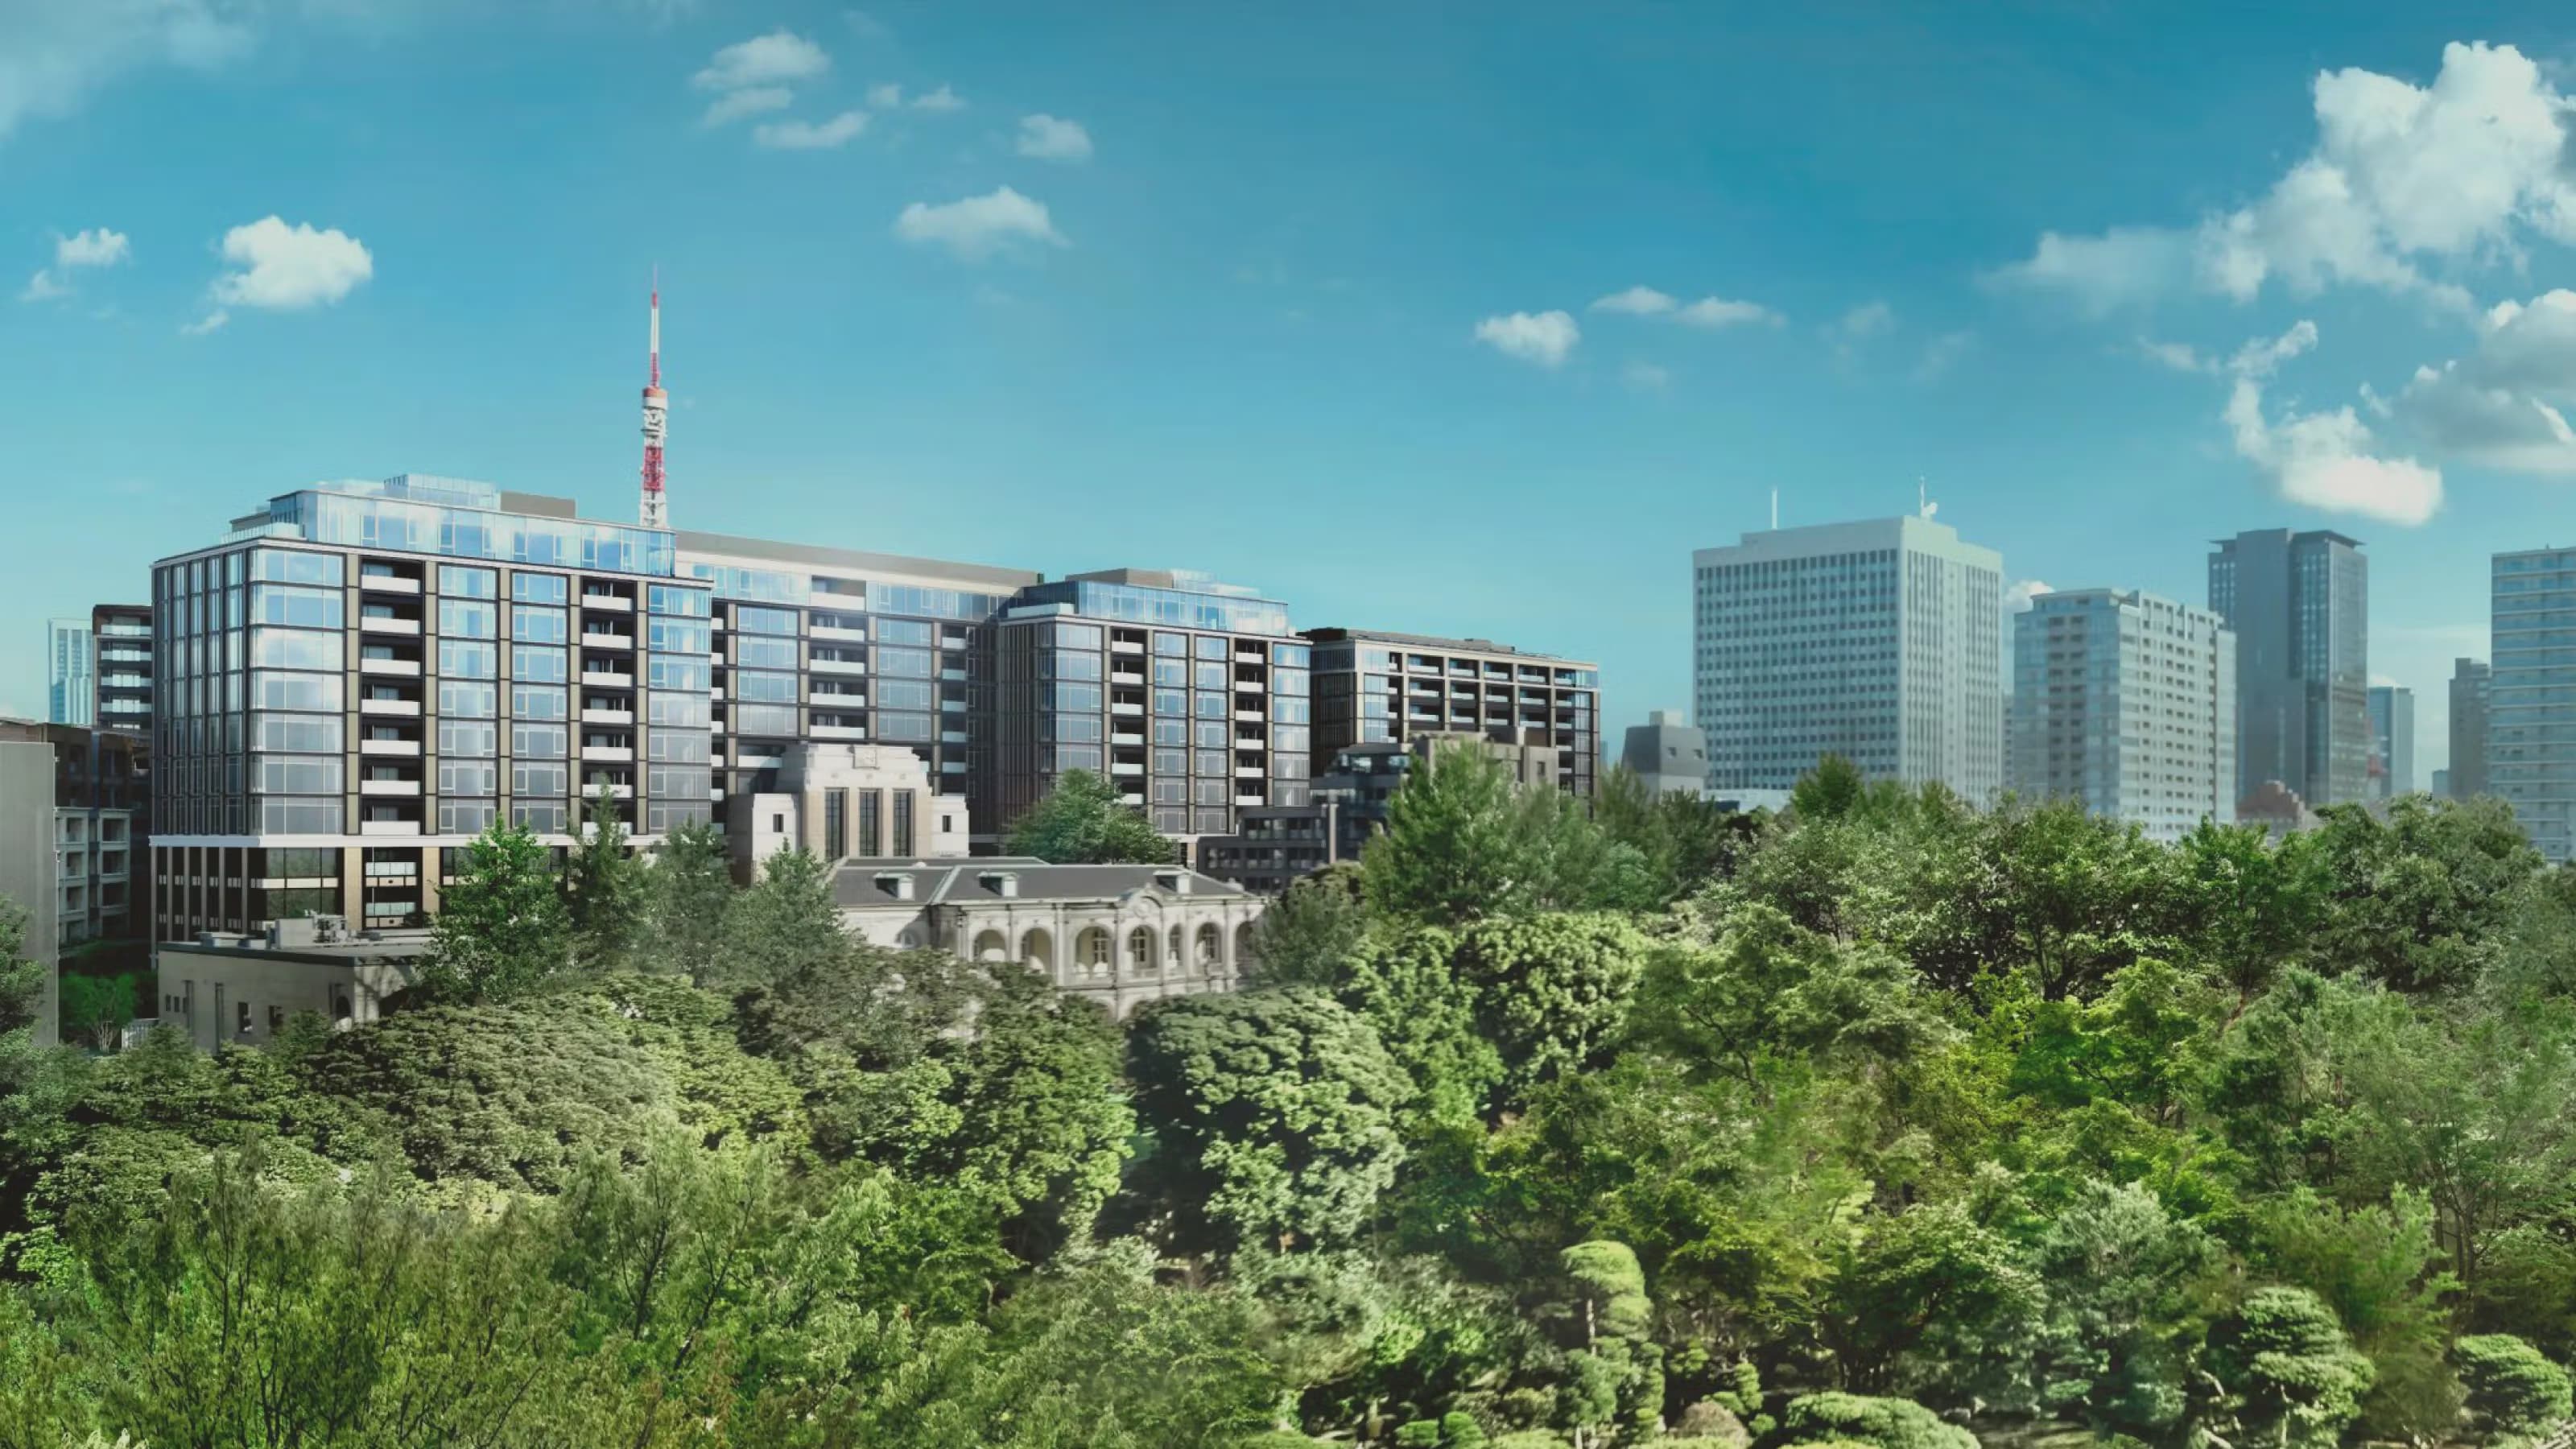
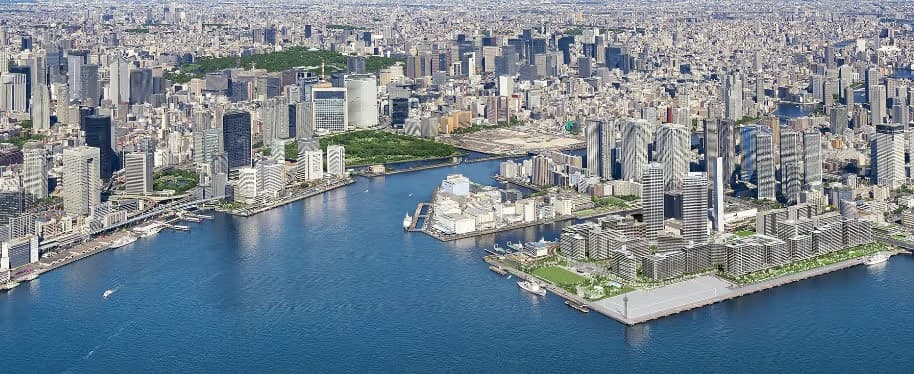
Harumi FLAG sits on the former Tokyo Olympic Village site and was developed under the Tokyo Metropolitan Government, with all handovers completed at the end of March last year. The large community of slab‑type high‑rise residential buildings was originally built to house athletes during the Olympics; afterwards it was sold as a new housing development. Post‑pandemic, however, it unexpectedly became a playground for capital players.
Normally, government‑led residential projects impose anti‑speculation rules at resale — banning corporate purchases, restricting resales and subletting, etc. Harumi FLAG, by contrast, was unusually permissive and effectively opened the door. The initial sale prices were also attractive: roughly ¥3 million per tsubo (1 tsubo = 3.3 m²), about 30% cheaper than nearby developments. That price gap naturally drew swarms of investors — one building reportedly saw 266 applicants for the same unit, evoking memories of the bubble era. NHK’s investigation found that in some buildings corporate buyers accounted for up to 40% of purchases, and individual investors sometimes snapped up six units at once. Clearly this is no longer driven by pure owner‑occupier demand.
2. Prices doubled — can rents keep up?
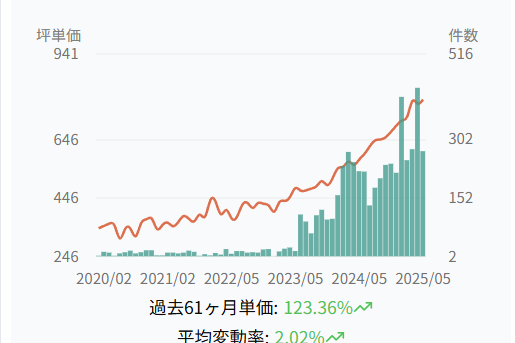
For the main floor plans (70–100 m²), the initial sale price was about ¥3 million per tsubo. In just one year, second‑hand listings have surged to ¥5–8 million per tsubo. For example, the unit mentioned at the top of this article that was bought for ¥70 million has now sold for over ¥150 million, and another 107 m² unit in the same building was listed as high as ¥270 million. These levels go beyond mere wishful thinking; many buyers at Harumi are clearly speculating rather than planning to live there.
However, letting these units is not so straightforward. Quoted rents generally run about ¥17,000–¥18,000 per tsubo. That translates to roughly ¥450,000 per month for a 27‑tsubo unit and about ¥580,000 per month for a 30‑tsubo unit. The problem is that Harumi’s location is not top‑tier, transport links are somewhat inconvenient, and surrounding amenities lag behind — all of which limit rental demand. Local brokers report that many units resold at higher prices are then listed for rent at correspondingly higher expectations, and some remain vacant for six months or longer. If you’re the buyer who paid a high price, can the expected rent and the time to lease realistically support your investment?
3. A sober look at returns — how long can investors stay optimistic?
From an investment perspective, returns come from operating income (rent) and capital gains (resale). Let’s run a few examples.
Case 1:
Area: 75 m² (approx. 23 tsubo); Total price: ¥158,000,000 (≈¥6.89 million/tsubo)
Expected rent: ¥18,000/tsubo/month → annual rent ≈ ¥4.5 million
Gross yield: 3.14%
Case 2:
Area: 107 m² (approx. 32 tsubo); Total price: ¥268,000,000 (≈¥8.26 million/tsubo)
Expected rent: ¥18,600/tsubo/month → annual rent ≈ ¥7.15 million
Gross yield: 2.7%
Note these yields exclude management fees, repair reserves, property tax and other costs — real net returns will be lower. In other words, relying on rental income alone, Harumi FLAG’s returns are hardly competitive in today’s market. So is counting on future resale gains realistic? Suppose a property is bought for ¥100 million with annual rent of ¥4.5 million (a 4.5% gross yield). In theory:
If a buyer is willing to accept a 3.5% yield, the price could rise to ¥128.57 million;
If compressed to a 2.5% yield, the price could rise to ¥180 million;
In an extreme case where a buyer accepts a 0.5% yield, the theoretical price could be as high as ¥900 million.
The underlying logic is clear: buy high now, hoping someone later will accept an even lower yield. But how long can this game continue?
Currently, the Bank of Japan has signaled a sustained move toward higher interest rates. As rates rise, overseas investors who entered the market during the yen’s weakness may hit the brakes. A more grounded issue is that Japan’s rental market is not especially landlord‑friendly, and relatively few tenants will pay ¥500,000–¥1,000,000 per month. With few transactions at the hoped‑for rent levels, relying on rent increases looks increasingly like a pipe dream.
4. Conclusion
Harumi FLAG is both a showcase of Japan’s urban renewal and redevelopment capabilities and a mirror reflecting the logic of the current housing market. It carries the shine of asset appreciation but also conceals problems that cannot be ignored: low rental yields, rising interest‑rate risk, and supply‑demand mismatches.
Harumi FLAG symbolizes Japan’s post‑pandemic economic recovery from deflation toward normal inflation dynamics. Its importance to Tokyo’s housing market and the Japanese economy is undeniable, but we must recognize that the hot‑potato game will end. Property prices cannot be sustained by high‑price resales alone and must ultimately return to the fundamentals of sustainable income.
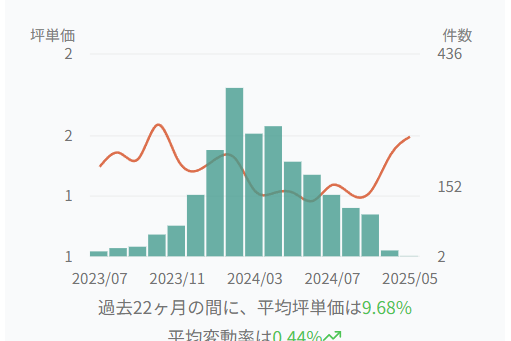
Data source: Urbalytics apartment data lookup: Harumi area