
Kanagawa-ku, Yokohama, Kanagawa income buildings market report
Record counts, unit-price trends and a comparison against the Kanagawa average, aggregated monthly by Urbalytics for income buildings listed in Kanagawa-ku, Yokohama, Kanagawa. Latest month: September 2026.
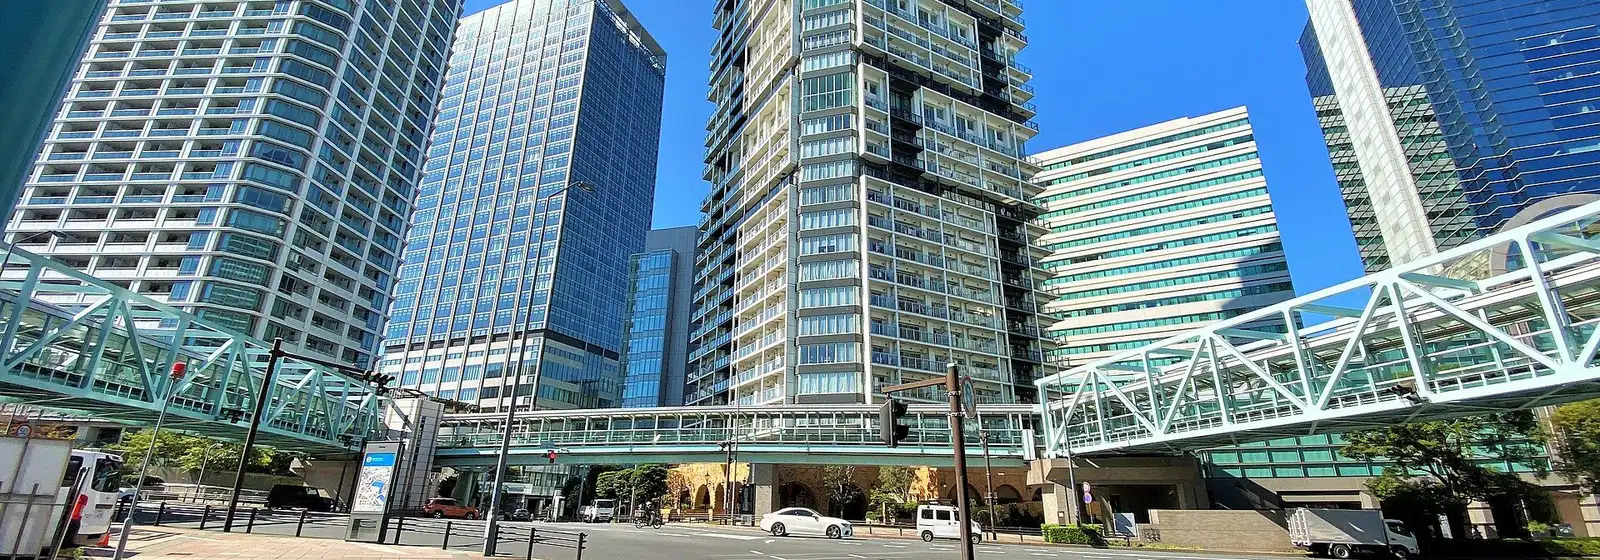
YokohamaPortside·De101574/CC BY-SA 4.0 (cropped)·Wikimedia Commons
Kanagawa-ku, Yokohama, Kanagawa income buildings|overview
#Counts are income buildings listings in Kanagawa-ku, Yokohama, Kanagawa for which a price could be obtained (on the market and closed). The commentary is derived mechanically from the figures on this page.
What the data says
- At 179.5 ¥10k/tsubo, Price per tsubo of floor area for income buildings in Kanagawa-ku, Yokohama, Kanagawa is the 7th highest of the 32 municipalities Kanagawa publishes (ranked 7 of 32). The highest is 272.4 ¥10k/tsubo, the lowest 82.0 ¥10k/tsubo.
- As of September 2026, Gross yield for income buildings in Kanagawa-ku, Yokohama, Kanagawa is 6.00% — 70bps below the Kanagawa average of 6.70% (33 records).
- As of September 2026, Price per tsubo of floor area for income buildings in Kanagawa-ku, Yokohama, Kanagawa is 175.9 ¥10k/tsubo — 30.1% above the Kanagawa average of 135.2 ¥10k/tsubo (33 records).
income buildings: gross yield over time
#Gross yield = annual income ÷ asking price, before operating costs and vacancy. With rent held constant, a falling yield means a rising price.
Income building — Gross yield over time
Gross yield = annual income ÷ asking price, before operating costs and vacancy. With rent held constant, a falling yield means a rising price.
| Month | Kanagawa-ku, Yokohama | Kanagawa | Difference (bps) | Records |
|---|---|---|---|---|
| 2026年9月 | 6.00 | 6.70 | −70bps | 33 |
| 2026年8月 | 6.49 | 6.51 | −2bps | 36 |
| 2026年7月 | 6.56 | 6.69 | −13bps | 18 |
| 2026年6月 | 6.42 | 6.69 | −27bps | 26 |
| 2026年5月 | 5.76 | 6.65 | −89bps | 33 |
| 2026年4月 | — | — | — | 26 |
| 2026年3月 | 6.00 | 6.65 | −65bps | 39 |
| 2026年2月 | 6.00 | 6.70 | −70bps | 26 |
| 2026年1月 | 6.16 | 6.70 | −54bps | 41 |
| 2025年12月 | 6.39 | 6.68 | −29bps | 50 |
| 2025年11月 | 6.47 | 6.79 | −32bps | 57 |
| 2025年10月 | 6.40 | 6.88 | −48bps | 57 |
| 2025年9月 | 6.86 | 6.87 | −2bps | 36 |
| 2025年8月 | 6.16 | 6.87 | −71bps | 44 |
| 2025年7月 | 6.50 | 6.87 | −37bps | 49 |
| 2025年6月 | 6.26 | 6.74 | −48bps | 45 |
| 2025年5月 | 6.31 | 6.80 | −49bps | 57 |
| 2025年4月 | 6.49 | 6.95 | −46bps | 73 |
| 2025年3月 | 6.67 | 6.70 | −3bps | 26 |
| 2025年2月 | 6.00 | 6.70 | −70bps | 36 |
| 2025年1月 | 6.10 | 6.91 | −81bps | 29 |
| 2024年12月 | 6.47 | 6.92 | −44bps | 29 |
| 2024年11月 | 6.70 | 6.79 | −9bps | 29 |
| 2024年10月 | 6.46 | 6.90 | −44bps | 34 |
| 2024年9月 | 6.54 | 6.90 | −37bps | 30 |
| 2024年8月 | 6.61 | 6.94 | −33bps | 33 |
| 2024年7月 | 6.75 | 7.00 | −25bps | 43 |
| 2024年6月 | 6.67 | 7.00 | −33bps | 37 |
| 2024年5月 | 6.59 | 7.00 | −41bps | 36 |
| 2024年4月 | 6.59 | 7.12 | −53bps | 26 |
| 2024年3月 | 6.43 | 7.00 | −57bps | 25 |
| 2024年2月 | 6.94 | 7.02 | −9bps | 21 |
| 2024年1月 | 6.59 | 6.98 | −39bps | 20 |
| 2023年12月 | 6.64 | 6.90 | −26bps | 25 |
| 2023年11月 | 6.49 | 7.08 | −59bps | 29 |
| 2023年10月 | 6.55 | 7.00 | −45bps | 40 |
| 2023年9月 | 6.80 | 7.10 | −30bps | 25 |
| 2023年8月 | 6.40 | 7.05 | −65bps | 14 |
| 2023年7月 | 6.30 | 7.00 | −70bps | 17 |
| 2023年6月 | 6.10 | 7.20 | −110bps | 16 |
| 2023年5月 | 6.49 | 7.10 | −61bps | 11 |
| 2023年4月 | — | 7.30 | — | 9 |
| 2023年3月 | — | 7.25 | — | 8 |
| 2023年2月 | — | 7.27 | — | 4 |
| 2023年1月 | — | 7.20 | — | 7 |
| 2022年12月 | 8.00 | 7.35 | +65bps | 14 |
April 2026 is a collection gap: One of our sources (Rakumachi) could not be collected for April 2026 alone, so the record count reads about 35% below the real figure. This is not a move in the market. That month is excluded from the trend and is not interpolated.
Source: monthly aggregates of listing and rental-offer data collected by Urbalytics
Conditions
- Source: listings Urbalytics collects (on the market and closed)
- Publication threshold: figures shown only for months with 10 or more records
- Statistic: median (P20–P80 is the 20th to 80th percentile). Outliers removed by the IQR method
- In a thin month (10–30 records) both the median and the P20–P80 band move on a single listing. Read them alongside the record count shown next to each figure.
- Period: from 12 2022 — the window over which each property type is aggregated independently
What the data says
- As of September 2026, Gross yield for income buildings in Kanagawa-ku, Yokohama, Kanagawa is 6.00% — 70bps below the Kanagawa average of 6.70% (33 records).
- From December 2022 to September 2026, Gross yield for income buildings in Kanagawa-ku, Yokohama, Kanagawa went from 8.00% to 6.00% — down (−200bps).
asking price and area for income buildings
#Income building — Asking price and Price per tsubo of floor area over time
Asking price = the median of prices published to the market. Read as a series, the level of the total shows where the market is moving.
Price per tsubo of floor area = asking price ÷ floor area. What the property is asking per unit of space (1 tsubo ≈ 3.31㎡).
Asking price
Unit: ¥10kPrice per tsubo of floor area
Unit: ¥10k/tsubo| Month | Asking price — Kanagawa-ku, Yokohama | Asking price — Kanagawa | Difference (Asking price) | Price per tsubo of floor area — Kanagawa-ku, Yokohama | Price per tsubo of floor area — Kanagawa | Records |
|---|---|---|---|---|---|---|
| 2026年9月 | 9,000 | 8,495 | +5.9% | 175.9 | 135.2 | 33 |
| 2026年8月 | 6,980 | 8,850 | −21.1% | 199.7 | 142.1 | 36 |
| 2026年7月 | 7,670 | 8,096 | −5.3% | 161.7 | 131.6 | 18 |
| 2026年6月 | 8,073 | 8,310 | −2.9% | 193.1 | 134.9 | 26 |
| 2026年5月 | 9,000 | 8,000 | +12.5% | 197.0 | 142.5 | 33 |
| 2026年4月 | — | — | — | — | — | 26 |
| 2026年3月 | 12,000 | 8,393 | +43.0% | 190.4 | 136.2 | 39 |
| 2026年2月 | 13,920 | 7,740 | +79.8% | 209.3 | 133.9 | 26 |
| 2026年1月 | 9,620 | 7,920 | +21.5% | 181.8 | 140.2 | 41 |
| 2025年12月 | 9,310 | 8,640 | +7.8% | 169.9 | 137.9 | 50 |
| 2025年11月 | 8,805 | 8,000 | +10.1% | 177.5 | 140.2 | 57 |
| 2025年10月 | 8,580 | 7,200 | +19.2% | 191.1 | 130.2 | 57 |
| 2025年9月 | 8,500 | 7,800 | +9.0% | 175.5 | 139.5 | 36 |
| 2025年8月 | 8,080 | 7,965 | +1.4% | 191.1 | 140.2 | 44 |
| 2025年7月 | 7,723 | 8,200 | −5.8% | 152.7 | 139.2 | 49 |
| 2025年6月 | 7,646 | 8,080 | −5.4% | 190.1 | 147.8 | 45 |
| 2025年5月 | 9,980 | 7,400 | +34.9% | 193.7 | 134.5 | 57 |
| 2025年4月 | 10,920 | 7,190 | +51.9% | 181.2 | 126.3 | 73 |
| 2025年3月 | 8,980 | 7,480 | +20.1% | 195.7 | 132.2 | 26 |
| 2025年2月 | 15,000 | 8,900 | +68.5% | 209.3 | 140.2 | 36 |
| 2025年1月 | 12,570 | 8,800 | +42.8% | 197.0 | 137.2 | 29 |
| 2024年12月 | 8,819 | 8,130 | +8.5% | 185.1 | 138.2 | 29 |
| 2024年11月 | 7,613 | 8,615 | −11.6% | 180.5 | 138.5 | 29 |
| 2024年10月 | 10,000 | 7,980 | +25.3% | 185.1 | 138.2 | 34 |
| 2024年9月 | 7,570 | 7,800 | −2.9% | 181.8 | 131.2 | 30 |
| 2024年8月 | 7,543 | 7,490 | +0.7% | 185.1 | 129.6 | 33 |
| 2024年7月 | 6,280 | 6,960 | −9.8% | 178.8 | 131.9 | 43 |
| 2024年6月 | 6,430 | 7,230 | −11.1% | 184.5 | 125.6 | 37 |
| 2024年5月 | 6,400 | 7,200 | −11.1% | 194.7 | 131.9 | 36 |
| 2024年4月 | 9,948 | 7,685 | +29.4% | 187.1 | 126.6 | 26 |
| 2024年3月 | 10,598 | 8,480 | +25.0% | 184.8 | 127.6 | 25 |
| 2024年2月 | 13,200 | 8,010 | +64.8% | 171.2 | 122.3 | 21 |
| 2024年1月 | 8,500 | 8,490 | +0.1% | 199.3 | 130.6 | 20 |
| 2023年12月 | 8,500 | 8,200 | +3.7% | 181.8 | 122.3 | 25 |
| 2023年11月 | 11,000 | 8,210 | +34.0% | 180.8 | 125.0 | 29 |
| 2023年10月 | 9,980 | 8,625 | +15.7% | 183.8 | 132.2 | 40 |
| 2023年9月 | 9,505 | 8,500 | +11.8% | 170.2 | 124.0 | 25 |
| 2023年8月 | 9,900 | 8,000 | +23.8% | 154.0 | 125.0 | 14 |
| 2023年7月 | 11,250 | 9,080 | +23.9% | 145.8 | 123.6 | 17 |
| 2023年6月 | 12,330 | 7,615 | +61.9% | 158.3 | 126.6 | 16 |
| 2023年5月 | 9,470 | 7,955 | +19.0% | 176.2 | 134.5 | 11 |
| 2023年4月 | — | 9,000 | — | — | 122.3 | 9 |
| 2023年3月 | — | 8,940 | — | — | 111.4 | 8 |
| 2023年2月 | — | 8,930 | — | — | 116.4 | 4 |
| 2023年1月 | — | 8,225 | — | — | 103.5 | 7 |
| 2022年12月 | 6,600 | 7,950 | −17.0% | 146.4 | 114.7 | 14 |
April 2026 is a collection gap: One of our sources (Rakumachi) could not be collected for April 2026 alone, so the record count reads about 35% below the real figure. This is not a move in the market. That month is excluded from the trend and is not interpolated.
Source: monthly aggregates of listing and rental-offer data collected by Urbalytics
Conditions
- Source: listings Urbalytics collects (on the market and closed)
- Publication threshold: figures shown only for months with 10 or more records
- Statistic: median (P20–P80 is the 20th to 80th percentile). Outliers removed by the IQR method
- In a thin month (10–30 records) both the median and the P20–P80 band move on a single listing. Read them alongside the record count shown next to each figure.
- Period: from 12 2022 — the window over which each property type is aggregated independently
What the data says
- As of September 2026, Price per tsubo of floor area for income buildings in Kanagawa-ku, Yokohama, Kanagawa is 175.9 ¥10k/tsubo — 30.1% above the Kanagawa average of 135.2 ¥10k/tsubo (33 records).
- From December 2022 to September 2026, Price per tsubo of floor area for income buildings in Kanagawa-ku, Yokohama, Kanagawa went from 146.4 ¥10k/tsubo to 175.9 ¥10k/tsubo — up (+20.1%).
- From December 2022 to September 2026, Asking price for income buildings in Kanagawa-ku, Yokohama, Kanagawa went from 6,600 ¥10k to 9,000 ¥10k — up (+36.4%).
Income building — Floor area and Land area over time
Floor area = the median Floor area among listed properties. At the same Price per tsubo of floor area, more space still means a higher total — which is why this is read alongside the price series. (1 tsubo ≈ 3.31㎡)
Land area = the median land area among listed properties. It is the denominator under the per-tsubo buildable price, and Within one area, a change in plot size moves the total. (1 tsubo ≈ 3.31㎡)
Floor area
Unit: tsuboLand area
Unit: tsubo| Month | Floor area — Kanagawa-ku, Yokohama | Floor area — Kanagawa | Difference (Floor area) | Land area — Kanagawa-ku, Yokohama | Land area — Kanagawa | Records |
|---|---|---|---|---|---|---|
| 2026年9月 | 49.4 | 60.1 | −17.8% | 40.6 | 51.1 | 33 |
| 2026年8月 | 44.0 | 59.9 | −26.6% | 50.6 | 51.9 | 36 |
| 2026年7月 | 44.0 | 55.1 | −20.2% | 41.4 | 52.1 | 18 |
| 2026年6月 | 44.0 | 60.0 | −26.6% | 45.9 | 52.7 | 26 |
| 2026年5月 | 44.0 | 58.5 | −24.9% | 41.5 | 50.9 | 33 |
| 2026年4月 | — | — | — | — | — | 26 |
| 2026年3月 | 60.3 | 59.1 | +1.9% | 51.4 | 54.5 | 39 |
| 2026年2月 | 55.2 | 58.5 | −5.6% | 52.2 | 54.8 | 26 |
| 2026年1月 | 51.7 | 54.6 | −5.4% | 47.1 | 52.1 | 41 |
| 2025年12月 | 53.3 | 57.1 | −6.6% | 49.8 | 53.5 | 50 |
| 2025年11月 | 48.8 | 55.5 | −12.2% | 38.1 | 51.5 | 57 |
| 2025年10月 | 46.0 | 56.7 | −18.9% | 45.4 | 50.8 | 57 |
| 2025年9月 | 44.6 | 55.0 | −18.9% | 45.4 | 51.0 | 36 |
| 2025年8月 | 51.2 | 55.9 | −8.4% | 37.8 | 50.5 | 44 |
| 2025年7月 | 47.7 | 55.5 | −14.0% | 46.7 | 50.8 | 49 |
| 2025年6月 | 55.5 | 55.7 | −0.4% | 49.8 | 52.7 | 45 |
| 2025年5月 | 47.9 | 50.5 | −5.3% | 41.6 | 50.0 | 57 |
| 2025年4月 | 61.5 | 50.3 | +22.2% | 48.6 | 48.0 | 73 |
| 2025年3月 | 41.9 | 52.1 | −19.6% | 34.1 | 50.0 | 26 |
| 2025年2月 | 46.5 | 59.9 | −22.4% | 36.5 | 51.6 | 36 |
| 2025年1月 | 61.5 | 59.9 | +2.6% | 45.4 | 54.3 | 29 |
| 2024年12月 | 45.4 | 56.6 | −19.8% | 42.6 | 54.6 | 29 |
| 2024年11月 | 48.8 | 59.1 | −17.5% | 44.3 | 53.7 | 29 |
| 2024年10月 | 51.4 | 56.2 | −8.6% | 45.4 | 52.7 | 34 |
| 2024年9月 | 43.6 | 55.8 | −21.8% | 45.4 | 53.3 | 30 |
| 2024年8月 | 47.2 | 55.1 | −14.4% | 37.4 | 52.4 | 33 |
| 2024年7月 | 37.1 | 51.5 | −27.8% | 36.6 | 48.5 | 43 |
| 2024年6月 | 36.4 | 52.4 | −30.6% | 37.8 | 50.0 | 37 |
| 2024年5月 | 33.5 | 51.7 | −35.2% | 37.1 | 48.5 | 36 |
| 2024年4月 | 54.0 | 56.2 | −3.9% | 39.6 | 51.9 | 26 |
| 2024年3月 | 43.0 | 60.3 | −28.6% | 50.9 | 55.8 | 25 |
| 2024年2月 | 63.3 | 60.5 | +4.8% | 52.1 | 55.4 | 21 |
| 2024年1月 | 49.8 | 60.3 | −17.5% | 42.8 | 55.8 | 20 |
| 2023年12月 | 49.8 | 60.9 | −18.2% | 55.7 | 53.3 | 25 |
| 2023年11月 | 56.7 | 61.8 | −8.3% | 56.4 | 54.2 | 29 |
| 2023年10月 | 53.5 | 61.0 | −12.3% | 58.1 | 56.4 | 40 |
| 2023年9月 | 57.2 | 65.6 | −12.9% | 53.2 | 53.9 | 25 |
| 2023年8月 | 55.7 | 56.2 | −0.8% | 42.9 | 55.7 | 14 |
| 2023年7月 | 76.9 | 63.1 | +21.8% | 60.2 | 59.2 | 17 |
| 2023年6月 | 86.8 | 55.4 | +56.8% | 54.4 | 54.5 | 16 |
| 2023年5月 | 43.1 | 54.0 | −20.1% | 64.8 | 50.8 | 11 |
| 2023年4月 | — | 64.4 | — | — | 59.7 | 9 |
| 2023年3月 | — | 71.7 | — | — | 64.5 | 8 |
| 2023年2月 | — | 66.1 | — | — | 56.9 | 4 |
| 2023年1月 | — | 62.9 | — | — | 60.0 | 7 |
| 2022年12月 | 49.5 | 57.0 | −13.2% | 48.8 | 55.7 | 14 |
April 2026 is a collection gap: One of our sources (Rakumachi) could not be collected for April 2026 alone, so the record count reads about 35% below the real figure. This is not a move in the market. That month is excluded from the trend and is not interpolated.
Source: monthly aggregates of listing and rental-offer data collected by Urbalytics
Conditions
- Source: listings Urbalytics collects (on the market and closed)
- Area: building area is gross floor area (exclusive area for condominium units); land area is the registered figure
- Publication threshold: figures shown only for months with 10 or more records
- Statistic: median (P20–P80 is the 20th to 80th percentile)
- Unit: tsubo (1 tsubo ≈ 3.31㎡), matched to the unit the per-tsubo price multiplies against
What the data says
- As of September 2026, Floor area for income buildings in Kanagawa-ku, Yokohama, Kanagawa is 49.4tsubo — 17.8% below the Kanagawa average of 60.1tsubo (33 records).
- As of September 2026, land area for income buildings in Kanagawa-ku, Yokohama, Kanagawa is 40.6tsubo — 20.4% below the Kanagawa average of 51.1tsubo (33 records).
Asking rent and area over time
#Total rent = monthly rent + common charges; rent per unit area is that divided by area. Area is the variable between the two — a month where only the total moved is a month where the space on offer changed, not the price.
Sign up free to see all the data
Detailed distributions and trends are available on a free account.
income buildings: listings over time
#Sign up free to see all the data
Detailed distributions and trends are available on a free account.
Figures on this page are derived statistics: monthly aggregates of listing and rental-offer data collected by Urbalytics. They are not individual transaction records.
Income building prices by station in Kanagawa-ku, Yokohama, Kanagawa
Stations in Kanagawa-ku, Yokohama, Kanagawa, most data first. Each is aggregated over listings within walking distance of the station.
- Oguchi Station36,440/day3 types49September 2026
- Katakuracho Station20,510/day3 types48September 2026
- Hakuraku Station39,922/day3 types36September 2026
- Hazawa Yokohama-Kokudai Station31,622/day2 types36September 2026
- Higashi-Kanagawa Station89,717/day2 types32September 2026
- Mitsuzawa-shimocho Station11,953/day3 types31September 2026


Station photographs from Wikimedia Commons (author and licence are given on each station’s own report page).
Income building prices in areas near Kanagawa-ku, Yokohama, Kanagawa
Municipalities with a Income building report, nearest to Kanagawa-ku, Yokohama, Kanagawa first. Distance is measured between municipality centres.
- 横浜市西区3.1km22September 2026
- 横浜市保土ケ谷区4.8km26September 2026
- 横浜市港北区4.9km33September 2026
- 横浜市中区5.2km26September 2026
- 横浜市鶴見区5.4km37September 2026
- 横浜市南区5.7km47September 2026

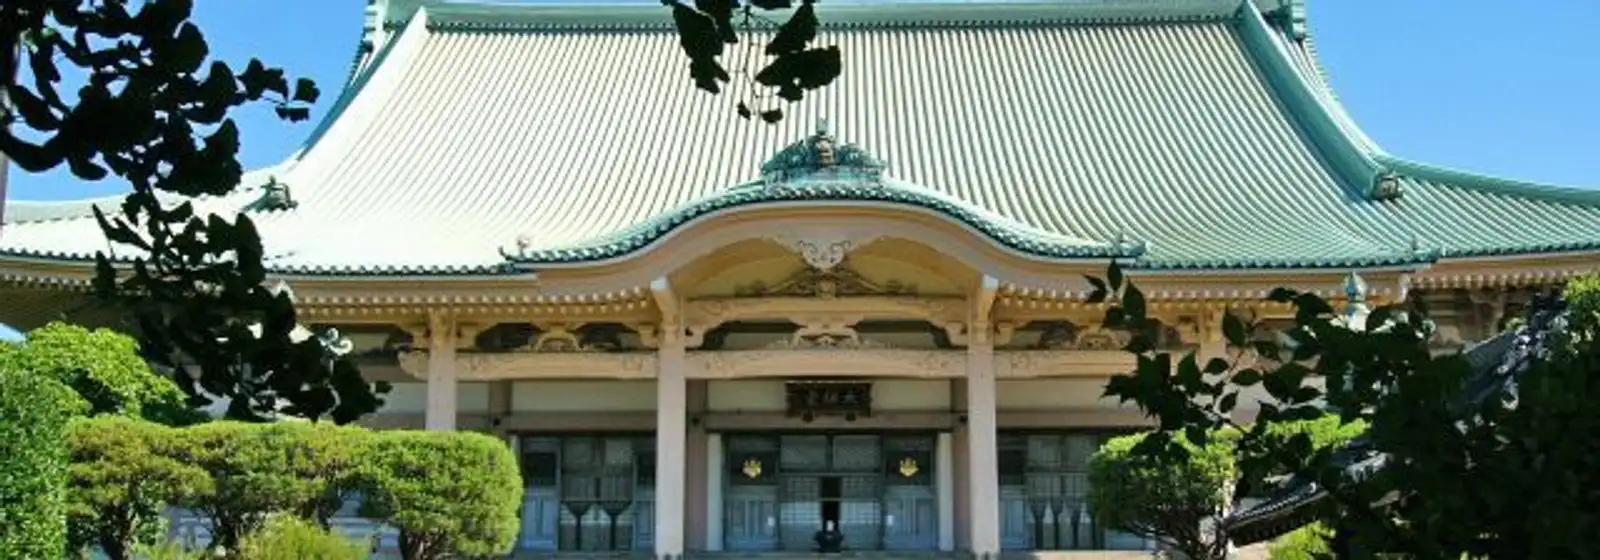

Area photographs from Wikimedia Commons (author and licence for each are given on that area’s own report page).
Prices by postal code in Kanagawa-ku, Yokohama, Kanagawa
Postal codes in Kanagawa-ku, Yokohama, Kanagawa, most data first. Counts are sale and rental records across the period.
Articles on Kanagawa-ku, Yokohama, Kanagawa
Urbalytics analysis written about Kanagawa-ku, Yokohama, Kanagawa.
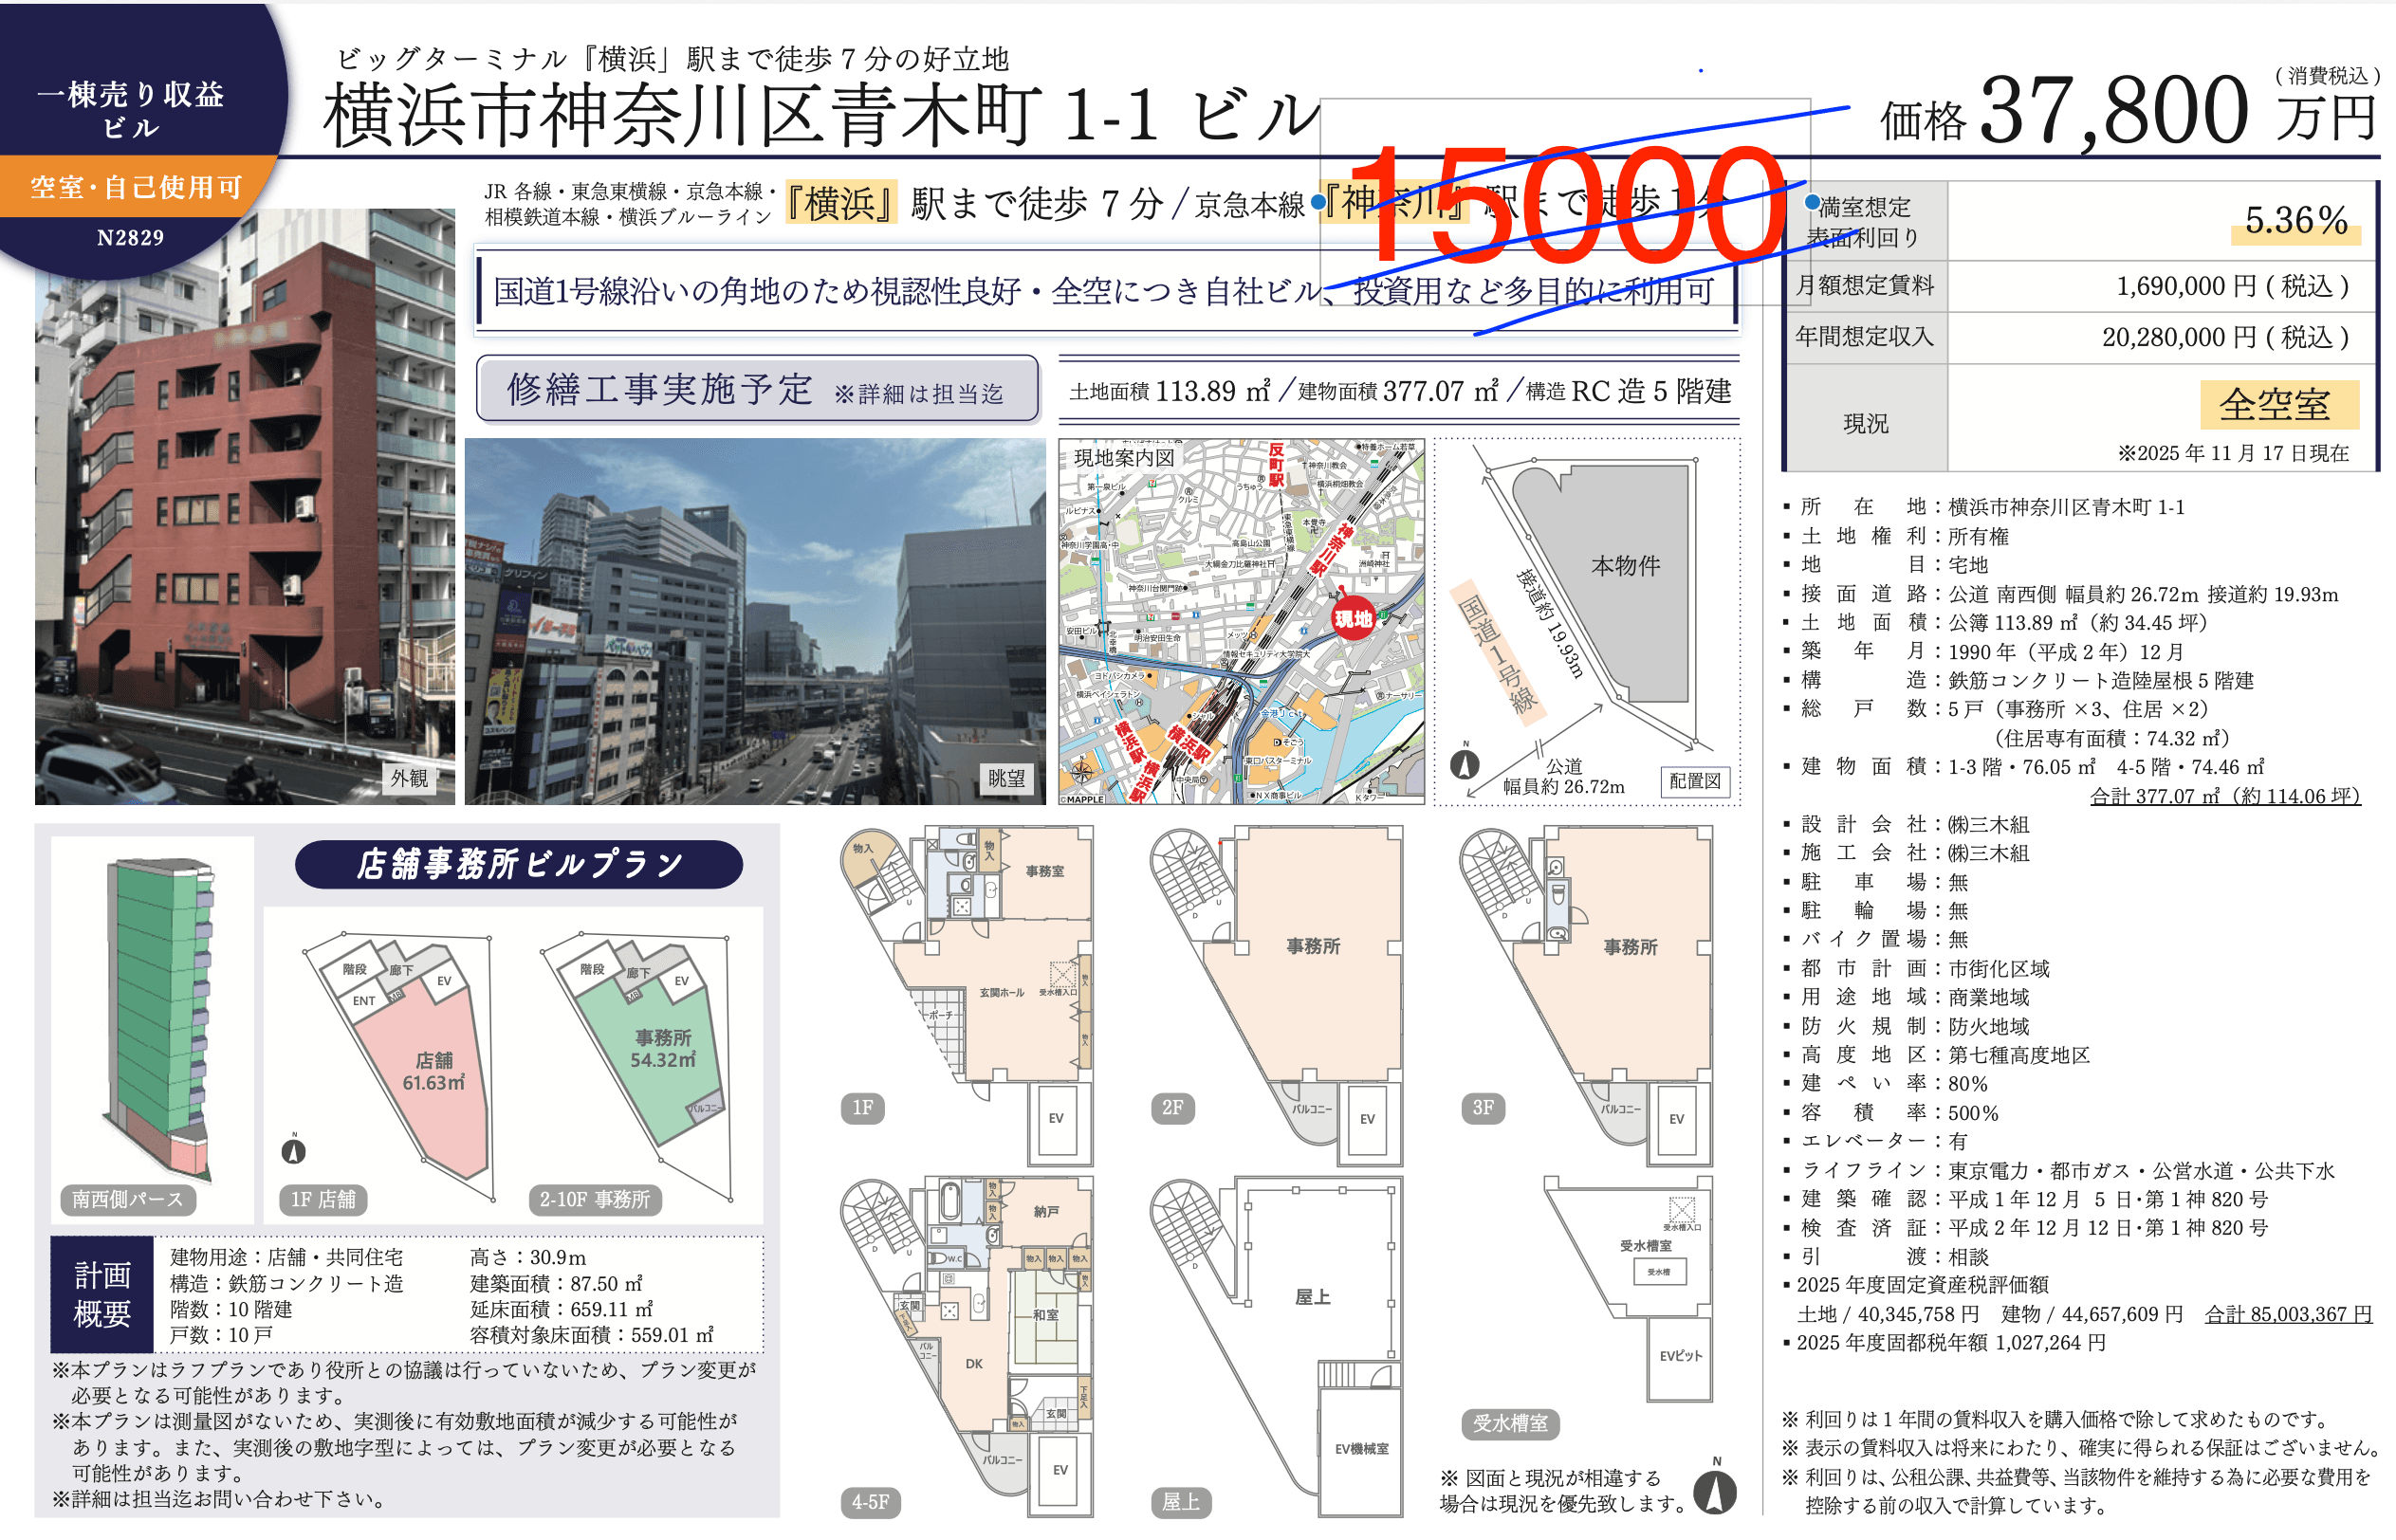
Find income buildings in Kanagawa-ku, Yokohama, Kanagawa
Individual listings, price-change history, closed transactions and AI valuations are available on a free account.